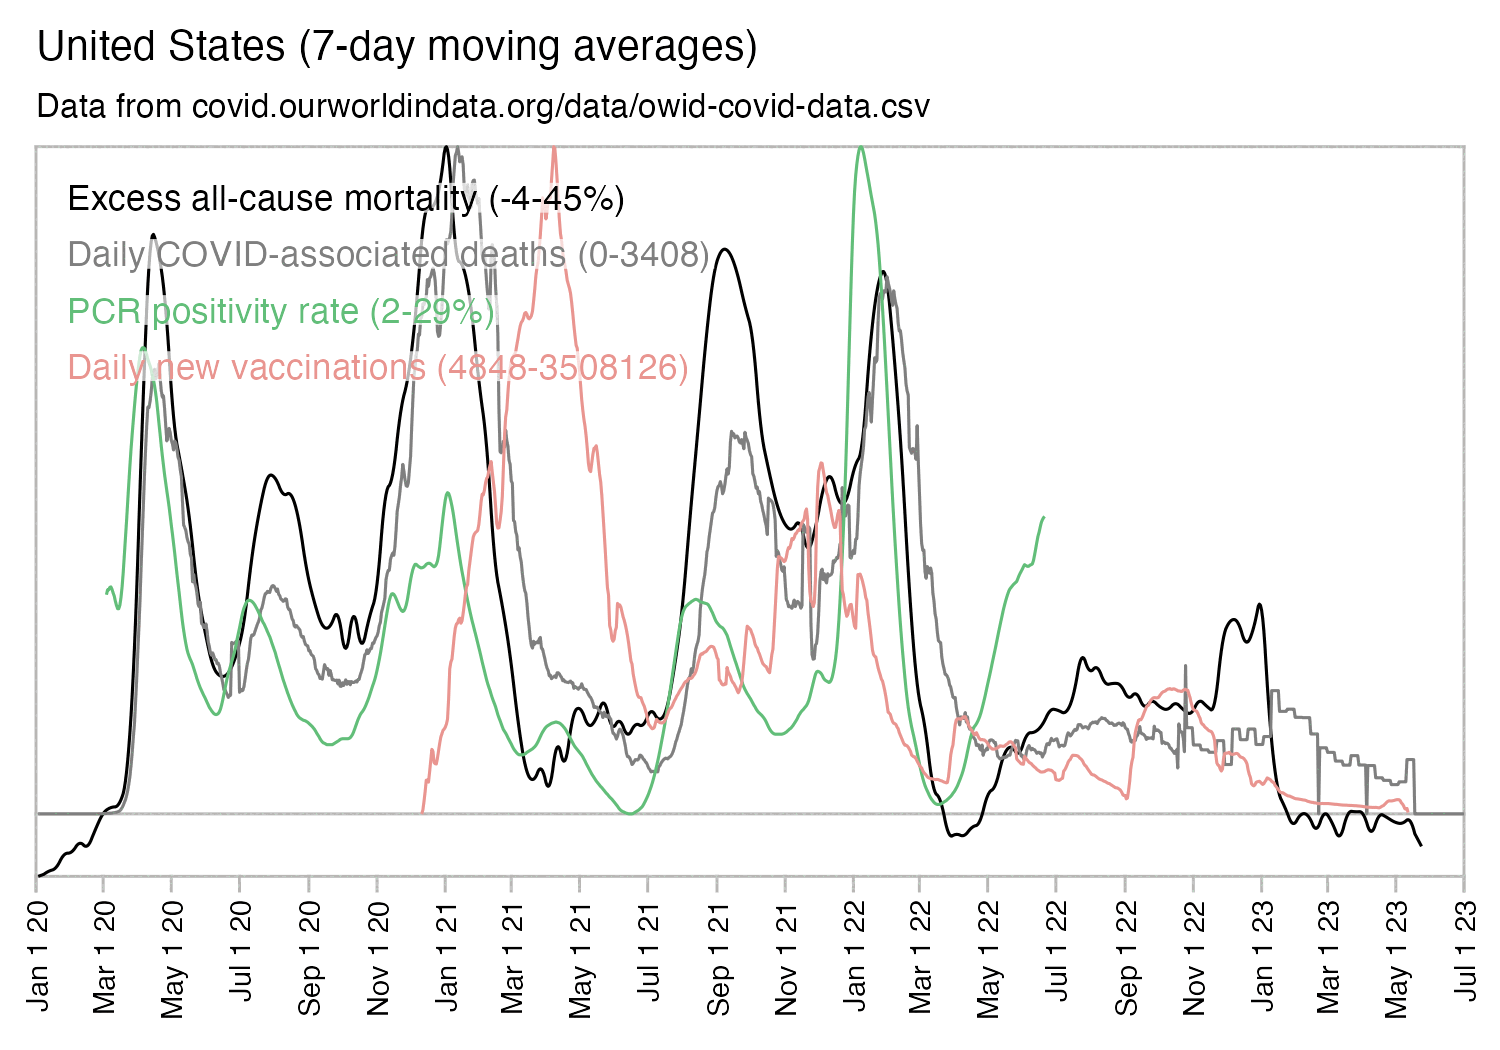
library(ggplot2)

# download.file("https://covid.ourworldindata.org/data/owid-covid-data.csv","owid-covid-data.csv")
t=read.csv("owid-covid-data.csv")

loc="United States"

t2=t[t$location==loc,c("date","excess_mortality","new_deaths","positive_rate","new_vaccinations")]|>data.frame(row.names=1)
t2$positive_rate=100*t2$positive_rate

mav=\(x,y){l=length(x);s=e=y%/%2;if(y%%2==0)s=s-1;setNames(sapply(1:l,\(i)mean(x[max(1,i-s):min(l,i+e)],na.rm=T)),names(x))}
t2=apply(t2,2,\(x)mav(zoo::na.approx(x,na.rm=F),7))|>`rownames<-`(rownames(t2))

names=read.csv(header=F,row.names=1,text="new_deaths,Daily COVID-associated deaths
positive_rate,PCR positivity rate
new_vaccinations,Daily new vaccinations
weekly_hosp_admissions,Weekly hospital admissions for COVID
excess_mortality,Excess all-cause mortality
new_tests,New tests performed")

ispct=c("excess_mortality","positive_rate")

colnames(t2)=paste0(names[colnames(t2),],ifelse(apply(t2,2,\(x)all(is.na(x))),"",paste0(" (",apply(round(apply(t2,2,range,na.rm=T)),2,paste,collapse="-"),ifelse(colnames(t2)%in%ispct,"%",""),")")))

mima0=\(x){m=max(0,min(x,na.rm=T),na.rm=T);(x-m)/(max(x,na.rm=T)-m)}
t2=apply(t2,2,mima0)

w2l=\(x)data.frame(x=rownames(x)[row(x)],y=unname(c(unlist(x))),z=colnames(x)[col(x)])
xy=w2l(t2)
xy=xy[!is.nan(xy$y),]
xy[,1]=as.Date(xy[,1])

group=factor(xy[,3],unique(xy[,3]))

xstart=as.Date("2020-01-01")
xend=as.Date("2023-07-01")
xbreak=seq(xstart,xend,"2 months")

color=c("black","gray50",hcl(135,60,70),hcl(15,60,70))

ylen=max(xy$y,na.rm=T)-min(xy$y,na.rm=T)
labels=data.frame(x=as.Date(xstart+.02*(xend-xstart)),y=seq(min(xy$y,na.rm=T)+.93*ylen,,-ylen/13,nlevels(group)),label=levels(group))

ggplot(xy,aes(x,y,color=group))+
geom_hline(yintercept=c(min(xy$y,na.rm=T),0,1),color="gray75",linewidth=.35,lineend="square")+
geom_vline(xintercept=c(xstart,xend),color="gray75",linewidth=.35,lineend="square")+
geom_segment(data=data.frame(x=xbreak,y=min(xy$y,na.rm=T),xend=xbreak,yend=min(xy$y,na.rm=T)-.02*ylen),aes(x,y,xend=xend,yend=yend),color="gray75",linewidth=.35,lineend="square")+
geom_line(linewidth=.35)+
geom_label(data=labels,aes(x=x,y=y,label=label),fill=alpha("white",.7),label.r=unit(0,"lines"),label.padding=unit(.04,"lines"),label.size=0,color=color[1:nlevels(group)],size=3,hjust=0)+
coord_cartesian(clip="off")+
scale_x_date(limits=c(xstart,xend),breaks=xbreak,expand=expansion(mult=0),date_labels="%b 1 %y")+
scale_y_continuous(expand=expansion(mult=c(0,0)))+
ggtitle(paste0(loc," (7-day moving averages)"),"Data from covid.ourworldindata.org/data/owid-covid-data.csv")+
scale_color_manual(values=color)+
guides(color=guide_legend(ncol=2,override.aes=list(fill=NA),byrow=T))+
theme(
  axis.text=element_text(size=7,color="black"),
  axis.text.x=element_text(angle=90,vjust=.5,hjust=1),
  axis.text.y=element_blank(),
  axis.ticks=element_blank(),
  axis.ticks.length=unit(0,"lines"),
  axis.title=element_blank(),
  legend.position="none",
  panel.background=element_rect(fill="white"),
  panel.grid=element_blank(),
  plot.background=element_rect(fill="white"),
  plot.margin=margin(.5,.6,.5,.6,"lines"),
  plot.subtitle=element_text(size=8),
  plot.title=element_text(size=10)
)

ggsave("1.png",width=5,height=3.5)

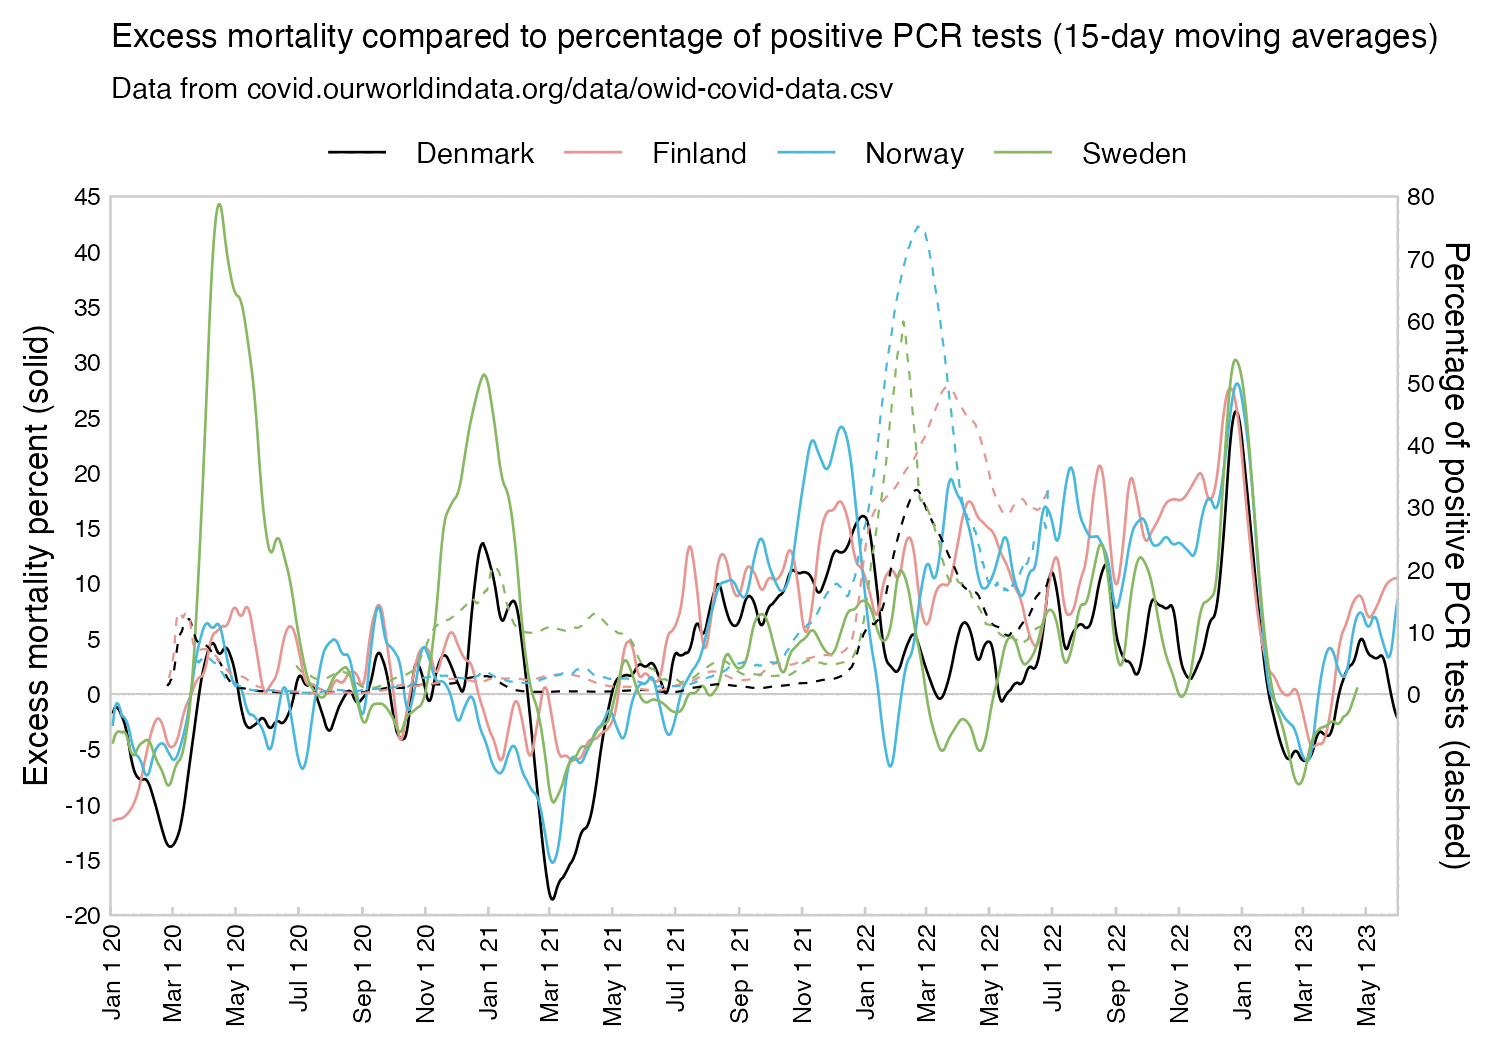
library(ggplot2)

# download.file("https://covid.ourworldindata.org/data/owid-covid-data.csv","owid-covid-data.csv")
t=read.csv("owid-covid-data.csv")
t2=t[,c("date","location","excess_mortality","positive_rate")]

t3=t2[t2[,2]%in%c("Sweden","Finland","Denmark","Norway"),]

mav=\(x,y){l=length(x);s=e=y%/%2;if(y%%2==0)s=s-1;setNames(sapply(1:l,\(i)mean(x[max(1,i-s):min(l,i+e)],na.rm=T)),names(x))}
naap=\(x)zoo::na.approx(x,na.rm=F)

t3[,3]=tapply(t3[,3],t3[,2],\(x)mav(naap(x),14))|>unlist()
t3[,4]=100*tapply(t3[,4],t3[,2],\(x)mav(naap(x),14))|>unlist()

t3$date=as.Date(t3$date)

xstart=as.Date("2020-01-01")
xend=as.Date("2023-06-01")

candidates=c(sapply(c(1,2,5),\(x)x*10^c(-2:5)))
ybreak=candidates[which.min(abs(candidates-max(t3[,3],na.rm=T)/6))]
ybreak2=candidates[which.min(abs(candidates-max(t3[,4],na.rm=T)/6))]
ystart=min(0,ybreak*floor(min(t3[,3],na.rm=T)/ybreak))
yend=ybreak*ceiling(max(t3[,3],na.rm=T)/ybreak)
yend2=ybreak2*ceiling(max(t3$positive_rate,na.rm=T)/ybreak2)
secmult=yend/yend2

group=factor(t3$location,levels=unique(t3$location))

hue=c(0,210,100,60,300,30,170,250)+15
color=c("black",hcl(hue,60,70),"gray50",hcl(hue,50,40))

ggplot(t3,aes(x=date,y=excess_mortality,color=group))+
geom_hline(yintercept=0,color="gray80",size=.25)+
geom_line(size=.3)+
geom_line(aes(y=secmult*positive_rate),linetype=2,size=.25)+
coord_cartesian(clip="off")+
scale_x_date(limits=c(xstart,xend),breaks=seq(xstart,xend,"2 months"),expand=expansion(mult=0),date_labels="%b 1 %y")+
scale_y_continuous(limits=c(ystart,yend),breaks=seq(ystart,yend,ybreak),expand=expansion(mult=c(0,0)),sec.axis=sec_axis(trans=~./secmult,breaks=seq(0,yend2,ybreak2),name="Percentage of positive PCR tests (dashed)"))+
labs(y="Excess mortality percent (solid)")+
ggtitle("Excess mortality compared to percentage of positive PCR tests (14-day moving averages)","Data from covid.ourworldindata.org/data/owid-covid-data.csv")+
scale_color_manual(values=color)+
guides(color=guide_legend(nrow=1,override.aes=list(fill=NA)))+
theme(
  axis.text=element_text(size=6,color="black"),
  axis.text.x=element_text(angle=90,vjust=.5,hjust=1),
  axis.ticks=element_blank(),
  axis.ticks.length=unit(0,"cm"),
  axis.ticks.x=element_line(linewidth=.3,color="gray80"),
  axis.ticks.length.x=unit(-.07,"cm"),
  axis.title=element_text(size=8),
  axis.title.x=element_blank(),
  legend.background=element_blank(),
  legend.key=element_rect(fill="white"),
  legend.box.just="center",
  legend.box.margin=margin(0,unit="cm"),
  legend.box.spacing=unit(0,"in"),
  legend.direction="vertical",
  legend.justification="center",
  legend.margin=margin(-8,0,2,0),
  legend.position="top",
  legend.text=element_text(size=7,vjust=.5),
  legend.title=element_blank(),
  panel.background=element_rect(fill="white"),
  panel.border=element_rect(color="gray80",fill=NA,size=.3),
  panel.grid=element_blank(),
  # panel.grid.major.x=element_line(size=.2,color="gray90"),
  plot.background=element_rect(fill="white"),
  plot.subtitle=element_text(size=7),
  plot.title=element_text(size=8)
)

ggsave("1.png",width=5,height=3.5)
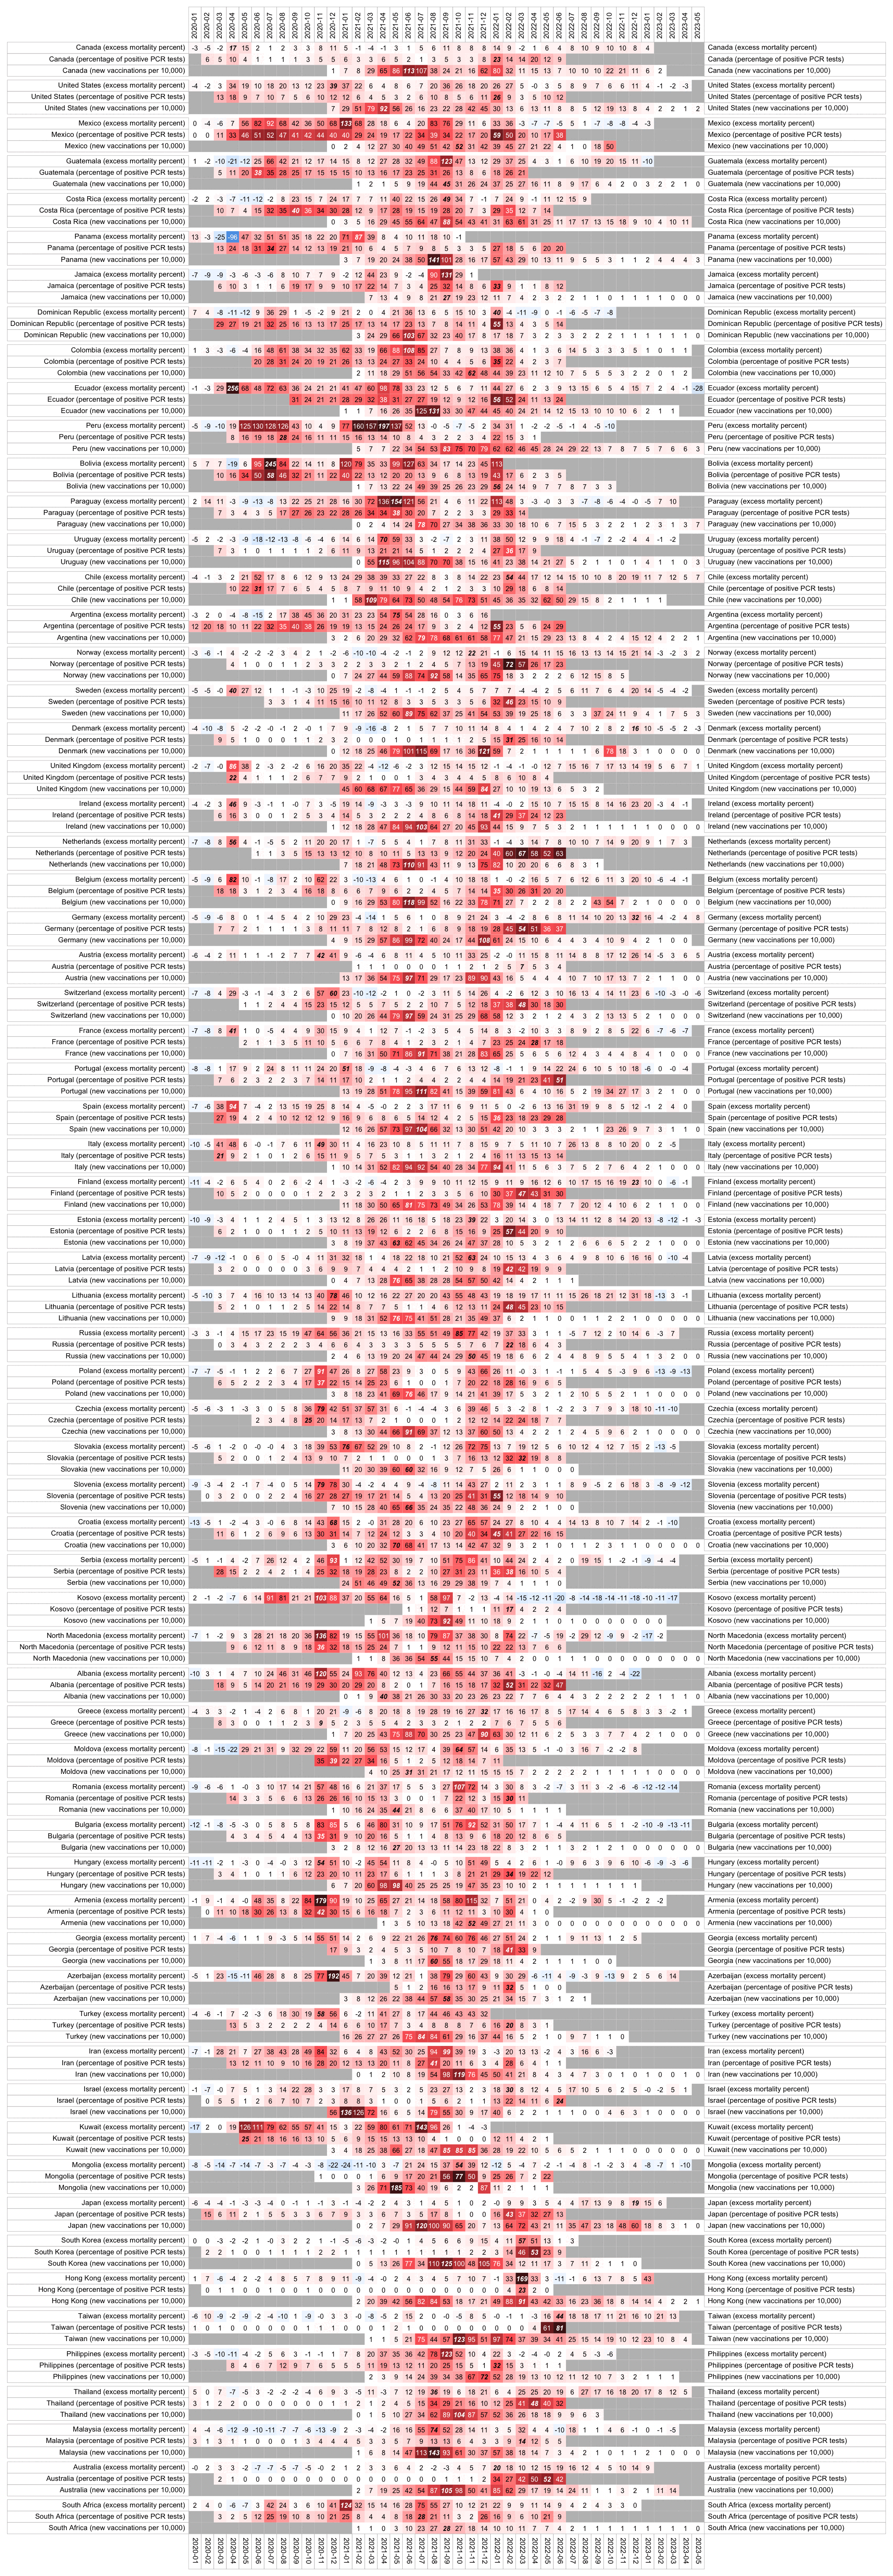
# install.packages("BiocManager")
# BiocManager::install("ComplexHeatmap")
# install.packages("circlize"
# install.packages("colorspace")

library(ComplexHeatmap)
library(colorspace)
library(circlize)

# download.file("https://covid.ourworldindata.org/data/owid-covid-data.csv","owid-covid-data.csv")
t=read.csv("owid-covid-data.csv")

t2=t[t$location%in%t$location[t$population>=1e6],]
t2=t2[,c("date","location","positive_rate","new_vaccinations_smoothed_per_million","excess_mortality")]

ag=aggregate(t2[,3:5],list(sub("-..$","",t2$date),t2[,2]),mean,na.rm=T)
ag=ag[ag[,2]%in%names(which(tapply(rowSums(is.na(ag[,3:5])),ag[,2],sum)<=50)),]

countryorder=strsplit("Canada
United States
Mexico
Guatemala
Costa Rica
Panama
Jamaica
Dominican Republic
Colombia
Ecuador
Peru
Bolivia
Paraguay
Uruguay
Chile
Argentina
Norway
Sweden
Denmark
United Kingdom
Ireland
Netherlands
Belgium
Germany
Austria
Switzerland
France
Portugal
Spain
Italy
Finland
Estonia
Latvia
Lithuania
Russia
Poland
Czechia
Slovakia
Slovenia
Croatia
Serbia
Kosovo
North Macedonia
Albania
Greece
Moldova
Romania
Bulgaria
Hungary
Armenia
Georgia
Azerbaijan
Turkey
Iran
Israel
Kuwait
Mongolia
Japan
South Korea
Hong Kong
Taiwan
Philippines
Thailand
Malaysia
Australia
South Africa","\n")[[1]]

ag=ag[ag[,2]%in%countryorder,]
ag=ag[order(match(ag[,2],countryorder)),]

df1=data.frame(x=ag[,1],y=paste(ag[,2],"(excess mortality percent)"),z=ag$excess_mortality)
df2=data.frame(x=ag[,1],y=paste(ag[,2],"(percentage of positive PCR tests)"),z=100*ag$positive_rate)
df3=data.frame(x=ag[,1],y=paste(ag[,2],"(new vaccinations per 10,000)"),z=ag$new_vaccinations_smoothed_per_million/100)

sc1=df1;sc1[,3]=sc1[,3]/170
sc2=df2;sc2[,3]=sc2[,3]/70
sc3=df3;sc3[,3]=sc3[,3]/150

l2w=\(x,row=1,col=2,val=3,sort=F){u1=unique(x[,row]);u2=unique(x[,col]);out=matrix(nrow=length(u1),ncol=length(u2),dimnames=list(u1,u2));out[cbind(x[,row],x[,col])]=x[,val];out}
ind=rep(1:nrow(sc1),each=3)+(0:2*nrow(sc1))
m=t(l2w(rbind(sc1,sc2,sc3)[ind,]))
disp=t(l2w(rbind(df1,df2,df3)[ind,]))

png("1.png",w=4000,h=10000,res=72)

ht_opt$COLUMN_ANNO_PADDING=unit(0,"mm")
ht_opt$ROW_ANNO_PADDING=unit(0,"mm")

rowmax=apply(m,1,\(x)x==max(x,na.rm=T))
rowmax[is.na(rowmax)]=F

Heatmap(
  m,
  show_heatmap_legend=F,
  show_column_names=F,
  show_row_names=F,
  width=unit(ncol(m)*30,"pt"),
  height=unit(nrow(m)*30,"pt"),
  row_dend_width=unit(200,"pt"),
  clustering_distance_rows="euclidean",
  cluster_columns=F,
  cluster_rows=F,
  row_split=rep(seq(nrow(m)/3),each=3),
  gap=unit(3,"mm"),
  row_title=NULL,
  rect_gp=gpar(col="gray80",lwd=0),
  top_annotation=columnAnnotation(text=anno_text(gt_render(colnames(m),padding=unit(c(3,3,3,3),"mm")),just="left",rot=90,location=unit(0,"npc"),gp=gpar(fontsize=17,border="gray70",lwd=1))),
  bottom_annotation=columnAnnotation(text=anno_text(gt_render(colnames(m),padding=unit(c(3,3,3,3),"mm")),just="left",rot=270,gp=gpar(fontsize=17,border="gray70",lwd=1))),
  left_annotation=rowAnnotation(text=anno_text(gt_render(rownames(m),padding=unit(c(3,3,3,3),"mm")),just="right",location=unit(1,"npc"),gp=gpar(fontsize=17,border="gray70",lwd=1))),
  right_annotation=rowAnnotation(text=anno_text(gt_render(rownames(m),padding=unit(c(3,3,3,3),"mm")),just="left",location=unit(0,"npc"),gp=gpar(fontsize=17,border="gray70",lwd=1))),
  col=colorRamp2(seq(-1,1,,9),hex(HSV(c(210,210,210,210,0,0,0,0,0),c(.7,.7,.6,.3,0,.3,.6,.7,.7),c(.3,.65,1,1,1,1,1,.65,.3)))),
  cell_fun=\(j,i,x,y,w,h,fill)grid.text(sprintf("%.0f",disp[i,j]),x,y,gp=gpar(fontface=ifelse(rowmax[j,i],4,"plain"),fontsize=16,col=ifelse(abs(m[i,j])>=.5,"white","black")))
)

dev.off()
system("mogrify -gravity center -trim -border 16 -bordercolor white 1.png")
This displays only dates where the column for excess mortality is not empty.
$ wget -q https://raw.githubusercontent.com/owid/covid-19-data/master/public/data/owid-covid-data.csv
$ brew install csvtk
[...]
$ csvtk -T cut -flocation,date,excess_mortality,people_vaccinated_per_hundred,positive_rate,new_tests owid-covid-data.csv|awk -F\\t 'NR==1||($1=="Taiwan"&&$3)'|csvtk -t pretty
location   date         excess_mortality   people_vaccinated_per_hundred   positive_rate   new_tests
--------   ----------   ----------------   -----------------------------   -------------   ---------
Taiwan     2020-01-31   -5.91                                              0.0096          93.0
Taiwan     2020-02-29   10.38                                              0.0037          511.0
Taiwan     2020-03-31   -8.55                                              0.0177          924.0
Taiwan     2020-04-30   -2.25                                              0.0005          495.0
Taiwan     2020-05-31   -9.21                                              0.0007          237.0
Taiwan     2020-06-30   -2.32                                              0.0008          210.0
Taiwan     2020-07-31   -3.57                                              0.0063          235.0
Taiwan     2020-08-31   -9.72                                              0.0008          215.0
Taiwan     2020-09-30   0.99                                               0.0032          260.0
Taiwan     2020-10-31   -9.25                                              0.0031          93.0
Taiwan     2020-11-30   -0.25                                              0.0204          337.0
Taiwan     2020-12-31   2.84                                               0.0052          507.0
Taiwan     2021-01-31   3.33                                               0.0021          872.0
Taiwan     2021-02-28   -0.27                                              0.0041          197.0
Taiwan     2021-03-31   -7.63              0.06                            0.0048          965.0
Taiwan     2021-04-30   -4.6               0.24                            0.0066          854.0
Taiwan     2021-05-31   1.88                                               0.0232          28428.0
Taiwan     2021-06-30   15.29              8.38                            0.0027          30914.0
Taiwan     2021-07-31   1.58                                               0.0008          17523.0
Taiwan     2021-08-31   0.06               42.01                           0.0004          28547.0
Taiwan     2021-09-30   -0.41              55.43                           0.0003          19966.0
Taiwan     2021-10-31   -4.74              72.05                           0.0004          11066.0
Taiwan     2021-11-30   8.16               76.37                           0.0006          17369.0
Taiwan     2021-12-31   4.94               78.32                           0.0016          14391.0
Taiwan     2022-01-31   -0.39                                              0.0026          10521.0
Taiwan     2022-02-28   -1.46              80.95                           0.0032          19725.0
Taiwan     2022-03-31   1.29               81.43                           0.0053          34369.0
Taiwan     2022-04-30   -3.43                                              0.1526          56200.0
Taiwan     2022-05-31   15.75              86.25                           0.8106          108382.0
Taiwan     2022-06-30   43.64              88.64
Taiwan     2022-07-31   17.57              89.22
Taiwan     2022-08-31   17.66              90.08
Taiwan     2022-09-30   16.55              90.91
Taiwan     2022-10-31   11.45              91.14
Taiwan     2022-11-30   21.39              91.27
Taiwan     2022-12-31   16.28
Taiwan     2023-01-31   9.51               91.47
Taiwan     2023-02-28   20.82              91.53
Taiwan     2023-03-31   12.93
Taiwan     2023-04-30   1.21
Taiwan     2023-05-31   14.95
Taiwan     2023-06-30   17.24
Taiwan     2023-07-31   14.58
library(ggplot2)

# download.file("https://covid.ourworldindata.org/data/owid-covid-data.csv","owid-covid-data.csv")

t=read.csv("owid-covid-data.csv")
t2=t[,c("date","location","excess_mortality","positive_rate","new_vaccinations","continent")]

# # replace all NA values with zeroes
# t2$new_vaccinations[is.na(t2$new_vaccinations)]=0

# # replace NA values after the first non-NA with zeroes
# t2$new_vaccinations=unlist(split(t2$new_vaccinations,t2$location,\(x){nna=which(!is.na(x))[1];ifelse(is.na(x)&seq_along(x)>nna,0,x)}))

# pick=names(tail(sort(tapply(t2[,4],t2[,2],\(x)sum(!is.na(x)))+tapply(t2[,3],t2[,2],\(x)sum(!is.na(x)))),32))
pick=strsplit("Argentina,Australia,Bolivia,Brazil,Chile,Colombia,Ecuador,Malaysia,New Zealand,Paraguay,Peru,Philippines,Singapore,South Africa,Suriname,Thailand,Uruguay",",")[[1]]
t2=t2[t2$location%in%pick,]

mav=\(x,y){l=length(x);s=e=y%/%2;if(y%%2==0)s=s-1;setNames(sapply(1:l,\(i)mean(x[max(1,i-s):min(l,i+e)],na.rm=T)),names(x))}
naap=\(x)zoo::na.approx(x,na.rm=F)

cor1=sapply(split(t2,t2$location),\(x)tryCatch(cor(mav(naap(x[,3]),7),mav(naap(x[,4]),3),use="complete.obs"),error=\(x)NA))
cor2=sapply(split(t2,t2$location),\(x)tryCatch(cor(mav(naap(x[,3]),7),mav(naap(x[,5]),3),use="complete.obs"),error=\(x)NA))

pick=names(which(cor1&cor2))
xy=na.omit(data.frame(x=cor1[pick],y=cor2[pick]))

expand=(max(xy)-min(xy))/20
# lims=c(min(apply(xy,2,range))-expand,max(apply(xy,2,range))+expand)
lims=c(min(xy)-.05,1)

k=as.factor(setNames(t$continent,t$location)[rownames(xy)])

color=hcl(sample(seq(15,375,,nlevels(k)+1)[-1]),95,60)

ggplot(xy,aes(x,y))+
geom_vline(xintercept=c(0,1),color="gray80",linewidth=.3)+
geom_hline(yintercept=c(0,1),color="gray80",linewidth=.3)+
geom_abline(linetype="dashed",color="gray80",linewidth=.3)+
ggforce::geom_mark_hull(aes(color=k,fill=k),concavity=1000,radius=unit(.4,"lines"),expand=unit(.4,"lines"),alpha=.2,size=.15)+
geom_point(aes(color=k),size=.5)+
# geom_text(aes(color=k),label=name,size=2.2,vjust=-.7)+
ggrepel::geom_text_repel(aes(color=k),label=rownames(xy),size=2.2,max.overlaps=Inf,segment.size=.1,min.segment.length=.2,box.padding=.07)+
coord_cartesian(xlim=lims,ylim=lims,expand=F,clip="off")+
scale_x_continuous(breaks=seq(-1,1,.2))+
scale_y_continuous(breaks=seq(-1,1,.2))+
labs(x="Correlation between excess mortality and daily percentage of positive PCR tests",y="Correlation between excess mortality and daily number of new vaccinations")+
scale_fill_manual(values=color)+
scale_color_manual(values=color)+
theme(
  axis.text=element_text(size=6,color="black"),
  axis.text.y=element_text(angle=90,vjust=1,hjust=.5),
  axis.ticks=element_blank(),
  axis.ticks.length=unit(0,"cm"),
  axis.title=element_text(size=8),
  legend.position="none",
  panel.background=element_rect(fill="white"),
  panel.border=element_rect(color="gray80",fill=NA,linewidth=.3),
  panel.grid.major=element_line(color="gray90",linewidth=.2),
  plot.margin=margin(.7,.7,.7,.7,"lines")
)

ggsave("1.png",width=4.5,height=4.5)
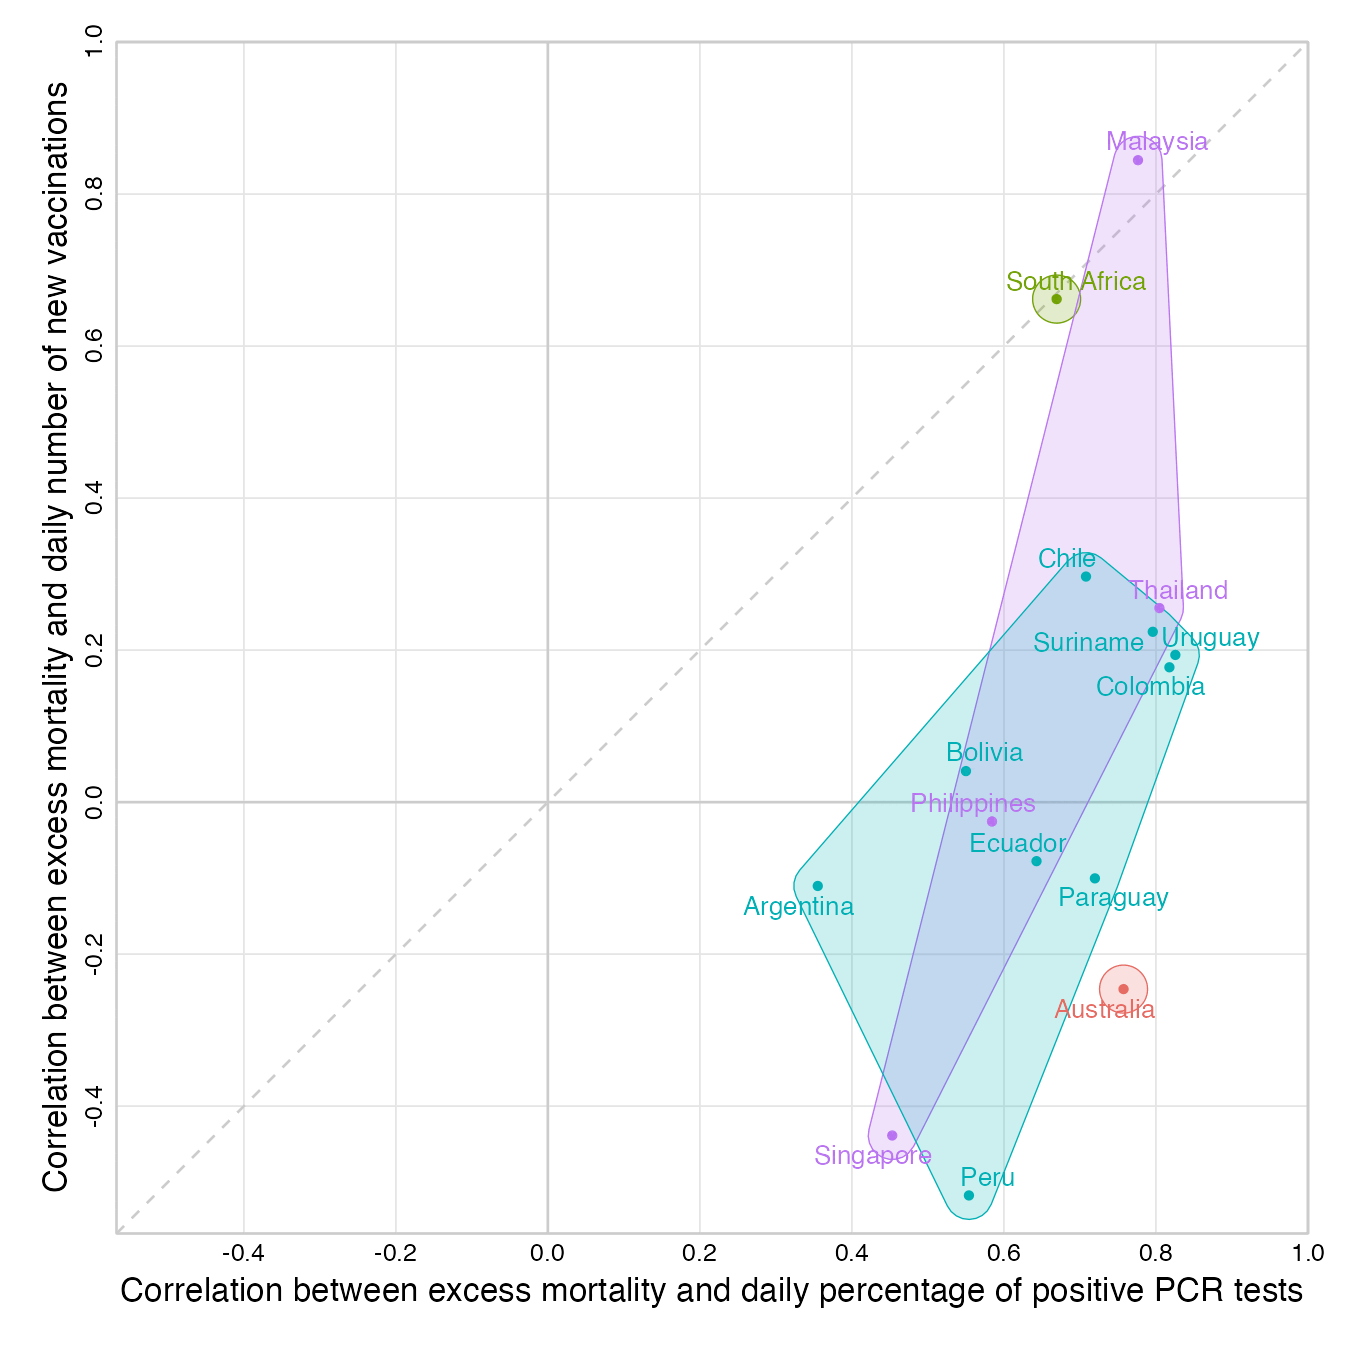
library(ggplot2)

# download.file("https://covid.ourworldindata.org/data/owid-covid-data.csv","owid-covid-data.csv")

t=read.csv("owid-covid-data.csv")

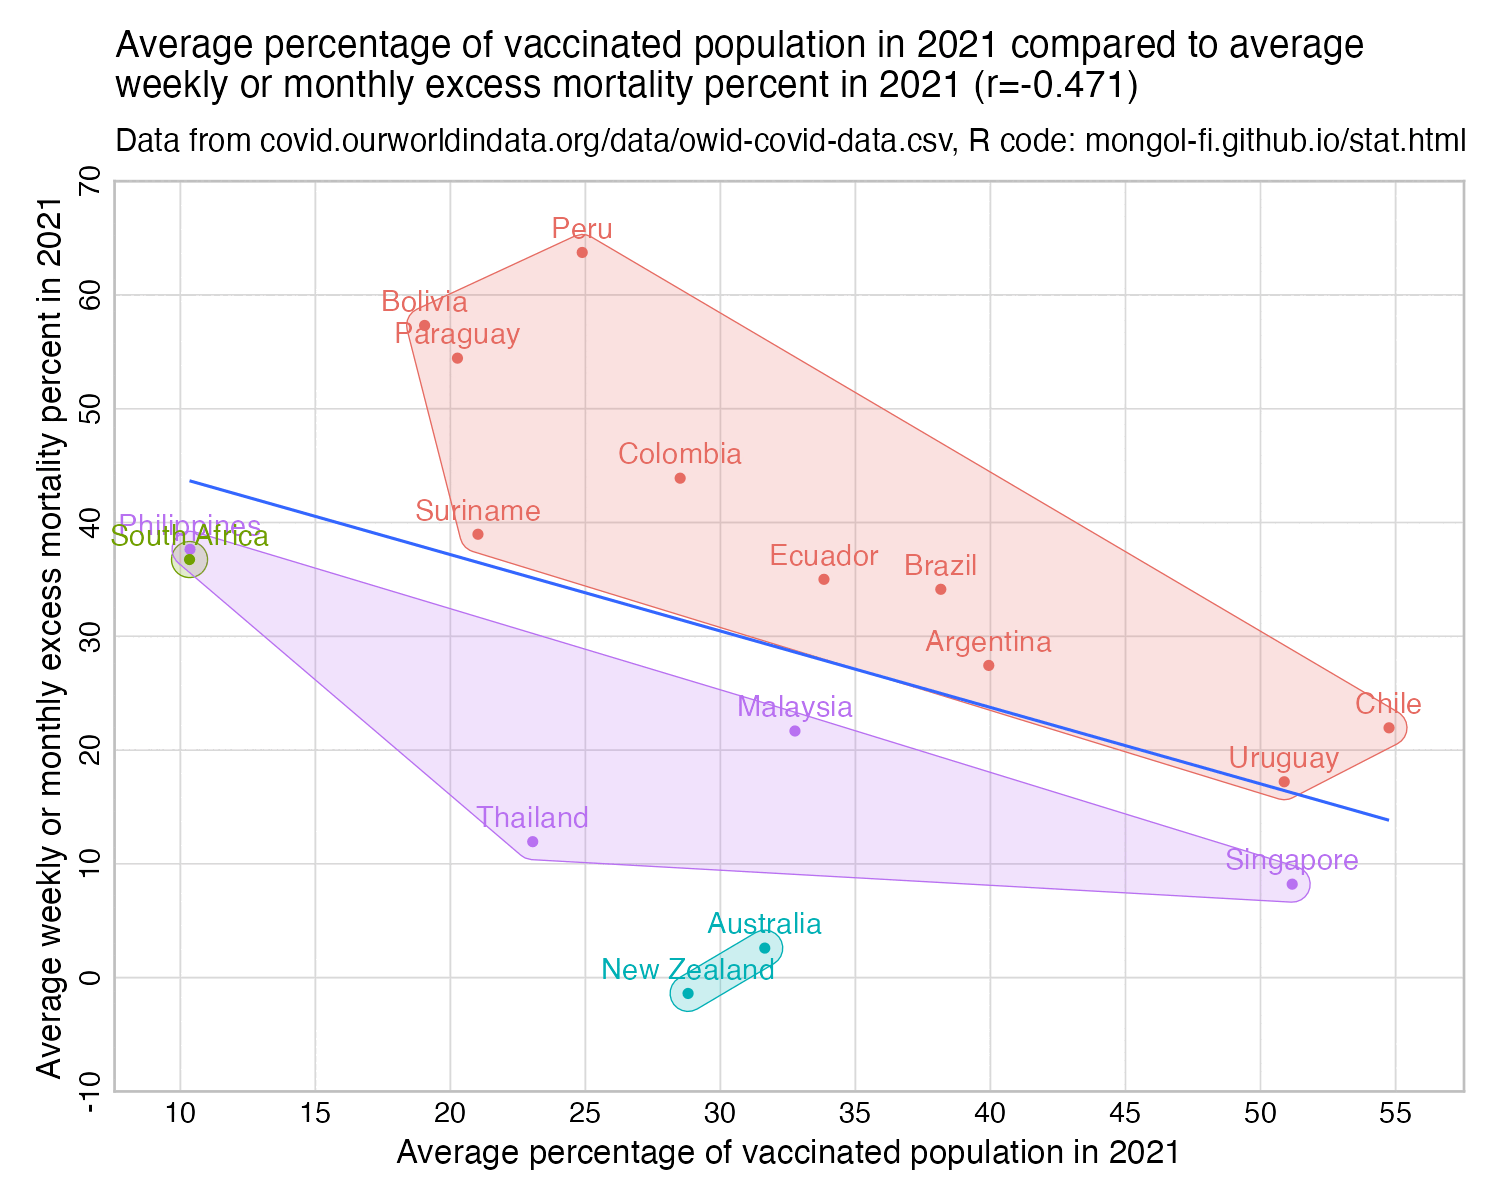
t2=t[grepl("2021",t$date)&t$location%in%strsplit("Australia,Chile,Colombia,Ecuador,New Zealand,Peru,South Africa,Argentina,Bolivia,Brazil,Malaysia,Paraguay,Philippines,Singapore,Suriname,Thailand,Uruguay",",")[[1]],]

excess=tapply(t2$excess_mortality,t2$location,mean,na.rm=T)
vax=tapply(t2$people_vaccinated_per_hundred,t2$location,\(x){n=zoo::na.approx(x,na.rm=F);n[is.na(n)]=0;mean(n)})
xy=data.frame(x=vax,y=excess)

k=as.factor(setNames(t$continent,t$location)[rownames(xy)])

color=hcl(sample(seq(15,375,,nlevels(k)+1)[-1]),95,60)

candidates=c(sapply(c(1,2,5),\(x)x*10^c(-10:10)))
xstep=candidates[which.min(abs(candidates-max(xy$x)/8))]
ystep=candidates[which.min(abs(candidates-max(xy$y)/6))]
xstart=xstep*floor(min(xy$x)/xstep)
xend=xstep*ceiling(max(xy$x)/xstep)
ystart=ystep*floor(min(xy$y)/ystep)
yend=ystep*ceiling(max(xy$y)/ystep)

ggplot(xy,aes(x,y))+
geom_vline(xintercept=c(xstart,xend),color="gray75",linewidth=.3,lineend="square")+
geom_hline(yintercept=c(ystart,yend),color="gray75",linewidth=.3,lineend="square")+
ggforce::geom_mark_hull(aes(color=k,fill=k),concavity=1000,radius=unit(.3,"lines"),expand=unit(.3,"lines"),alpha=.2,size=.15)+
geom_smooth(method="lm",formula=y~x,size=.35,se=F)+
geom_point(aes(color=k),size=.6)+
geom_text(aes(color=k),label=rownames(xy),size=2.5,vjust=-.7)+
# ggrepel::geom_text_repel(aes(color=k),label=rownames(xy),size=2.5,max.overlaps=Inf,segment.size=.1,min.segment.length=.2,box.padding=.07)+
coord_cartesian(clip="off")+
ggtitle(paste0("Average percentage of vaccinated population in 2021 compared to average\nweekly or monthly excess mortality percent in 2021 (r=",sprintf("%.3f",cor(xy$x,xy$y)),")"),"Data from covid.ourworldindata.org/data/owid-covid-data.csv, R code: sars2.net/stat.html")+
labs(x="Average percentage of vaccinated population in 2021",y="Average weekly or monthly excess mortality percent in 2021")+
scale_x_continuous(limits=c(xstart,xend),breaks=seq(xstart,xend,xstep),expand=expansion(0))+
scale_y_continuous(limits=c(ystart,yend),breaks=seq(ystart,yend,ystep),expand=expansion(0))+
scale_fill_manual(values=color)+
scale_color_manual(values=color)+
theme(
  axis.text=element_text(size=7,color="black"),
  axis.text.y=element_text(angle=90,vjust=1,hjust=.5),
  axis.ticks=element_blank(),
  axis.ticks.length=unit(0,"lines"),
  axis.title=element_text(size=8),
  legend.position="none",
  panel.background=element_rect(fill="white"),
  panel.grid.major=element_line(color="gray85",linewidth=.2),
  plot.margin=margin(.5,.6,.5,.6,"lines"),
  plot.subtitle=element_text(size=7.5),
  plot.title=element_text(size=9)
)

ggsave("1.png",width=5,height=4)
download.file("https://covid.ourworldindata.org/data/owid-covid-data.csv","owid-covid-data.csv")
t=read.csv("owid-covid-data.csv")

t2=t[t$location%in%c("Germany","Australia","South Korea","Canada"),]

naap=\(x)zoo::na.approx(x,na.rm=F)
pcr=unlist(tapply(t2$positive_rate,t2$location,\(x){x[1:(which(!is.na(x))[1]-1)]=0;naap(x)}))
vax=unlist(tapply(t2$new_vaccinations,t2$location,\(x){x[1:(which(!is.na(x))[1]-1)]=0;naap(x)}))
excess=unlist(tapply(t2$excess_mortality,t2$location,naap))

d=data.frame(location=t2$location,pcr,vax,excess)[t2$date<"2023-01-01"&t2$date>="2021-01-01",]
cor_vax_excess=sapply(split(d,d$location),\(x)cor(x$excess,x$vax,use="complete.obs"))
cor_pcr_excess=sapply(split(d,d$location),\(x)cor(x$excess,x$pcr,use="complete.obs"))
round(cbind(cor_vax_excess,cor_pcr_excess),2)
Output:
            cor_vax_excess cor_pcr_excess
Australia            -0.12           0.76
Canada               -0.17           0.24
Germany              -0.06          -0.03
South Korea          -0.11           0.93
This treats the number of new vaccines as zero before the data for the number of new vaccines starts, but in the case of some countries the data for the number of new vaccines starts long after the vaccine rollout, so it might be better to ignore days with no data for the number of new vaccines.
The use="complete.obs" argument for cor
only includes values at indexes where neither compared vector is NA.
zoo::na.approx uses linear interpolation to fill in NA
values:
> v=c(NA,NA,1,NA,3,NA,NA,NA,2,NA)
> zoo::na.approx(v)
[1] 1.00 2.00 3.00 2.75 2.50 2.25 2.00
> zoo::na.approx(v,na.rm=F) # don't remove NA values from start or end of vector
[1]   NA   NA 1.00 2.00 3.00 2.75 2.50 2.25 2.00   NA
> download.file("https://covid.ourworldindata.org/data/owid-covid-data.csv","owid-covid-data.csv")
> t=read.csv("owid-covid-data.csv")
> t2=t[nrow(t):1,]
> t2=t2[!is.na(t2$people_vaccinated_per_hundred),]
> t2=t2[!duplicated(t2$location),]
> t2=t2[order(-t2$population),]
> t2[1:10,c("people_vaccinated_per_hundred","location","population","date")]|>print.data.frame(row.names=F)
 people_vaccinated_per_hundred            location population       date
                         70.49               World 7975105024 2023-09-17
                         78.04                Asia 4721383370 2023-09-17
                         66.30 Lower middle income 3432097300 2023-09-17
                         83.42 Upper middle income 2525921300 2023-09-16
                         38.63              Africa 1426736614 2023-08-20
                         91.89               China 1425887360 2023-02-09
                         72.50               India 1417173120 2023-09-17
                         79.86         High income 1250514600 2023-09-16
                         70.20              Europe  744807803 2023-09-16
                         32.58          Low income  737604900 2023-09-05
With my custom R functions, you could write the same code using a concatenative programming style like this:
`|`=magrittr::`%>%` # get a single-character pipe operator
rc\(x='stdin",check.names=F,...)read.csv(x,check.names=check.names,...) # read CSV
ubl=\(x,...){x=x[nrow(x):1,];x=x[!duplicated(x[,c(...)]),];x[nrow(x):1,]} # select unique rows by column and keep the last row with each unique value
nnan=\(x,y)x[!is.na(x[,y]),] # select rows where the specified column is not NA
obcr=\(x,y){if(y<0)y=ncol(x)+y+1;x[order(-x[,y]),]} # order by column reverse
h=\(x,y=1)head(x,y) # head
K=\(x,...)x[,sapply(match.call(expand.dots=F)$...,deparse)] # select kolumns
tab2=\(x)apply(apply(rbind(colnames(x),x),2,\(c)sprintf(paste0('%",max(nchar(c)),'s'),c)),1,paste,collapse=" ") # format monospace table with rownames
tap2=\(x)writeLines(tab2(x)) # print monospace table with rownames

"owid-covid-data.csv"|rc|nnan("people_vaccinated_per_hundred")|ubl("location")|obcr("population")|h(10)|K(people_vaccinated_per_hundred,location,population,date)|tap2
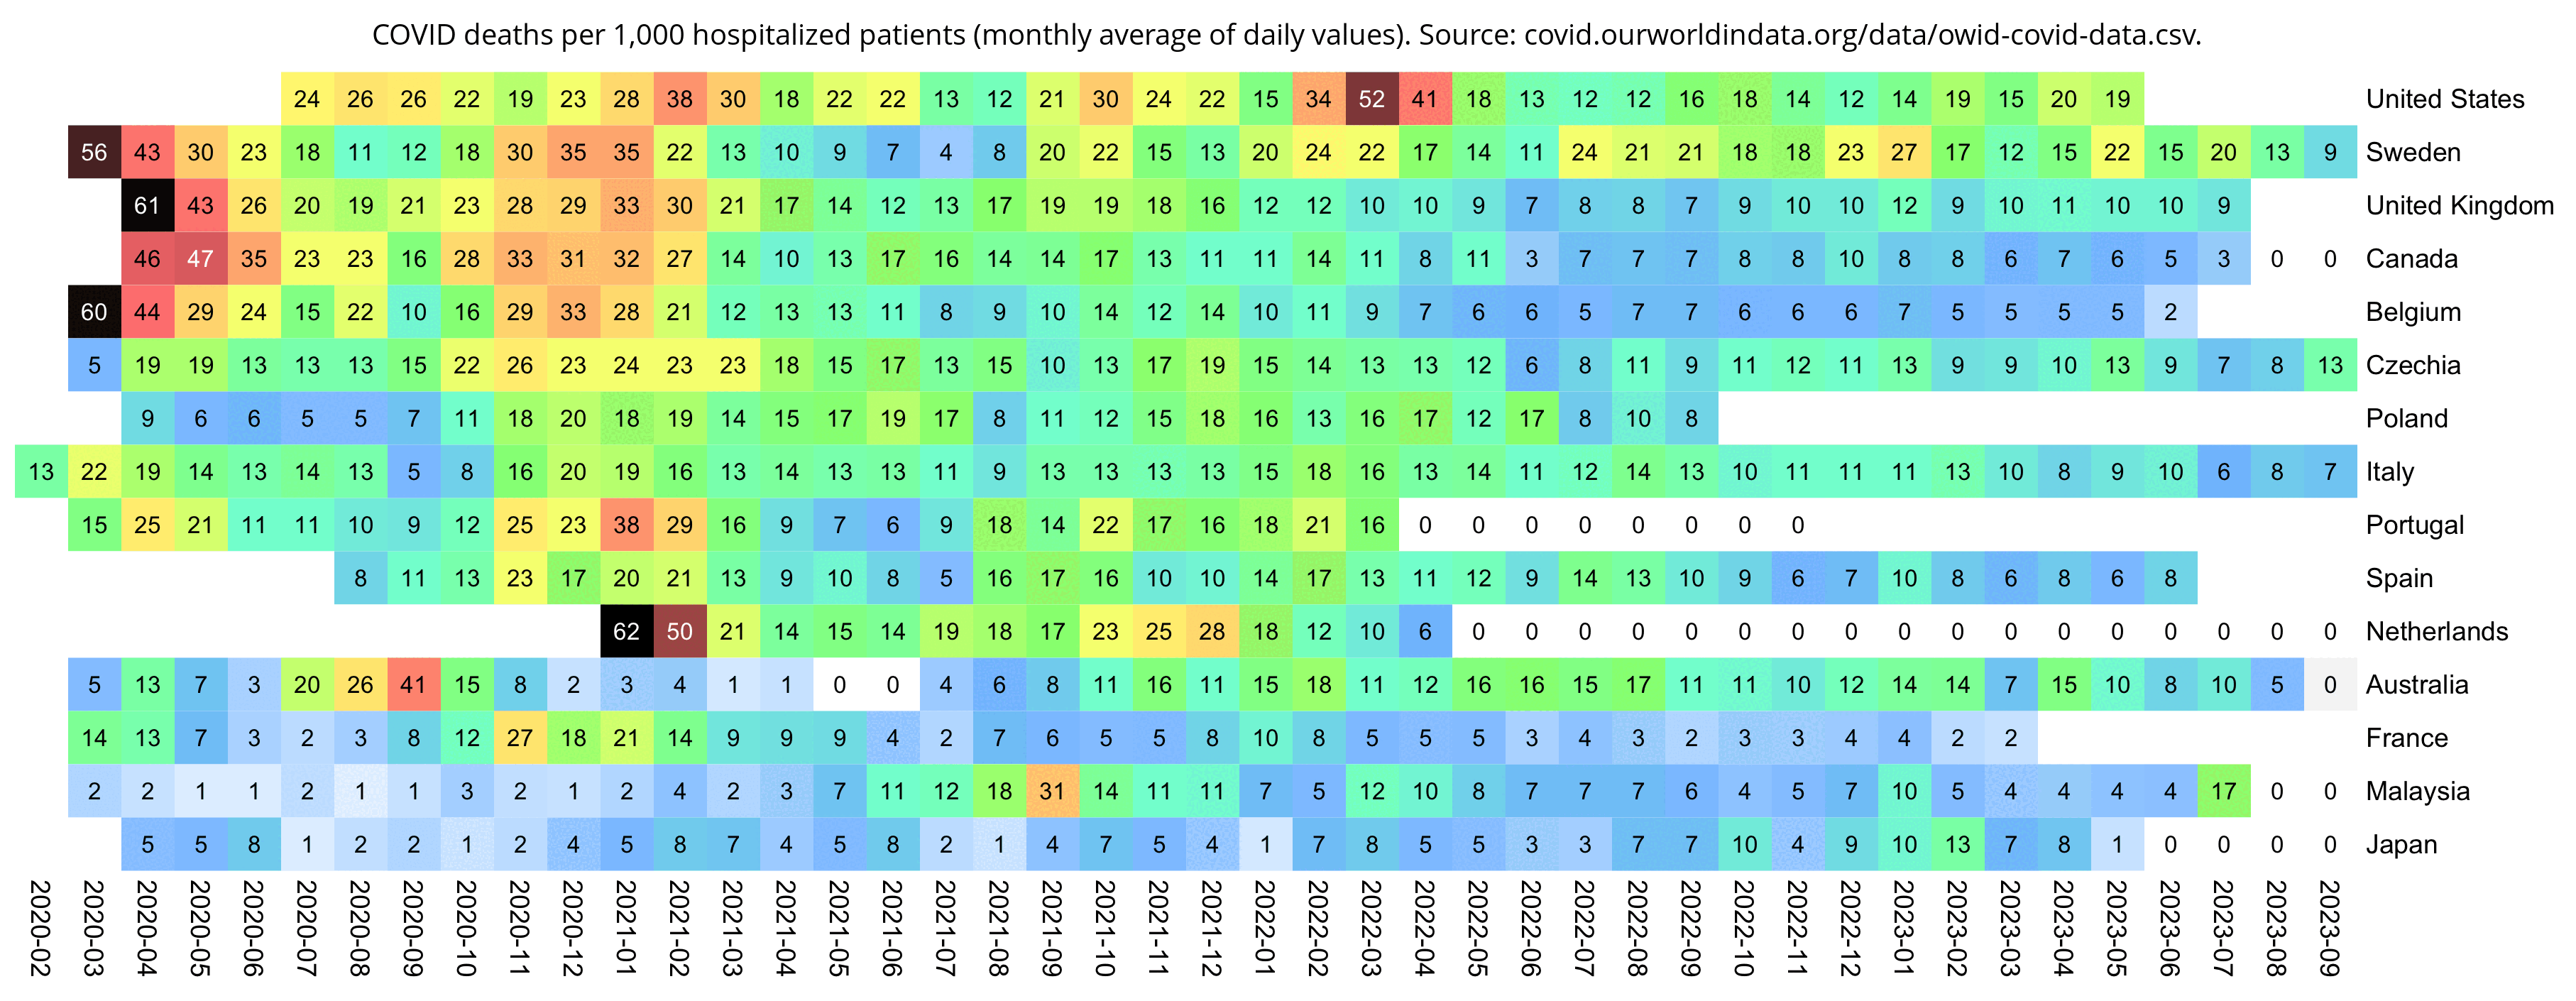
download.file("https://covid.ourworldindata.org/data/owid-covid-data.csv","owid-covid-data.csv")
t=read.csv("owid-covid-data.csv")

t2=t[t$population>=1e7,]
t2=na.omit(t2[,c("date","location","new_deaths","hosp_patients")])
t2=t2[t2$hosp_patients!=0,]

m=tapply(1000*t2$new_deaths/t2$hosp_patients,list(t2$location,sub("...$","",t2$date)),mean,na.omit=T)

m=m[rowSums(is.na(m))<15,]

m=m[order(-rowMeans(m,na.rm=T)),]
disp=round(m)
m=m^.7

pheatmap::pheatmap(
  m,
  filename="0.png",
  legend=F,
  cluster_rows=F,
  cluster_cols=F,
  cellwidth=18,
  cellheight=18,
  fontsize=9,
  fontsize_number=8,
  border_color=NA,
  display_numbers=disp,
  na_col="white",
  number_color=ifelse(m>.82*max(m,na.rm=T),"white","black"),
  colorRampPalette(colorspace::hex(colorspace::HSV(c(210,210,210,160,110,60,40,20,0,0,0),c(0,.25,rep(.5,9)),c(rep(1,9),.5,0))))(256)
)

system("convert -gravity center -pointsize 40 label:'COVID deaths per 1,000 hospitalized patients (monthly average of daily values). Source: covid.ourworldindata.org/data/owid-covid-data.csv.' -gravity north -splice 0x20 0.png -append 1.png")
library(ggplot2)
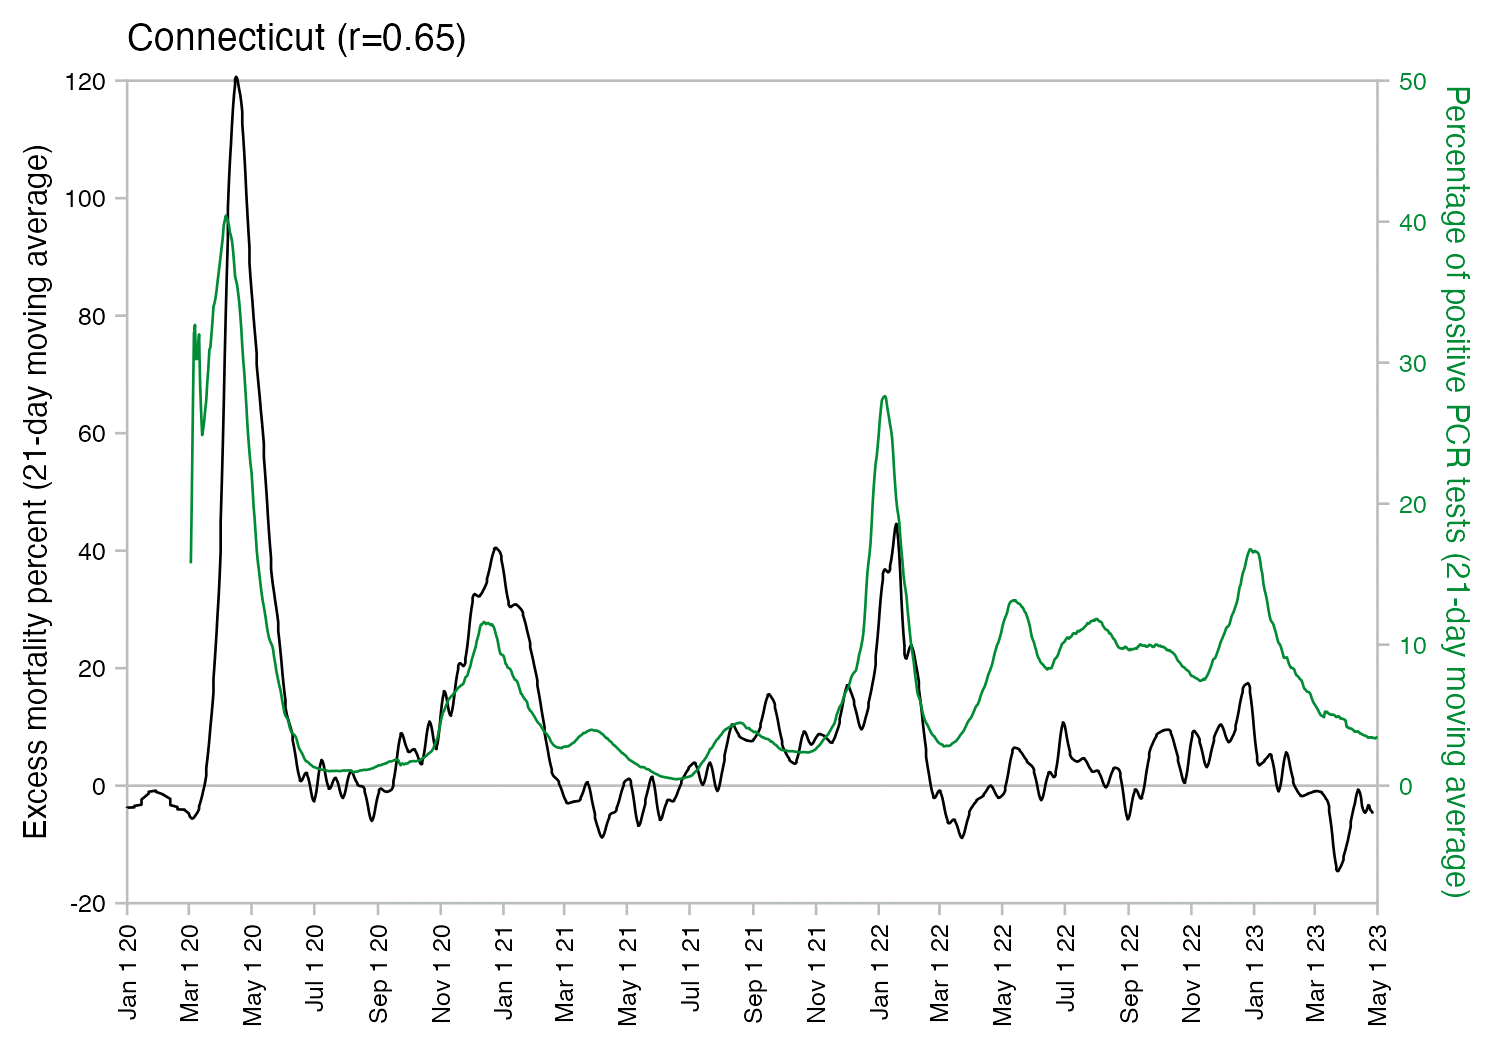
library(zoo)

mav=\(x,y){l=length(x);s=e=y%/%2;if(y%%2==0)s=s-1;setNames(sapply(1:l,\(i)mean(x[max(1,i-s):min(l,i+e)],na.rm=T)),names(x))}

download.file("https://healthdata.gov/api/views/j8mb-icvb/rows.csv","statespcr.csv") # https://healthdata.gov/dataset/COVID-19-Diagnostic-Laboratory-Testing-PCR-Testing/j8mb-icvb
download.file("https://data.cdc.gov/api/views/xkkf-xrst/rows.csv","statesexcess.csv") # https://www.cdc.gov/nchs/nvss/vsrr/covid19/excess_deaths.htm

pcr=read.csv("statespcr.csv")
excess=read.csv("statesexcess.csv")

for(state in intersect(pcr$state_name,excess$State)){
  pcr2=pcr[pcr$state_name==state,]
  pcr3=pcr2[pcr2$overall_outcome=="Positive",c(6,7)]|>merge(pcr2[pcr2$overall_outcome=="Negative",c(6,7)],by=1,all=T)

  pos=mav(pcr3[,2],21)
  neg=mav(pcr3[,3],21)
  df4=data.frame(date=as.Date(pcr3$date),pcrrate=100*pos/(pos+neg))
  df4$pcrrate[mav(rowSums(pcr3[,-1]),10)<30]=NA

  excess2=excess[excess$State==state&excess$Outcome=="All causes"&excess$Year>=2020&excess$Week.Ending.Date<="2023-05-01",]
  df5=data.frame(date=as.Date(excess2$Week.Ending.Date)-3,excess=100*(excess2$Observed.Number/excess2$Average.Expected.Count-1))

  xy=merge(df5,df4,all=T)
  nonna=1:tail(which(!is.na(xy$excess)),1)
  xy$excess[nonna]=mav(zoo::na.approx(xy$excess[nonna],na.rm=F),3)

  xstart=as.Date("2020-01-01")
  xend=as.Date("2023-05-01")
  xy=xy[xy$date>=xstart&xy$date<=xend,]

  # candidates=c(sapply(c(1,2,5),\(x)x*10^c(-2:5)))
  # ystep=candidates[which.min(abs(candidates-max(xy[,2],na.rm=T)/6))]
  # ystep2=candidates[which.min(abs(candidates-max(xy[,3],na.rm=T)/6))]
  # ystart=min(0,ystep*floor(min(xy[,2],na.rm=T)/ystep))
  # yend=ystep*ceiling(max(xy[,2],na.rm=T)/ystep)
  # yend2=ystep2*ceiling(max(xy[,3],na.rm=T)/ystep2)
  ystart=-20;yend=120;yend2=50;ystep=20;ystep2=10

  secmult=yend/yend2
  seccolor=hcl(135,70,50)

  ggplot(xy,aes(x=date,y=excess))+
  geom_hline(yintercept=c(ystart,0,yend),color="gray75",linewidth=.3,lineend="square")+
  geom_vline(xintercept=c(xstart,xend),color="gray75",linewidth=.3,lineend="square")+
  geom_line(linewidth=.3)+
  geom_line(aes(y=secmult*pcrrate),linewidth=.3,color=seccolor)+
  coord_cartesian(xlim=c(xstart,xend),ylim=c(ystart,yend),clip="off")+
  scale_x_date(breaks=seq(xstart,xend,"2 months"),expand=expansion(0),date_labels="%b 1 %y")+
  scale_y_continuous(breaks=seq(ystart,yend,ystep),expand=expansion(0),sec.axis=sec_axis(trans=~./secmult,breaks=seq(0,yend2,ystep2),name="Percentage of positive PCR tests (21-day moving average)"))+
  labs(y="Excess mortality percent (21-day moving average)")+
  ggtitle(paste0(state," (r=",sprintf("%.2f",cor(xy[,2],xy[,3],use="complete.obs")),")"))+
  theme(
    axis.text=element_text(size=6,color="black"),
    axis.text.x=element_text(angle=90,vjust=.5,hjust=1),
    axis.ticks=element_line(linewidth=.3,color="gray75"),
    axis.ticks.length=unit(.2,"lines"),
    axis.title=element_text(size=7.5),
    axis.title.y.right=element_text(color=seccolor,margin=margin(0,0,0,5)),
    axis.text.y.right=element_text(color=seccolor),
    axis.title.x=element_blank(),
    panel.background=element_rect(fill="white"),
    panel.grid=element_blank(),
    plot.subtitle=element_text(size=7),
    plot.title=element_text(size=9)
  )

  ggsave(paste0(state,".png"),width=5,height=3.5)
}
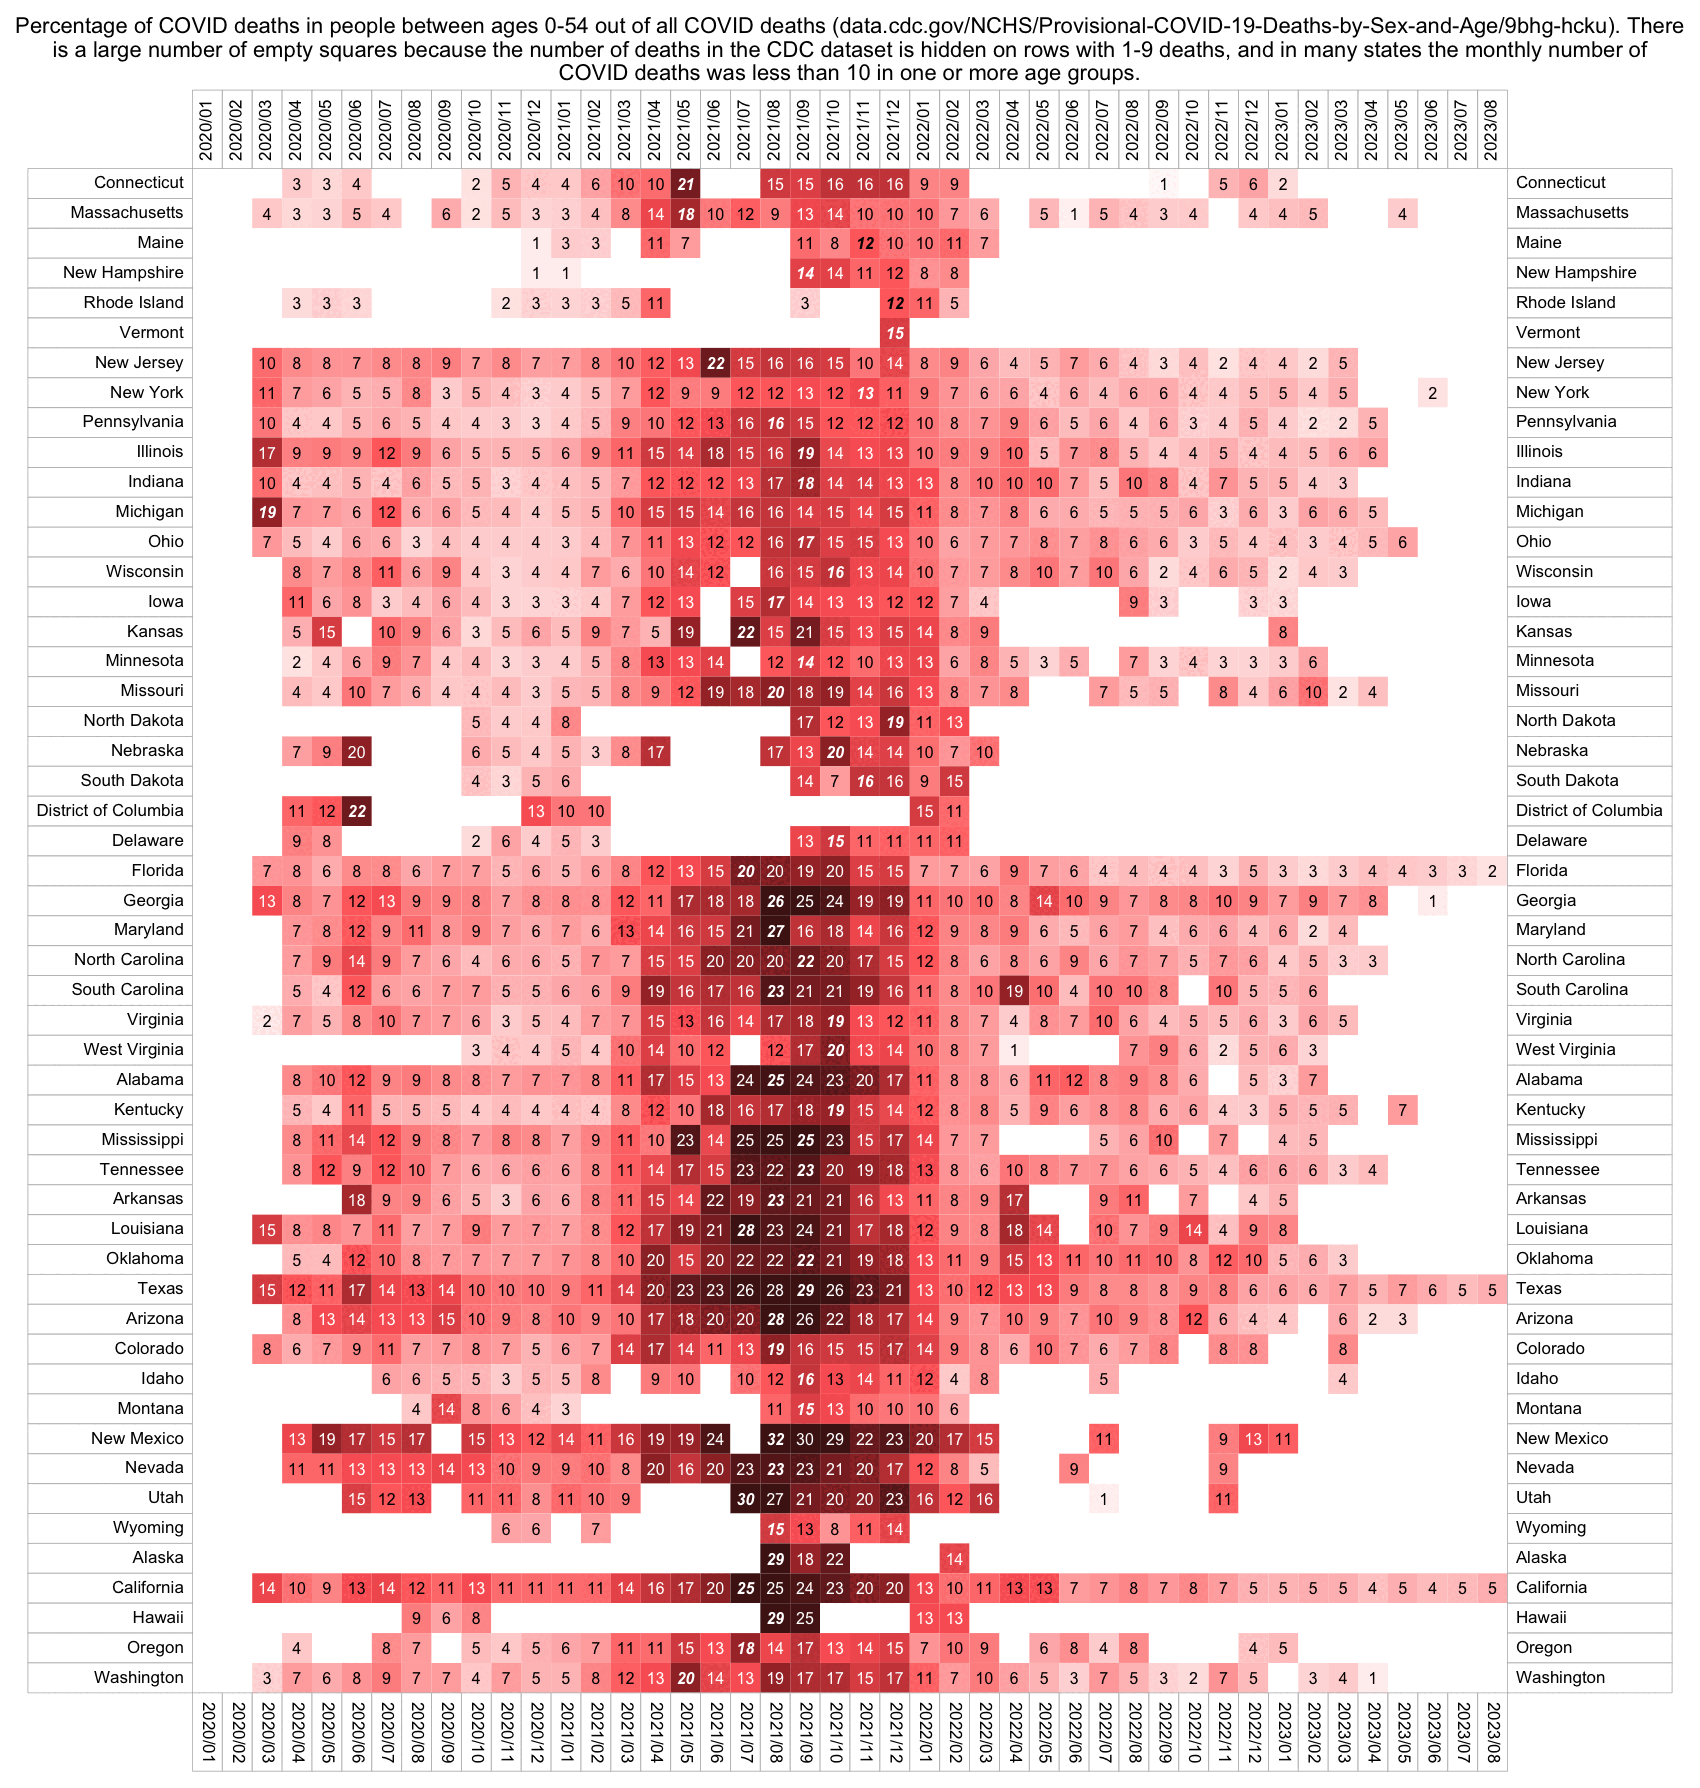
CDC dataset: https://data.cdc.gov/NCHS/Provisional-COVID-19-Deaths-by-Sex-and-Age/9bhg-hcku.
# install.packages("BiocManager")
# BiocManager::install("ComplexHeatmap")
# install.packages("circlize"
# install.packages("colorspace")
library(ComplexHeatmap)
library(circlize) # for colorRamp2
library(colorspace)

# download.file("https://data.cdc.gov/api/views/9bhg-hcku/rows.csv?accessType=DOWNLOAD","Provisional_COVID-19_Deaths_by_Sex_and_Age.csv")

t=read.csv("d/cd/Provisional_COVID-19_Deaths_by_Sex_and_Age.csv")

t2=t[t$Group=="By Month"&t$Sex=="All Sexes",]

age1=t2[t2$Age.Group%in%c("All Ages"),]
age2=t2[t2$Age.Group%in%c("55-64 years","65-74 years","75-84 years","85 years and over"),]
ag1=aggregate(age1$COVID.19.Deaths,list(paste0(age1$Year,"/",sprintf("%02d",age1$Month)),age1$State),sum)
ag2=aggregate(age2$COVID.19.Deaths,list(paste0(age2$Year,"/",sprintf("%02d",age2$Month)),age2$State),sum)
m=wide(cbind(ag1[,-3],100*(1-ag2[,3]/ag1[,3])))|t

disp=ifelse(is.na(m),"",round(m))

rowmax=t(apply(m,1,\(x)x==max(x,na.rm=T)))
rowmax[is.na(rowmax)]=F

png("1.png",w=ncol(m)*30+1000,h=nrow(m)*30+1000,res=72)

ht_opt$COLUMN_ANNO_PADDING=unit(0,"mm")
ht_opt$ROW_ANNO_PADDING=unit(0,"mm")

maxcolor=.8*max(m,na.rm=T)

Heatmap(
  m,
  show_heatmap_legend=F,
  show_column_names=F,
  show_row_names=F,
  width=unit(ncol(m)*30,"pt"),
  height=unit(nrow(m)*30,"pt"),
  row_dend_width=unit(200,"pt"),
  cluster_columns=F,
  cluster_rows=F,
  na_col="white",
  column_title=stringr::str_wrap("Percentage of COVID deaths in people between ages 0-54 out of all COVID deaths (data.cdc.gov/NCHS/Provisional-COVID-19-Deaths-by-Sex-and-Age/9bhg-hcku). There is a large number of empty squares because the number of deaths in the CDC dataset is hidden on rows with 1-9 deaths, and in many states the monthly number of COVID deaths was less than 10 in one or more age groups.",160),
  column_title_gp=gpar(fontsize=22),
  rect_gp=gpar(col="gray80",lwd=0),
  top_annotation=columnAnnotation(text=anno_text(gt_render(colnames(m),padding=unit(c(3,3,3,3),"mm")),just="left",rot=90,location=unit(0,"npc"),gp=gpar(fontsize=17,border="gray70",lwd=1))),
  bottom_annotation=columnAnnotation(text=anno_text(gt_render(colnames(m),padding=unit(c(3,3,3,3),"mm")),just="left",rot=270,gp=gpar(fontsize=17,border="gray70",lwd=1))),
  left_annotation=rowAnnotation(text=anno_text(gt_render(rownames(m),padding=unit(c(3,3,3,3),"mm")),just="right",location=unit(1,"npc"),gp=gpar(fontsize=17,border="gray70",lwd=1))),
  right_annotation=rowAnnotation(text=anno_text(gt_render(rownames(m),padding=unit(c(3,3,3,3),"mm")),just="left",location=unit(0,"npc"),gp=gpar(fontsize=17,border="gray70",lwd=1))),
  col=colorRamp2(seq(-maxcolor,maxcolor,,9),hex(HSV(c(210,210,210,210,0,0,0,0,0),c(.7,.7,.6,.3,0,.3,.6,.7,.7),c(.3,.65,1,1,1,1,1,.65,.3)))),
  cell_fun=\(j,i,x,y,w,h,fill)grid.text(disp[i,j],x,y,gp=gpar(fontface=ifelse(rowmax[i,j],4,"plain"),fontsize=16,col=ifelse(abs(m[i,j])>=maxcolor*.5,"white","black")))
)

dev.off()
system("mogrify -gravity center -trim -border 16 -bordercolor white 1.png")
library(ggplot2)
library(usmap)

seg=\(x,y)min(x,na.rm=T)+y*(max(x,na.rm=T)-min(x,na.rm=T))
isoweek=\(year,week,weekday=1){d=as.Date(paste0(year,"-1-4"));d-(as.integer(format(d,"%w"))+6)%%7-1+7*(week-1)+weekday}

download.file("https://health.data.ny.gov/api/views/xdss-u53e/rows.csv?accessType=DOWNLOAD","New_York_State_Statewide_COVID-19_Testing.csv")

i=15

t=read.csv("New_York_State_Statewide_COVID-19_Testing.csv")
t=t[t$Geography=="COUNTY",]

d=as.Date(t$Test.Date,"%m/%d/%Y")
week=as.numeric(format(d,"%V"))
t=t[week==i&as.numeric(format(d,"%Y"))==2020,]

weekly=aggregate(t[,c(3,5)],list(t$County),sum)
pct=ifelse(weekly[,2]<10,NA,weekly[,2]/weekly[,3]*100)
pct[pct<5]=-10
pct[pct>60]=60
lev=as.factor(ifelse(is.na(pct),NA,10*floor(pct/10)))

d=data.frame(fips=fips("New York",t$County),values=as.factor(lev))

color=c(hcl(105,40,100),hcl(c(90,60,40,20,0,0,0)+15,c(60,70,70,80,90,100,110),c(90,90,80,70,50,30,10)))

map=us_map(include="NY")
label=c("Less than 10 tests",paste0(c(0,5,seq(10,60,10)),"% or higher"))

ystep=.045
legx=seg(map$x,.14)
legy=seg(map$y,seq(.86,,-ystep,length(label)))
legend=data.frame(x=legx,y=legy,label)
half=(max(map$y)-min(map$y))*ystep/2
rect=data.frame(xmin=legx-2.75*half,xmax=legx-.75*half,ymin=legy-half,ymax=legy+half)

plot_usmap(data=d,linewidth=.03,include="NY")+
geom_text(data=legend,aes(x=x,y=y,label=label),size=3.4,hjust=0)+
geom_rect(data=rect,aes(xmin=xmin,xmax=xmax,ymin=ymin,ymax=ymax),fill=c("gray85",color)[1:nrow(legend)],color="gray70",size=.1)+
annotate("label",x=seg(map$x,.5),y=seg(map$y,.95),label=paste0("PCR positivity rate on week ",i," of 2020 (",isoweek(2020,i)," to ",isoweek(2020,i,7),")"),hjust=.5,,fill=alpha("white",.7),label.r=unit(0,"lines"),label.padding=unit(.15,"lines"),label.size=0)+
annotate("text",x=seg(map$x,.06),y=seg(map$y,.045),label="Data: health.data.ny.gov/Health/New-York-State-Statewide-COVID-19-Testing-Archived/xdss-u53e\nR code: sars2.net/stat.html",hjust=0,size=2.1)+
scale_fill_manual(breaks=seq(-10,60,10),values=color,na.value="gray85")+
theme(
  legend.position="none",
  panel.background=element_rect(color=NA,fill="white"),
  plot.background=element_rect(color=NA,fill="white")
)

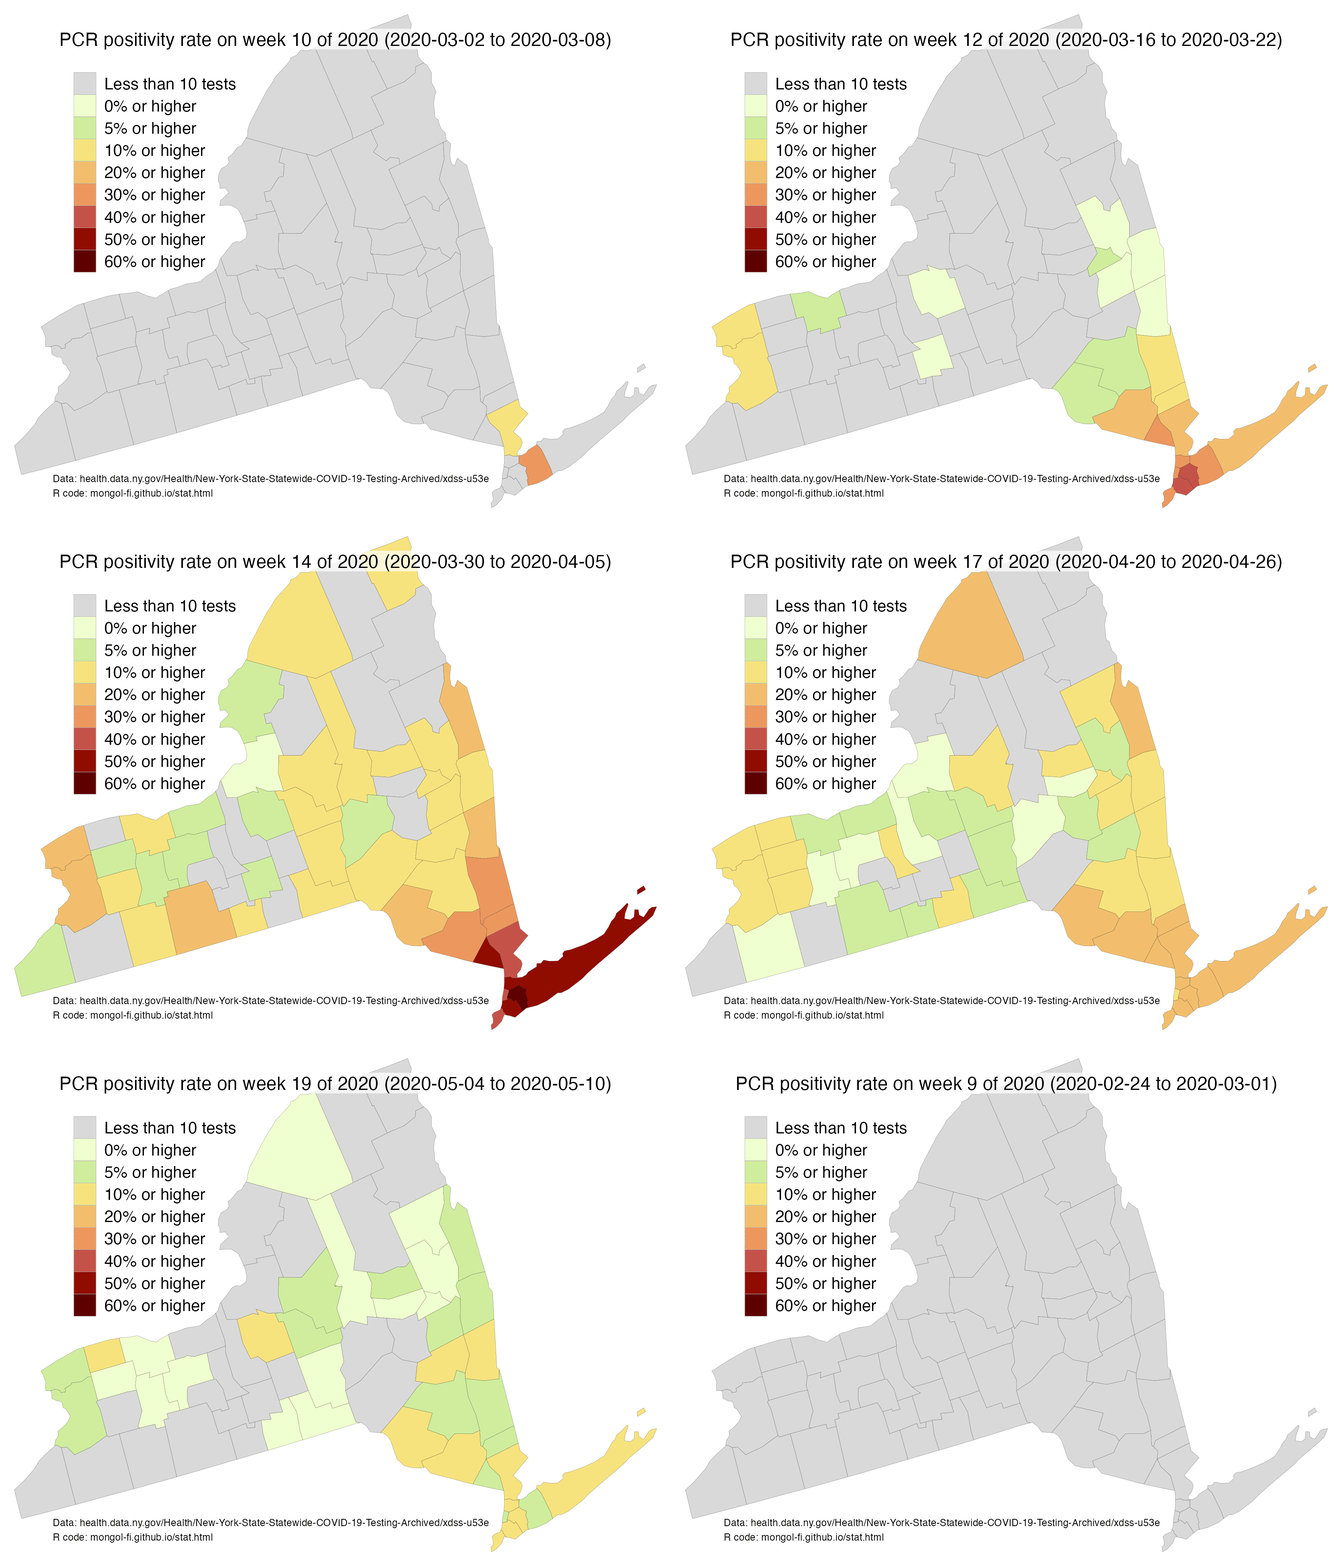
ggsave("1.png",width=6,height=6)
This script makes a table with one row for each combination of state and day and then calculates a correlation coefficient between a column for excess mortality percent and a column for the cumulative number of vaccine doses per capita. However unlike in the case of some country-level comparisons, the correlation here was close to zero regardless of whether I looked at data from 2021 or 2022 or both.
# https://data.cdc.gov/Vaccinations/COVID-19-Vaccinations-in-the-United-States-Jurisdi/unsk-b7fc
download.file("https://data.cdc.gov/api/views/unsk-b7fc/rows.csv","COVID-19_Vaccinations_in_the_United_States_Jurisdiction.csv")

# https://www.cdc.gov/nchs/nvss/vsrr/covid19/excess_deaths.htm
download.file("https://data.cdc.gov/api/views/xkkf-xrst/rows.csv","statesexcess.csv")

# https://www.census.gov/data/tables/time-series/demo/popest/2020s-state-total.html
download.file("https://www2.census.gov/programs-surveys/popest/datasets/2020-2022/state/totals/NST-EST2022-ALLDATA.csv","NST-EST2022-ALLDATA.csv")

pop=read.csv("NST-EST2022-ALLDATA.csv")
pop=setNames(pop$POPESTIMATE2021,pop$NAME)

statecode=read.csv("https://raw.githubusercontent.com/jasonong/List-of-US-States/master/states.csv",r=2)

t=read.csv("COVID-19_Vaccinations_in_the_United_States_Jurisdiction.csv")
d=na.omit(data.frame(date=as.Date(t$Date,"%m/%d/%Y"),state=statecode[t$Location,],vax=t$Distributed))

excess=read.csv("statesexcess.csv")
excess=excess[excess$Outcome=="All causes",]
d2=data.frame(date=as.Date(excess$Week.Ending.Date)-3,state=excess$State,excess=excess$Excess.Estimate/excess$Average.Expected.Count)

d3=merge(d,d2,all=T)
d3$excess=unlist(tapply(d3$excess,d3$state,zoo::na.approx,na.rm=F))
d3$vaxratio=d3$vax/pop[d3$state]

d4=na.omit(d3[d3$date>="2021-1-1"&d3$date<"2023-1-1",])
cor(d4$vaxratio,d4$excess) # 0.06404972
# install.packages("BiocManager")
# BiocManager::install("ComplexHeatmap")
# install.packages("circlize"
# install.packages("colorspace")

library(ComplexHeatmap)
library(colorspace)
library(circlize)

# download.file("https://github.com/nytimes/covid-19-data/raw/master/us-counties-2020.csv","us-counties-2020.csv")
# download.file("https://www2.census.gov/programs-surveys/popest/datasets/2020-2022/counties/totals/co-est2022-alldata.csv","co-est2022-alldata.csv")

t=read.csv("us-counties-2020.csv")

pop=read.csv("co-est2022-alldata.csv")
pops=setNames(pop[,9],paste0(pop[,4],sprintf("%03d",pop[,5])))
t$fips[t$county=="New York City"]=0
pops["0"]=8773e3
t$pop=pops[as.character(t$fips)]

name=t[!duplicated(t$fips),]
name=setNames(paste0(name$county,", ",name$state),name$fips)

poplim=5e4
t=t[t$pop>=poplim,]
t=na.omit(t)
t=t[t$deaths!=0,]

t=t[order(t$fips),]
t$uncum=unlist(tapply(t$deaths,t$fips,\(x)diff(c(0,x))))
t$week=format(as.Date(t$date),"%Y_%V")

m=tapply(t$uncum/t$pop*1e5,list(t$fips,t$week),sum)
m=m[order(-rowSums(m,na.rm=T)),]
m=head(m,50)
m[is.na(m)]=0
m=m[,colSums(m)>0]

m=m[,-ncol(m)]

week=isoweek(as.numeric(sub("_.*","",colnames(m))),as.numeric(sub(".*_","",colnames(m))),7)
colnames(m)=format(week,"%b %d (%V)")
rownames(m)=paste0(name[rownames(m)]," (pop. ",round(pops[rownames(m)]/1e3),"k)")

disp=round(m)

rowmax=t(apply(m,1,\(x)x==max(x,na.rm=T)))
rowmax[is.na(rowmax)]=F

png("1.png",w=ncol(m)*30+1000,h=nrow(m)*30+1000,res=72)

ht_opt$COLUMN_ANNO_PADDING=unit(0,"mm")
ht_opt$ROW_ANNO_PADDING=unit(0,"mm")

maxcolor=max(m,na.rm=T)

Heatmap(
  m,
  show_heatmap_legend=F,
  show_column_names=F,
  show_row_names=F,
  width=unit(ncol(m)*30,"pt"),
  height=unit(nrow(m)*30,"pt"),
  cluster_columns=F,
  cluster_rows=F,
  column_title=stringr::str_wrap(paste0("Weekly COVID deaths per 100,000 in 2020 in US counties with population above ",prettyNum(poplim,","),". Sorted by total COVID deaths per capita in 2020. 50 counties with highest total COVID deaths per capita shown. R code: sars2.net/stat.html. Source: github.com/nytimes/covid-19-data/blob/master/us-counties-2020.csv. New York City is treated as a single county in the NYT dataset."),150),
  column_title_gp=gpar(fontsize=22),
  rect_gp=gpar(col="gray80",lwd=0),
  top_annotation=columnAnnotation(text=anno_text(gt_render(colnames(m),padding=unit(c(3,3,3,3),"mm")),just="left",rot=90,location=unit(0,"npc"),gp=gpar(fontsize=17,border="gray70",lwd=1))),
  bottom_annotation=columnAnnotation(text=anno_text(gt_render(colnames(m),padding=unit(c(3,3,3,3),"mm")),just="left",rot=270,gp=gpar(fontsize=17,border="gray70",lwd=1))),
  left_annotation=rowAnnotation(text=anno_text(gt_render(rownames(m),padding=unit(c(3,3,3,3),"mm")),just="right",location=unit(1,"npc"),gp=gpar(fontsize=17,border="gray70",lwd=1))),
  right_annotation=rowAnnotation(text=anno_text(gt_render(rownames(m),padding=unit(c(3,3,3,3),"mm")),just="left",location=unit(0,"npc"),gp=gpar(fontsize=17,border="gray70",lwd=1))),
  col=colorRamp2(seq(0,maxcolor,,16),hex(HSV(c(210,210,210,210,150,100,60,45,30,15,0,0,0,0,0,0),c(0,.166,.333,rep(.5,9),.7,.9,1,1),c(rep(1,12),.75,.5,.25,0)))),
  cell_fun=\(j,i,x,y,w,h,fill)grid.text(disp[i,j],x,y,gp=gpar(fontface=ifelse(rowmax[i,j],4,"plain"),fontsize=16,col=ifelse(abs(m[i,j])>=maxcolor*.5,"white","black")))
)

dev.off()
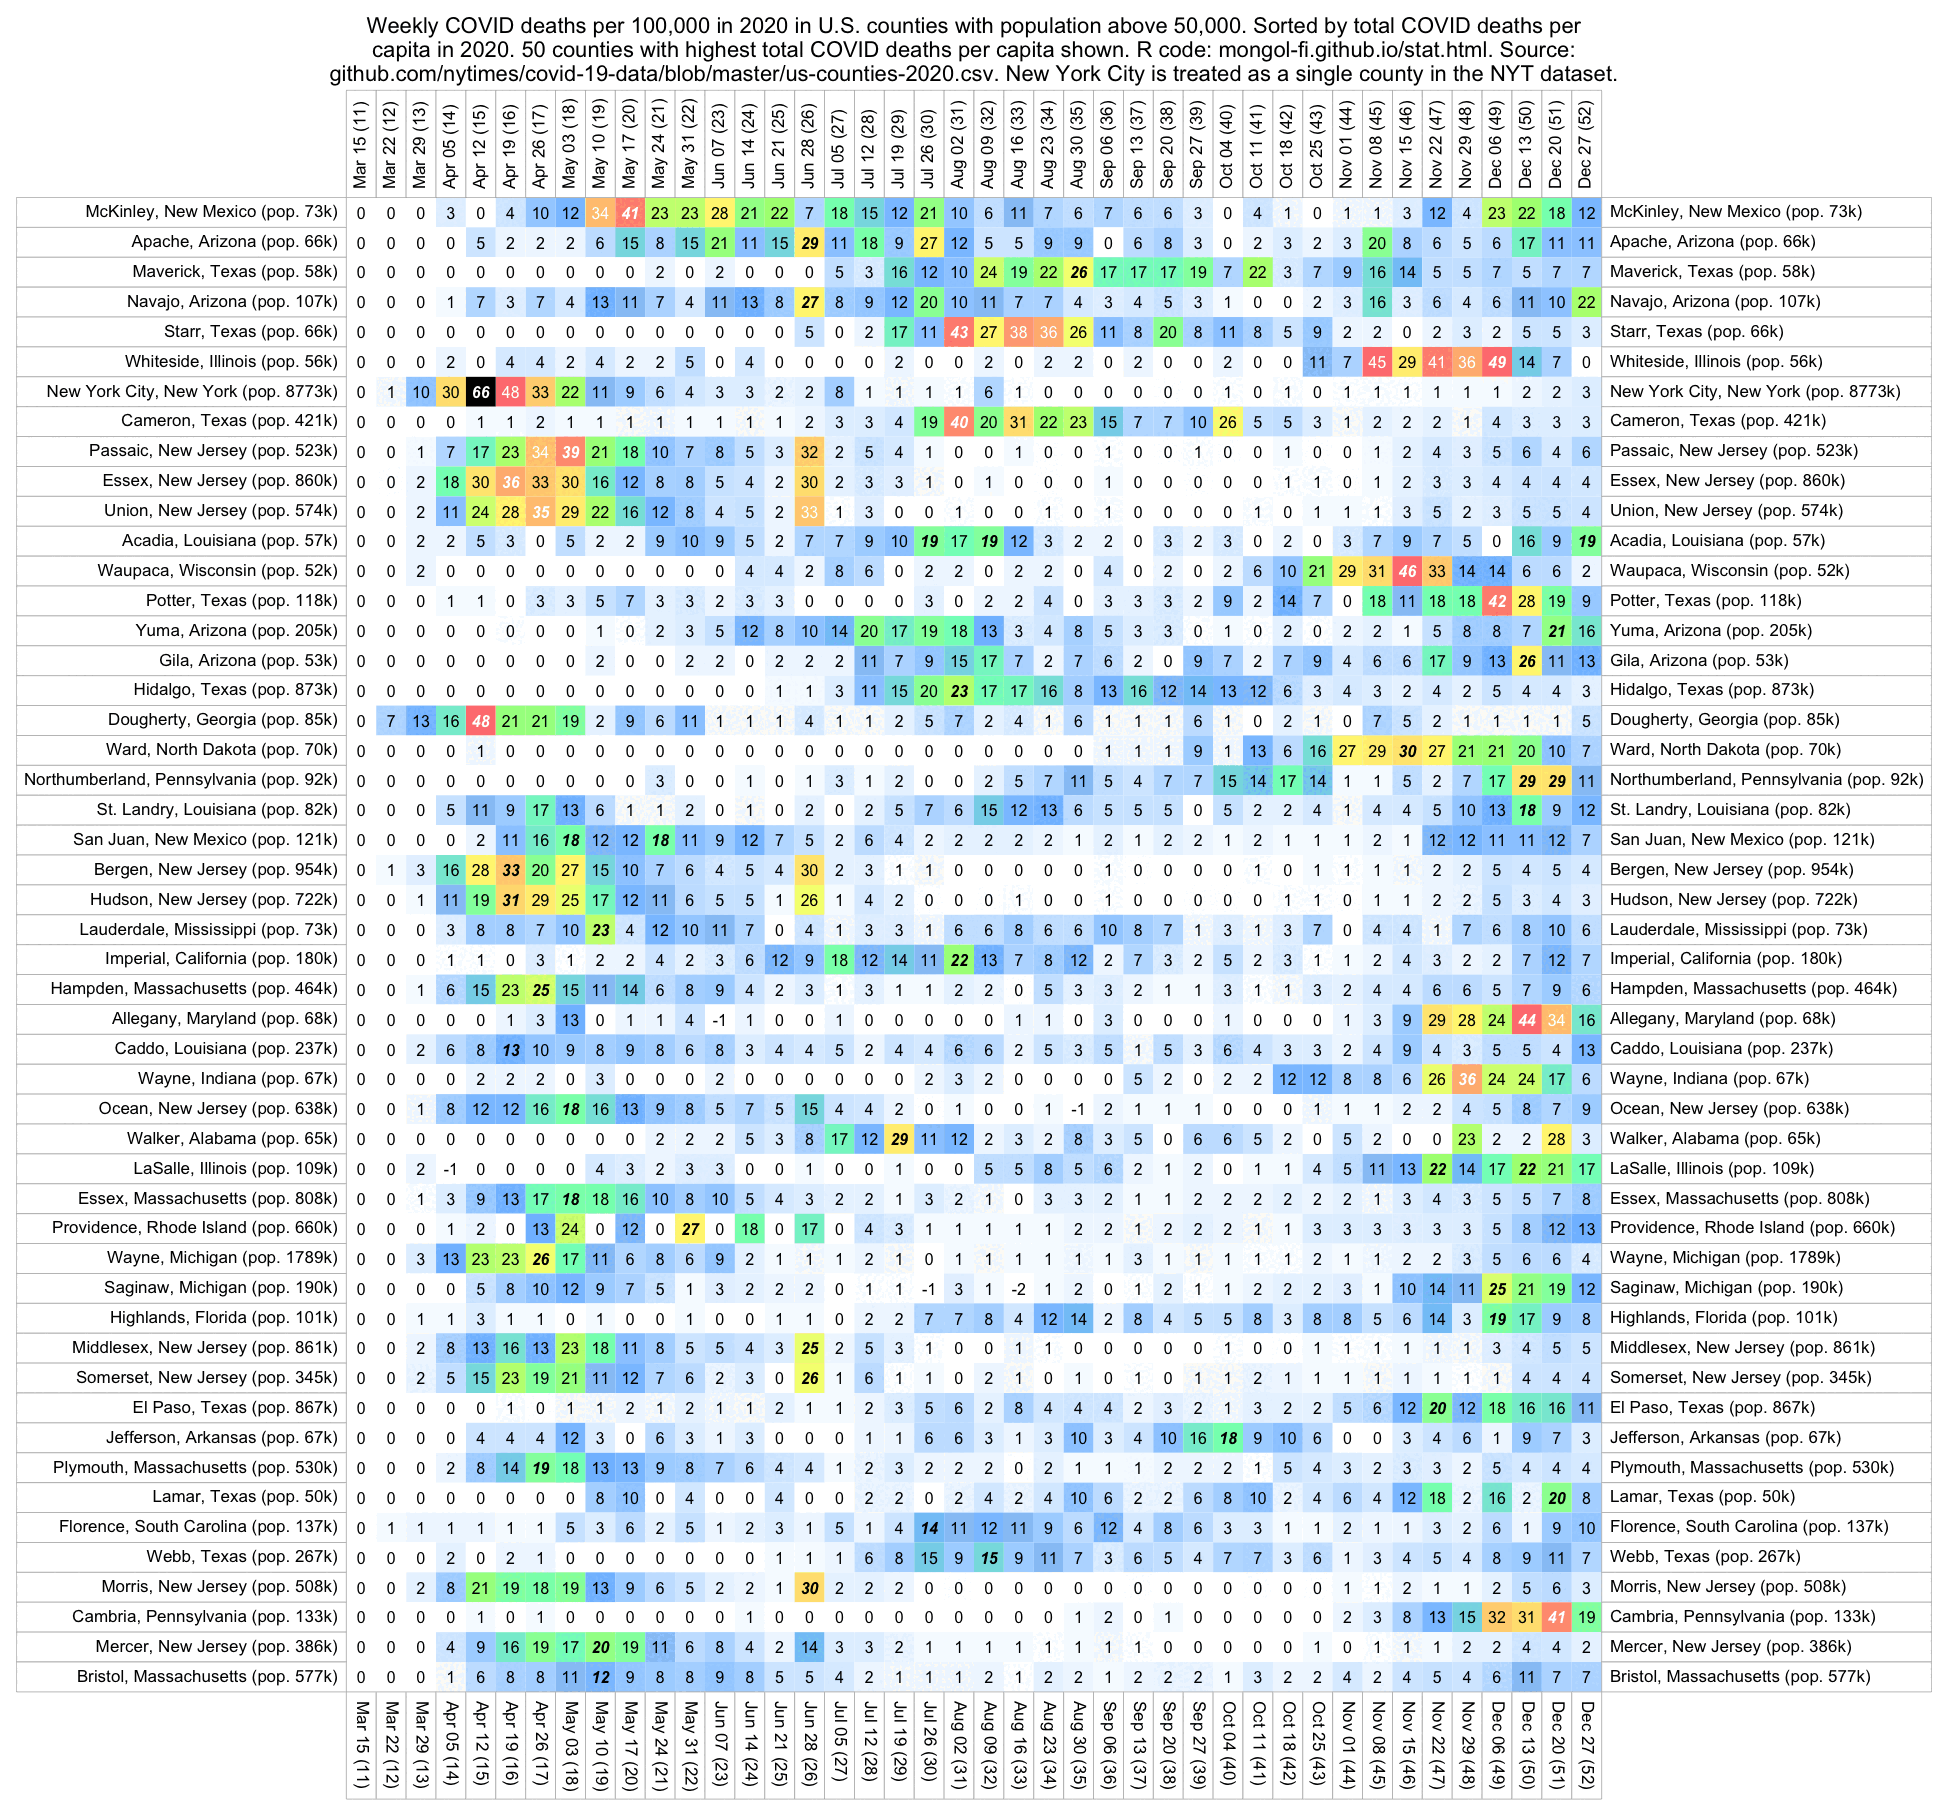
system("mogrify -gravity center -trim -border 16 -bordercolor white 1.png")
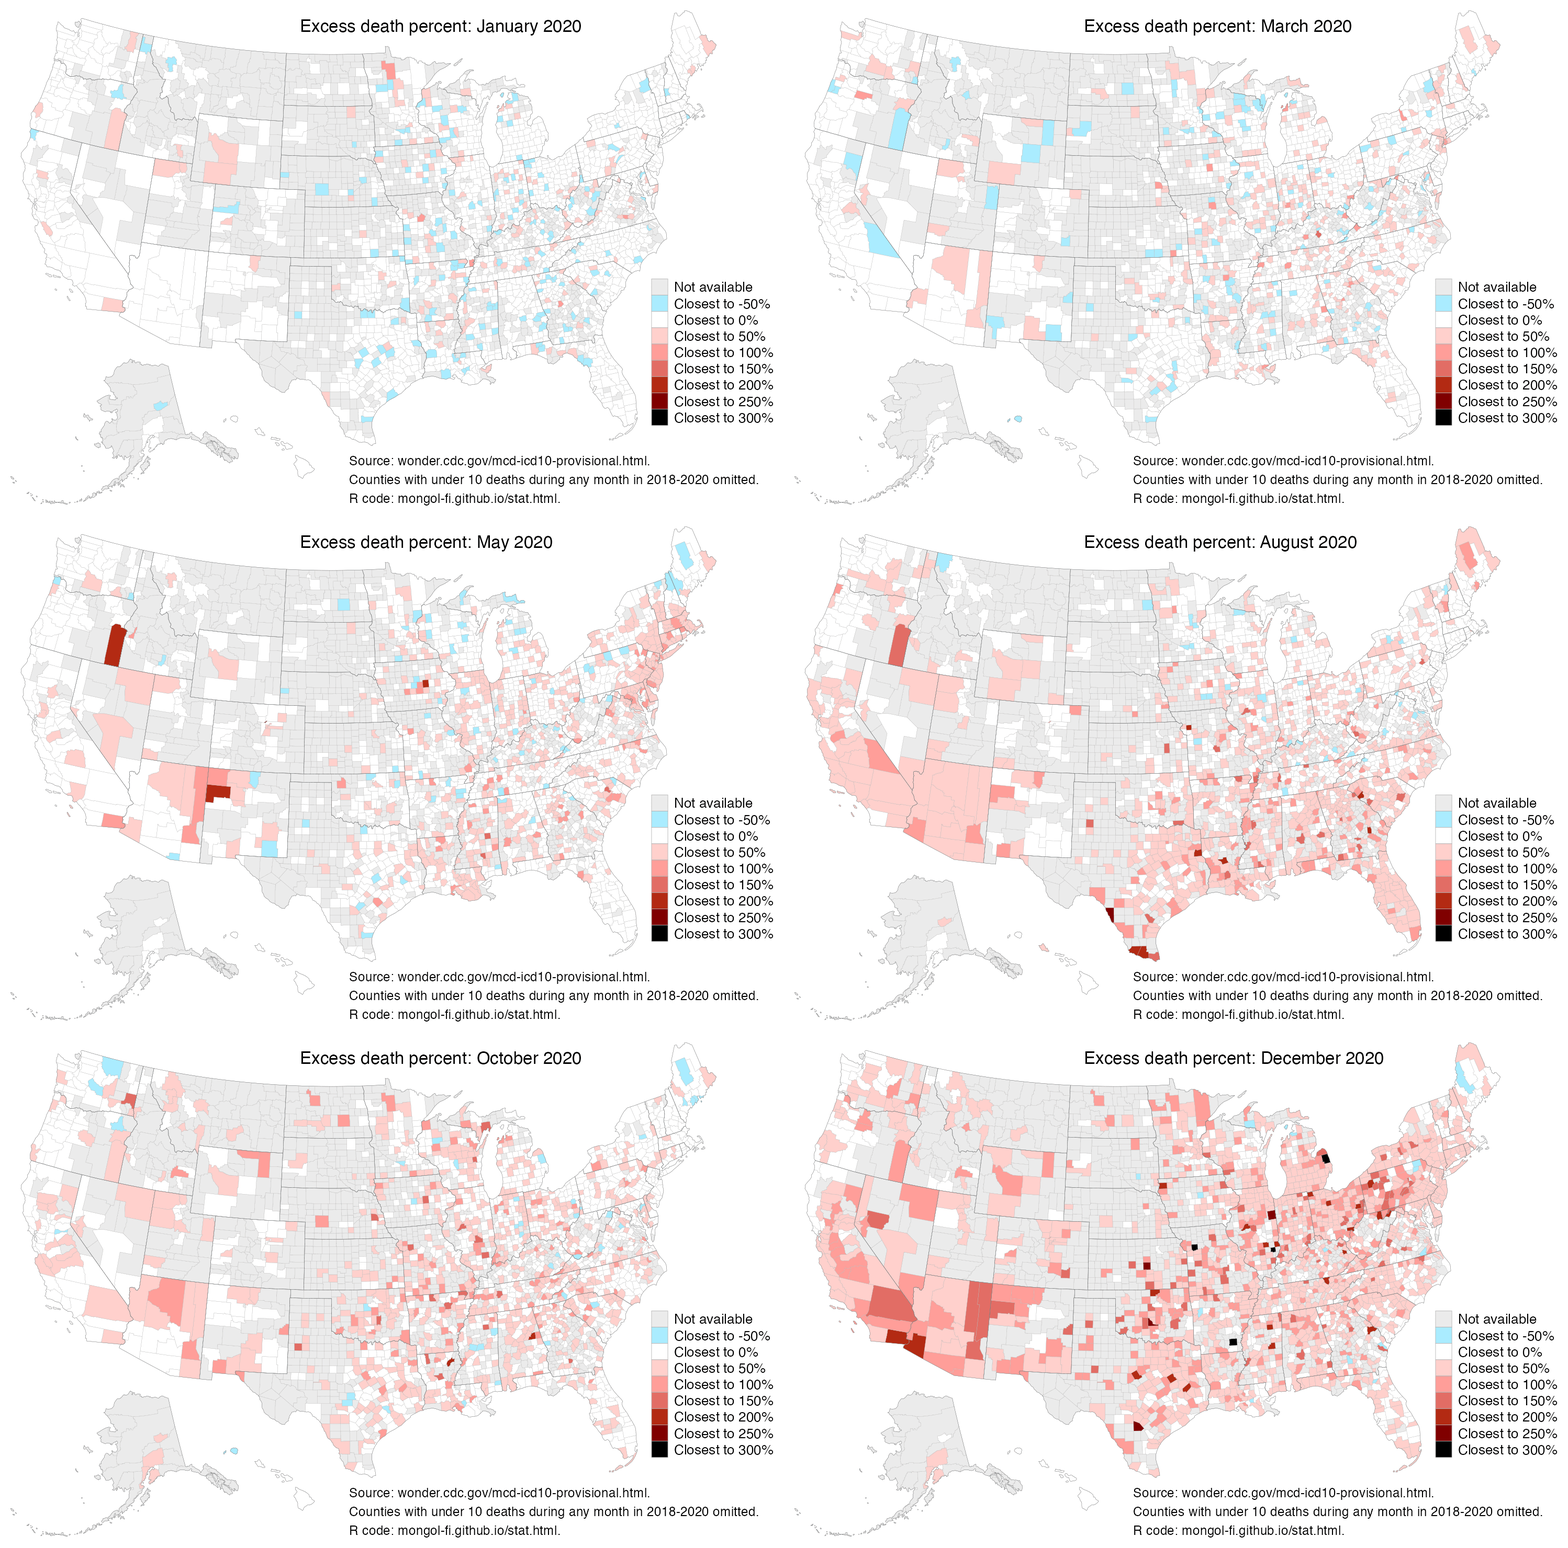
You can download the all-cause mortality data from CDC WONDER: https://wonder.cdc.gov/mcd-icd10-provisional.html. Click the "I Agree" button, in section 1 set "Group Results By" to "Residence County" and set "And By" to "Month". In section 2, select the first 30 states from the list of residence states, because otherwise there's an error that the number of rows returned is too high. In section 8, check "Export Results", increase the timeout to 15 minutes, and click "Send". And then repeat the procedure for the rest of the states. CDC WONDER omits the number of deaths for counties with less than 10 deaths during a month.
library(ggplot2)
library(usmap)

t=do.call(rbind,Sys.glob("Provisional Mortality Statistics*")|>lapply(\(x){t=readLines(x);t=paste(t[1:(which(t=="\"---\"")[1]-1)],collapse="\n");read.table(sep="\t",text=t,header=T)}))

t$fips=t$Residence.County.Code
t$date=as.Date(paste0(t$Month.Code,"/1"),"%Y/%m/%d")
t$prediction=t$date<as.Date("2020-1-1")
t=t[t$date<=as.Date("2020-12-1"),]

ta=table(t$fips)
t=t[t$fips%in%names(ta[ta==max(ta)]),]

t$model=split(t,factor(t$fips,unique(t$fips)))|>lapply(\(x){model=predict(lm(Deaths~date,x[x$prediction,]),x);month=substring(x$date,6,7);model+tapply((x$Deaths-model)[x$prediction],month[x$prediction],mean)[month]})|>unlist()
t$excess=100*(t$Deaths-t$model)/t$model

## for(date in seq(as.Date("2020-1-1"),as.Date("2020-12-1"),"1 month")){
date=as.Date("2020-4-1")
t2=t[t$date==date,]

brk=seq(-50,300,50)
d=data.frame(fips=t2$fips,values=factor(brk[sapply(t2$excess,\(x)which.min(abs(x-brk)))],brk))

color=c(hcl(225,45,90),"white",hcl(15,c(50,70,90,110,130,0),c(90,75,60,40,20,0)))
nacol="gray92"

seg=\(x,y)min(x,na.rm=T)+y*(max(x,na.rm=T)-min(x,na.rm=T))

map=us_map()
label=c("Not available",paste0("Closest to ",brk,"%"))
ystep=.033
legx=seg(map$x,.94)
legy=seg(map$y,seq(.44,,-ystep,length(label)))
legend=data.frame(x=legx,y=legy,label)
half=(max(map$y)-min(map$y))*ystep/2
rect=data.frame(xmin=legx-2.75*half,xmax=legx-.75*half,ymin=legy-half,ymax=legy+half)

plot_usmap(data=d,linewidth=.04,color="gray70")+
geom_text(data=legend,aes(x=x,y=y,label=label),size=2.2,hjust=0)+
geom_rect(data=rect,aes(xmin=xmin,xmax=xmax,ymin=ymin,ymax=ymax),fill=c(nacol,color)[1:nrow(legend)],color="gray70",linewidth=.1)+
annotate("text",x=seg(map$x,.39),y=seg(map$y,.96),label=paste0("Excess death percent: ",format(as.Date(date),"%B %Y")),hjust=0,size=2.8)+
annotate("text",x=seg(map$x,.45),y=seg(map$y,.05),label="Source: wonder.cdc.gov/mcd-icd10-provisional.html. Counties with less than\n10 deaths during any month in 2018-2020 omitted.",hjust=0,size=2.1)+
geom_polygon(data=usmapdata::us_map(regions="states"),aes(x,y,group=group),fill=NA,linewidth=.05,color="gray45")+
scale_x_continuous(expand=expansion(c(.0,.3)))+
scale_fill_manual(breaks=brk,values=color,na.value=nacol)+
theme(
  legend.position="none",
  panel.background=element_rect(color=NA,fill="white"),
  plot.background=element_rect(color=NA,fill="white")
)

## f=paste0(date,".png")
f="1.png"
ggsave(f,width=6,height=6)
system(paste("mogrify -gravity center -trim -border 16 -bordercolor white",f))
## }

## system("for x in *.png;do convert $x ${x%png}bmp;done;convert -fuzz 1% -layers optimize -delay 100 *.bmp a.gif;qlmanage -p a.gif")
# install.packages("BiocManager")
# BiocManager::install("ComplexHeatmap")
# install.packages("circlize"
# install.packages("colorspace")
library(ComplexHeatmap)
library(circlize) # for colorRamp2
library(colorspace)

# https://healthdata.gov/dataset/COVID-19-Diagnostic-Laboratory-Testing-PCR-Testing/j8mb-icvb/about_data
download.file("https://healthdata.gov/api/views/j8mb-icvb/rows.csv","statespcr.csv") # https://healthdata.gov/dataset/COVID-19-Diagnostic-Laboratory-Testing-PCR-Testing/j8mb-icvb

t=read.csv("statespcr.csv")
pos=t[t$overall_outcome=="Positive",]
ag1=aggregate(t$new_results_reported,list(state=t$state_name,month=substr(t$date,1,7)),sum)
ag2=aggregate(pos$new_results_reported,list(state=pos$state_name,month=substr(pos$date,1,7)),sum)

me=merge(ag1,ag2,by=c(1,2),all=T)
me[3][me[3]<10]=NA
me$pct=100*me[,4]/me[,3]
me$pct[me$pct>50]=NA
wide=\(x,row=1,col=2,val=3,default=NA){c1=as.character(x[,row]);c2=as.character(x[,col]);u1=unique(c1);u2=unique(c2);o=matrix(default,length(u1),length(u2),,list(u1,u2));o[cbind(c1,c2)]=x[,val];o}
m=wide(me,1,2,5)

disp=round(m)
m=m^.8

rowmax=t(apply(m,1,\(x)x==max(x,na.rm=T)))
rowmax[is.na(rowmax)]=F

png("1.png",w=ncol(m)*30+1000,h=nrow(m)*30+1000,res=72)

ht_opt$COLUMN_ANNO_PADDING=unit(0,"mm")
ht_opt$ROW_ANNO_PADDING=unit(0,"mm")

maxcolor=max(m,na.rm=T)

m2=replace(m,is.na(m),0)
hc=as.hclust(reorder(as.dendrogram(hclust(dist(m2))),prcomp(m2)$x[,1]))

Heatmap(
  m,
  show_heatmap_legend=F,
  show_column_names=F,
  show_row_names=F,
  width=unit(ncol(m)*30,"pt"),
  height=unit(nrow(m)*30,"pt"),
  cluster_columns=F,
  cluster_rows=hc,
  row_dend_width=unit(200,"pt"),
  column_title=stringr::str_wrap(paste0("PCR positivity rate by state, CDC dataset \"COVID-19 Diagnostic Laboratory Testing (PCR Testing) Time Series\". Months with less than 10 tests omitted. Months with over 50% positivity are omitted, because in 2023 some states some states only began to report positive results, or limited testing produced very high positivity rates that are not indicative of the actual prevalence of COVID."),190),
  column_title_gp=gpar(fontsize=22),
  rect_gp=gpar(col="gray80",lwd=0),
  top_annotation=columnAnnotation(text=anno_text(gt_render(colnames(m),padding=unit(c(3,3,3,3),"mm")),just="left",rot=90,location=unit(0,"npc"),gp=gpar(fontsize=17,border="gray70",lwd=1))),
  bottom_annotation=columnAnnotation(text=anno_text(gt_render(colnames(m),padding=unit(c(3,3,3,3),"mm")),just="left",rot=270,gp=gpar(fontsize=17,border="gray70",lwd=1))),
  left_annotation=rowAnnotation(text=anno_text(gt_render(rownames(m),padding=unit(c(3,3,3,3),"mm")),just="right",location=unit(1,"npc"),gp=gpar(fontsize=17,border="gray70",lwd=1))),
  right_annotation=rowAnnotation(text=anno_text(gt_render(rownames(m),padding=unit(c(3,3,3,3),"mm")),just="left",location=unit(0,"npc"),gp=gpar(fontsize=17,border="gray70",lwd=1))),
  col=colorRamp2(seq(0,maxcolor,,16),hex(HSV(c(210,210,210,210,150,100,60,45,30,15,0,0,0,0,0,0),c(0,.166,.333,rep(.5,9),.7,.9,1,1),c(rep(1,12),.75,.5,.25,0)))),
  cell_fun=\(j,i,x,y,w,h,fill)grid.text(disp[i,j],x,y,gp=gpar(fontface=ifelse(rowmax[i,j],4,"plain"),fontsize=16,col=ifelse(abs(m[i,j])>=maxcolor*.75,"white","black")))
)

dev.off()
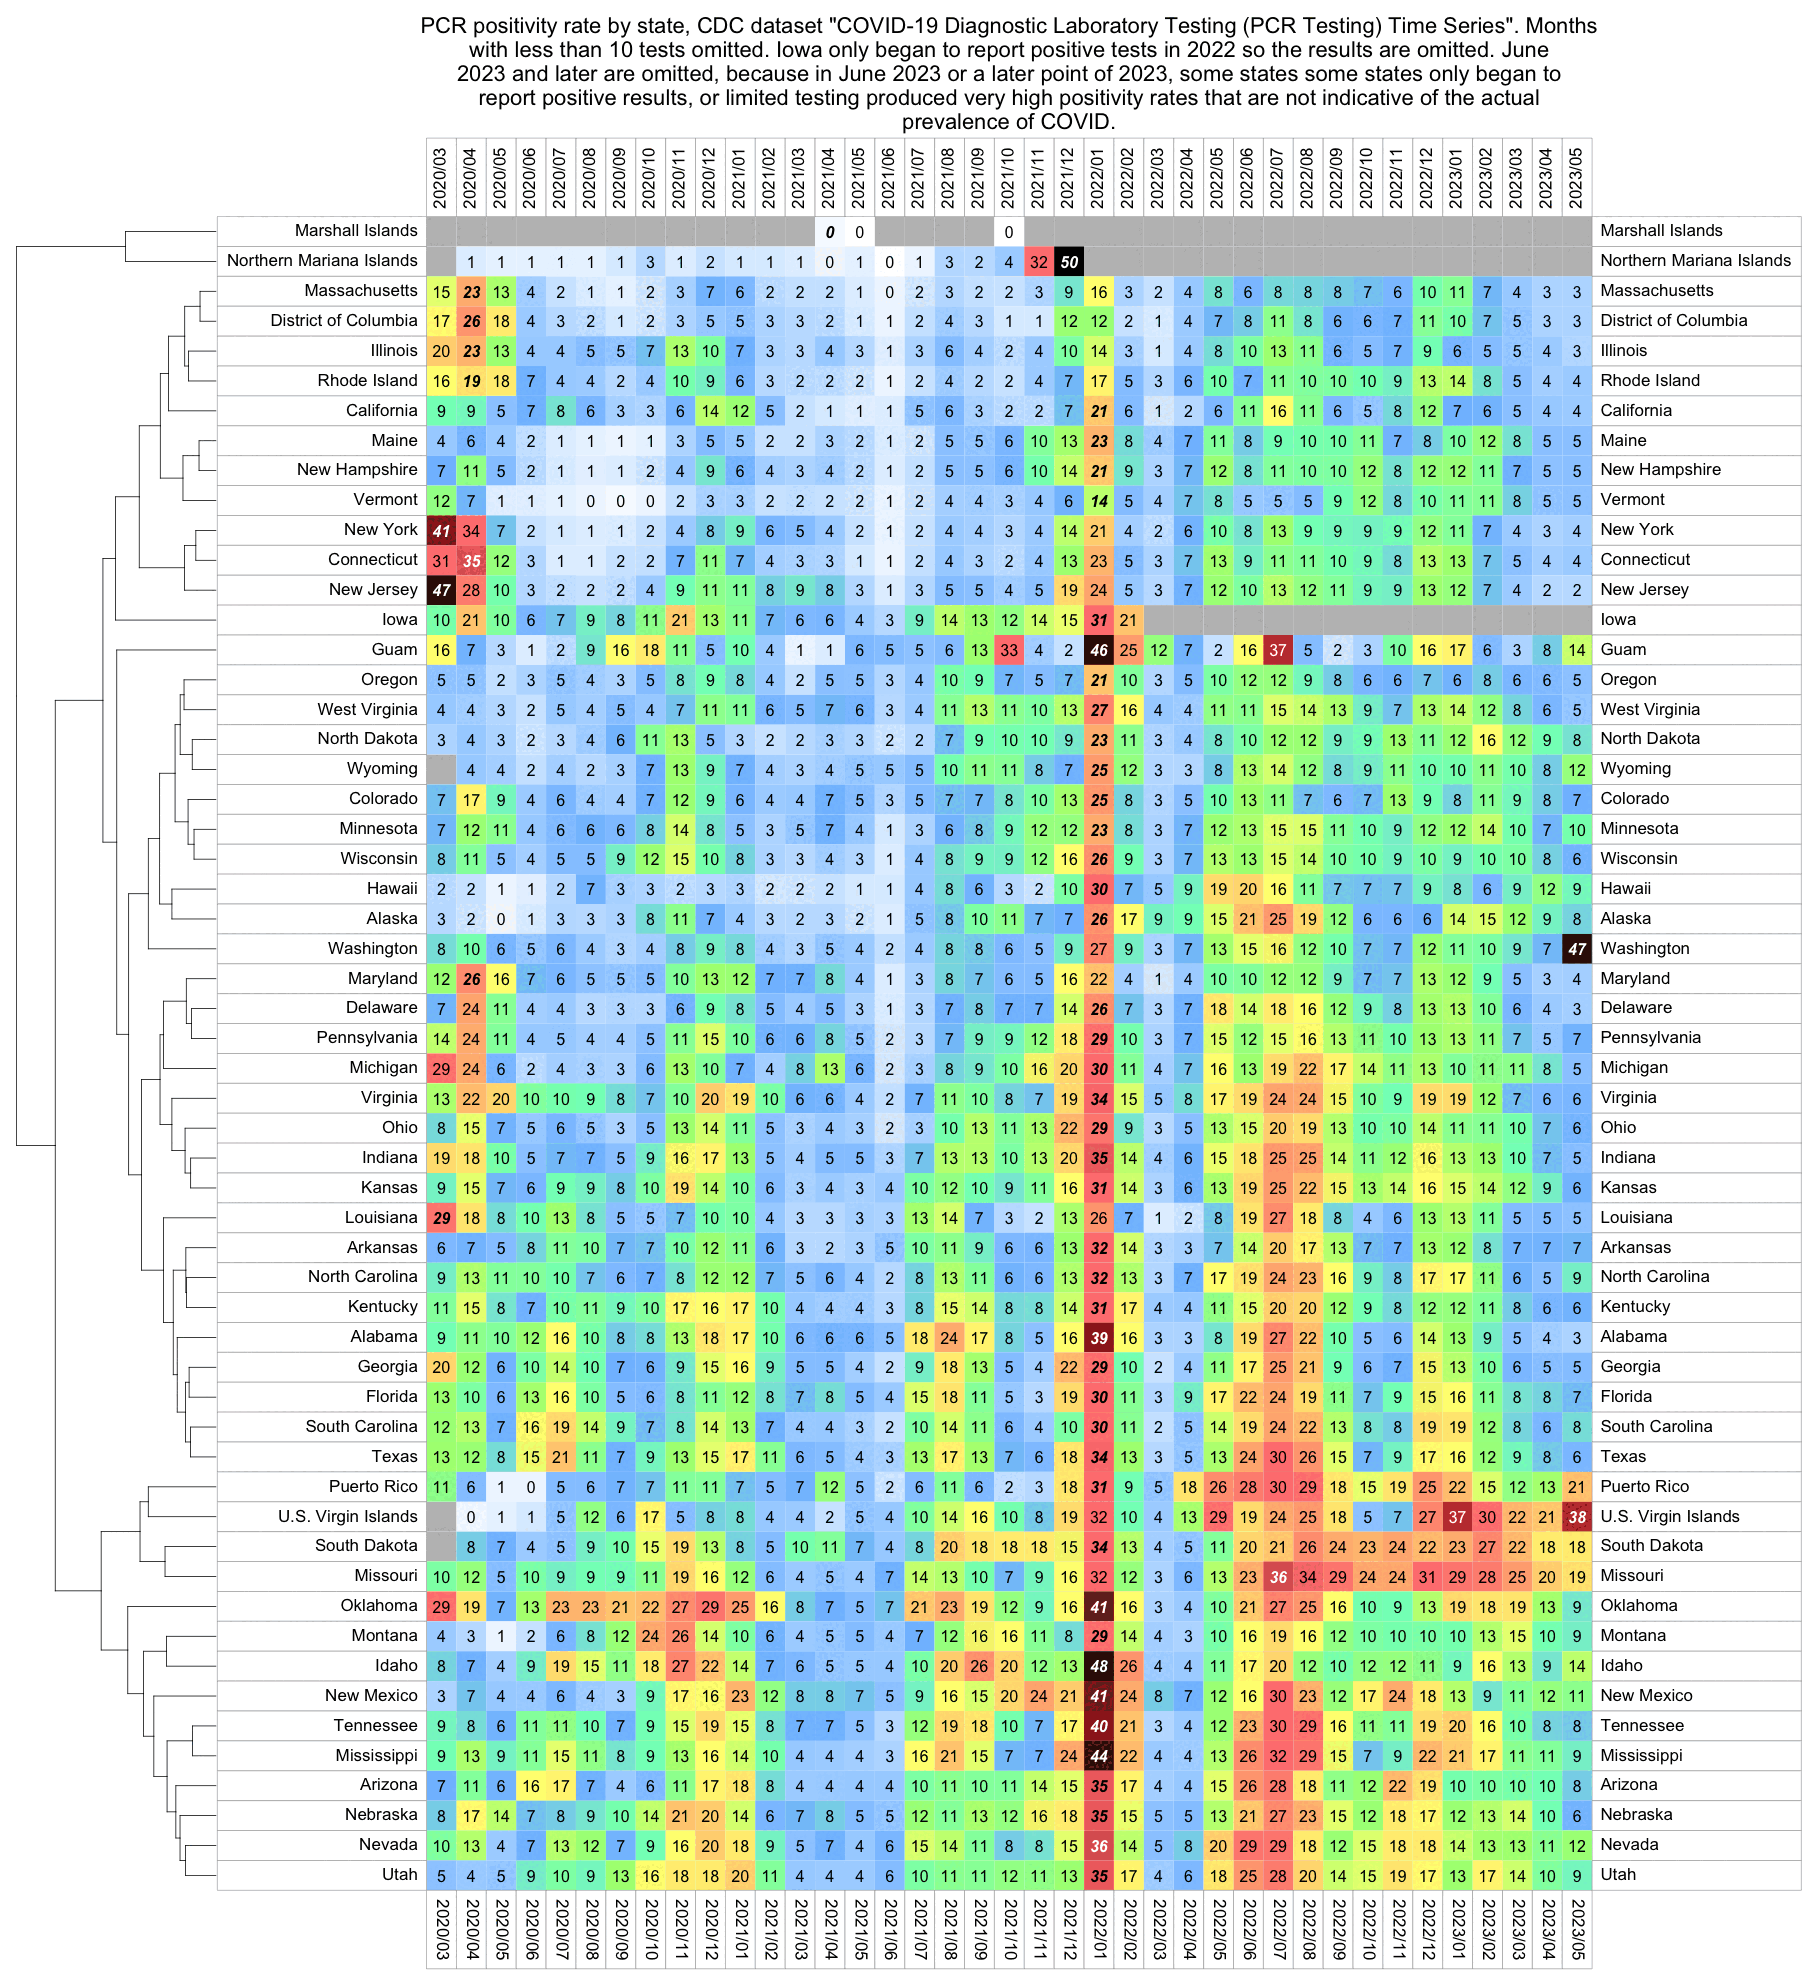
system("mogrify -gravity center -trim -border 16 -bordercolor white 1.png")
Download data from: https://data.cdc.gov/Vaccinations/COVID-19-Vaccination-Age-and-Sex-Trends-in-the-Uni/5i5k-6cmh.
# install.packages("BiocManager")
# BiocManager::install("ComplexHeatmap")
# install.packages("circlize"
# install.packages("colorspace")

library(ComplexHeatmap)
library(colorspace)
library(circlize)

vax=data.table::fread("COVID-19_Vaccination_Age_and_Sex_Trends_in_the_United_States__National_and_Jurisdictional_20240131.csv")
vax=vax[Demographic_Category%in%c("Female_Ages_18-24_yrs","Female_Ages_25-49_yrs")]

dim=list(date=sub("(..)/../(....).*","\\2-\\1",vax$Date),state=vax$Location)
ag=aggregate(list(vax=vax$Administered_Dose1,pop=vax$census),dim,sum)

m=tapply(ag$vax/ag$pop*100,ag[,2:1],c)
states=read.csv("https://github.com/cphalpert/census-regions/raw/master/us%20census%20bureau%20regions%20and%20divisions.csv")
states=rbind(states,data.frame(State=c("United States","District of Columbia","American Samoa","Guam","Northern Mariana Islands","Puerto Rico","Virgin Islands","FS of Micronesia","Marshall Islands","Palau"),State.Code=c("US","DC","AS","GU","MP","PR","VI","FM","MH","PW"),Region=NA,Division=c("Total",rep("Other",9))))
states$order=match(states$Division,strsplit("Total,New England,Middle Atlantic,East North Central,West North Central,South Atlantic,East South Central,West South Central,Mountain,Pacific,Other",",")[[1]])

states$Division=sub("([WE]).* (South Central)","\\1 \\2",states$Division)

m=m[order(states$ord[match(rownames(m),states$State.Code)]),]
m=m[,-1]
rownames(m)=states$State[match(rownames(m),states$State.Code)]

png("0.png",w=ncol(m)*30+1000,h=nrow(m)*30+1000,res=72)

ht_opt$COLUMN_ANNO_PADDING=unit(0,"mm")
ht_opt$ROW_ANNO_PADDING=unit(0,"mm")

split=states$Division[match(rownames(m),states$State)]

Heatmap(m,
  column_split=substring(colnames(m),1,4),
  row_split=factor(split,unique(split)),
  column_title=NULL,
  row_title_gp=gpar(fontsize=16),
  column_gap=unit(4,"mm"),
  row_gap=unit(4,"mm"),
  border="gray60",
  width=unit(ncol(m)*30,"pt"),
  height=unit(nrow(m)*30,"pt"),
  show_column_names=F,
  show_row_names=F,
  cluster_columns=F,
  cluster_rows=F,
  show_heatmap_legend=F,
  rect_gp=gpar(col="gray80",lwd=0),
  top_annotation=columnAnnotation(text=anno_text(gt_render(colnames(m),padding=unit(c(3,3,3,3),"mm")),just="left",rot=90,location=unit(0,"npc"),gp=gpar(fontsize=17,border="gray60",lwd=1))),
  bottom_annotation=columnAnnotation(text=anno_text(gt_render(colnames(m),padding=unit(c(3,3,3,3),"mm")),just="left",rot=270,gp=gpar(fontsize=17,border="gray60",lwd=1))),
  left_annotation=rowAnnotation(text=anno_text(gt_render(rownames(m),padding=unit(c(3,3,3,3),"mm")),just="right",location=unit(1,"npc"),gp=gpar(fontsize=17,border="gray60",lwd=1))),
  right_annotation=rowAnnotation(text=anno_text(gt_render(rownames(m),padding=unit(c(3,3,3,3),"mm")),just="left",location=unit(0,"npc"),gp=gpar(fontsize=17,border="gray60",lwd=1))),
  col=colorRamp2(seq(0,100,,256),lapply(seq(1,0,,256),(\(x)rgb(x,x,x))),
  cell_fun=\(j,i,x,y,w,h,fill)grid.text(round(m[i,j]),x,y,gp=gpar(fontsize=16,col=ifelse(m[i,j]>45,"white","black"))))
dev.off()

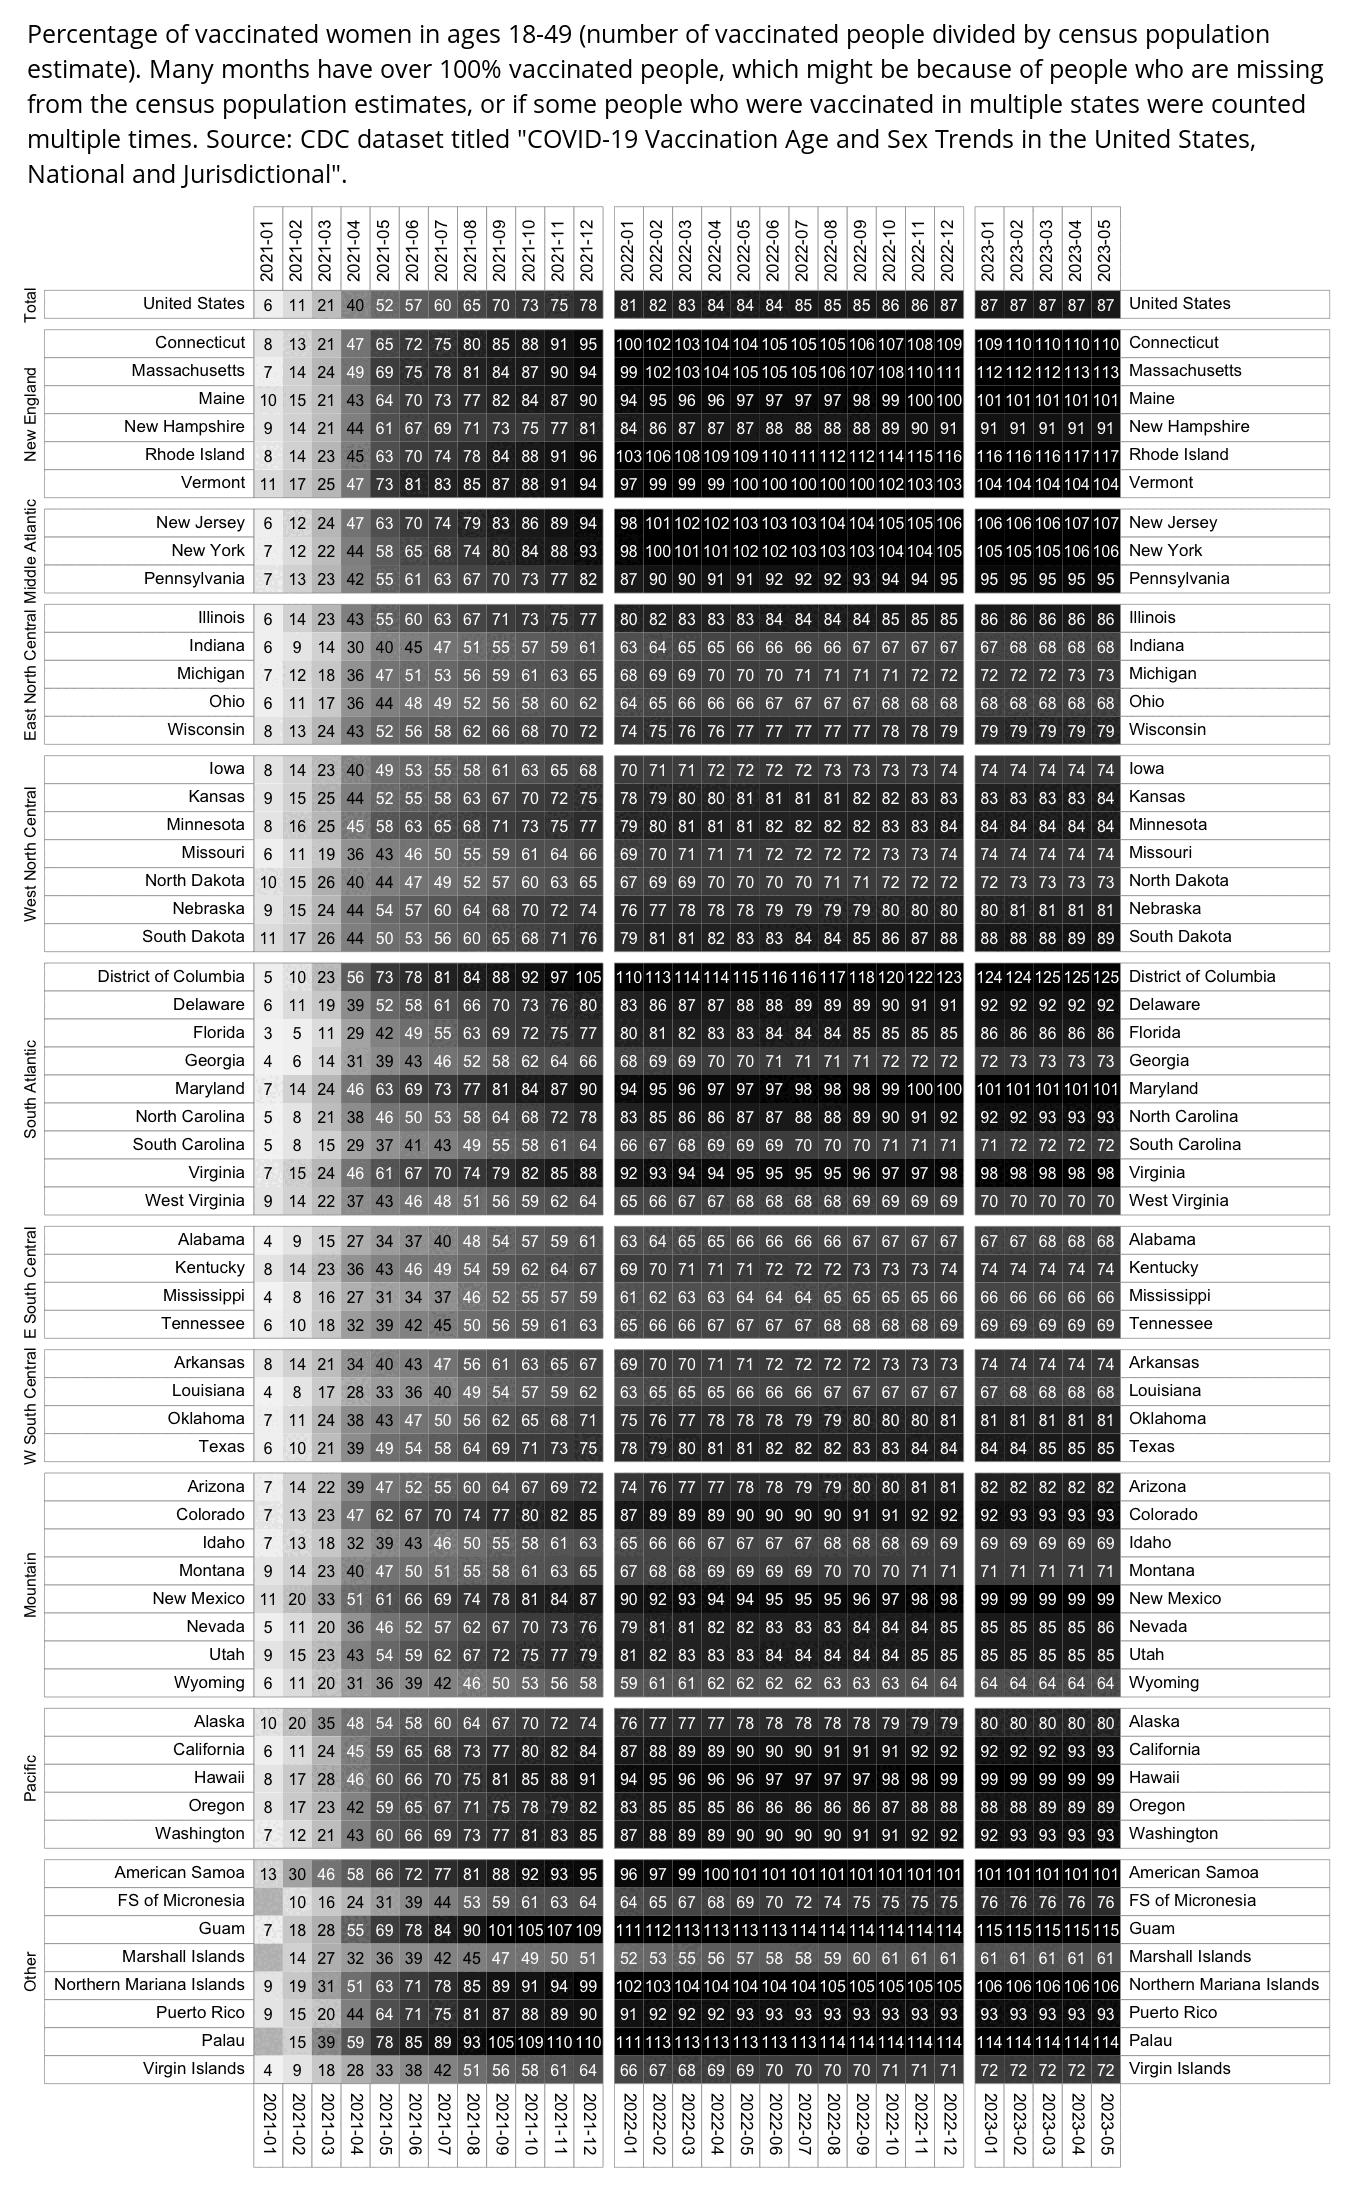
system("mogrify -trim 0.png;convert 0.png -gravity northwest -splice x10 -size `identify -format %w 0.png`x -pointsize 25 caption:'Percentage of vaccinated women in ages 18-49 (number of vaccinated people divided by census population estimate). Many months have over 100% vaccinated people, which might be because of people who are missing from the census population estimates, or if some people who were vaccinated in multiple states were counted multiple times. Source: CDC dataset titled \"COVID-19 Vaccination Age and Sex Trends in the United States, National and Jurisdictional\".' +swap -append -trim -bordercolor white -border 24 +repage 1.png")
CDC WONDER is an interface for making queries of the data from the National Vital Statistics System of the CDC. The data from NVSS has also been published here as fixed-width plain text files: https://www.cdc.gov/nchs/data_access/vitalstatsonline.htm#Mortality_Multiple. CDC's website only has links for downloading the data for the 7 most recent years, but you can download data for earlier years by simply replacing the year number in the URL.
In the files the fields for county and state have been omitted for privacy reasons, and week of death is not available. But the files make it possible to avoid CDC WONDER's suppression of deaths when the number of deaths is less than 10. And they also contain information about which line of the death certificate each cause of appeared on, and you can see which causes of death are connected to the same person.
When I exclude lines where column 20 for resident status is not 4 for foreign residents, the number of deaths in the files seems to be identical to the number of deaths returned by CDC WONDER.
This downloads the file for 2022, filters out foreign residents, and prints the count of deaths for each combination of year of death, month of death, age, and UCD:
$ wget https://ftp.cdc.gov/pub/Health_Statistics/NCHS/Datasets/DVS/mortality/mort2022us.zip
$ unzip mort2022us.zip
$ awk '{if(substr($0,20,1)==4)next;agetype=substr($0,70,1)==1;a[substr($0,102,4),substr($0,65,2),agetype==1||agetype==9?substr($0,71,3):0,substr($0,146,4)]++}ENDFILE{for(i in a)print i,a[i];delete a}' {OFS,SUBSEP}=, VS22MORT.DUSMCPUB_r20240307|head
2022,12,054,W69 ,4 # year month age UCD count
2022,05,028,V872,1
2022,05,074,I514,1
2022,07,092,M259,1
2022,05,074,Y34 ,1
2022,10,044,C859,1
2022,09,093,C23 ,1
2022,06,057,C509,60
2022,06,041,C434,1
2022,05,074,I516,26
The age field is 4 digits long, where it starts with 1 followed by the age in years for people who died at age 1 or above, with 9 for age not stated, and with 2, 4, 5, or 6 for infant deaths at age 0.
This page has CSV versions of the data: https://www.nber.org/research/data/mortality-data-vital-statistics-nchs-multiple-cause-death-data. It's missing CSV files for 2021-2023 but you can use the following code to convert the fixed-width files for 2021-2023 to CSV. The following code downloads all CSV files starting from 1999, because the files for earlier years use ICD-9 instead of ICD-10 codes. And it then makes gzipped CSV files for a subset of columns from the files:
# the downloads from nber.org were very slow so this launches parallel processes to download the files
parallel wget -j30 ::: $(for i in {1999..2017};do echo https://data.nber.org/mortality/$i/mort$i.csv.zip;done) https://data.nber.org/nvss/mortality/csv/Mort20{18..20}US.PubUse.csv https://ftp.cdc.gov/pub/Health_Statistics/NCHS/Datasets/DVS/mortality/mort202{1,2,3}us.zip

# unzip and rename
parallel unzip ::: mort*.zip
for i in {2018..2020};do mv Mort$i*.csv mort$i.csv;done

# install readr (readr::read_csv is much faster than read.csv from base R)
# Rscript -e 'install.packages("readr",repos="https://cloud.r-project.org")'

# taken from R script posted by NBER
Rscript --no-init-file -e 'library(readr);for(i in 21:23){f=Sys.glob(paste0("VS",i,"MORT*"));t=read_fwf(f,fwf_cols(restatus=c(20,20),educ1989=c(61,62),educ2003=c(63,63),educflag=c(64,64),monthdth=c(65,66),sex=c(69,69),age=c(70,73),ageflag=c(74,74),ager52=c(75,76),ager27=c(77,78),ager12=c(79,80),ager22=c(81,82),placdth=c(83,83),marstat=c(84,84),weekday=c(85,85),year=c(102,105),injwork=c(106,106),mandeath=c(107,107),methdisp=c(108,108),autopsy=c(109,109),activity=c(144,144),injury=c(145,145),ucod=c(146,149),ucr358=c(150,152),ucr113=c(154,156),ucr130=c(157,159),ucr39=c(160,161),eanum=c(163,164),econdp_1=165,econds_1=166,enicon_1=c(167,170),econdp_2=172,econds_2=173,enicon_2=c(174,177),econdp_3=179,econds_3=180,enicon_3=c(181,184),econdp_4=186,econds_4=187,enicon_4=c(188,191),econdp_5=193,econds_5=194,enicon_5=c(195,198),econdp_6=200,econds_6=201,enicon_6=c(202,205),econdp_7=207,econds_7=208,enicon_7=c(209,212),econdp_8=214,econds_8=215,enicon_8=c(216,219),econdp_9=221,econds_9=222,enicon_9=c(223,226),econdp_10=228,econds_10=229,enicon_10=c(230,233),econdp_11=235,econds_11=236,enicon_11=c(237,240),econdp_12=242,econds_12=243,enicon_12=c(244,247),econdp_13=249,econds_13=250,enicon_13=c(251,254),econdp_14=256,econds_14=257,enicon_14=c(258,261),econdp_15=263,econds_15=264,enicon_15=c(265,268),econdp_16=270,econds_16=271,enicon_16=c(272,275),econdp_17=277,econds_17=278,enicon_17=c(279,282),econdp_18=284,econds_18=285,enicon_18=c(286,289),econdp_19=291,econds_19=292,enicon_19=c(293,296),econdp_20=298,econds_20=299,enicon_20=c(300,303),ranum=c(341,342),record_1=c(344,348),record_2=c(349,353),record_3=c(354,358),record_4=c(359,363),record_5=c(364,368),record_6=c(369,373),record_7=c(374,378),record_8=c(379,383),record_9=c(384,388),record_10=c(389,393),record_11=c(394,398),record_12=c(399,403),record_13=c(404,408),record_14=c(409,413),record_15=c(414,418),record_16=c(419,433),record_17=c(424,428),record_18=c(429,433),record_19=c(434,438),record_20=c(439,443),race=c(445,446),brace=c(447,447),raceimp=c(448,448),racer3=c(449,449),racer5=c(450,450),hispanic=c(484,486),hspanicr=c(488,488),racer40=c(489,490)));write_csv(t,paste0("mort20",i,".csv"),na="")}'

# make gzipped CSV files for a subset of columns
for i in {1999..2023};do sed '1s/\beduc\b/educ2003/' mort$i.csv|csvtk cut -f restatus,monthdth,sex,age,year,ucod,enicon_1,enicon_2,enicon_3,enicon_4,enicon_5,enicon_6,enicon_7,enicon_8,enicon_9,enicon_10,enicon_11,enicon_12,enicon_13,enicon_14,enicon_15,enicon_16,enicon_17,enicon_18,enicon_19,enicon_20|gzip -c>$i.csv.gz;done
This makes a file grouped by cause, year, month, and age for the count of UCD deaths, count of MCD deaths, and count of MCD deaths that also have MCD COVID. In the case of deaths where an ICD code is listed as only UCD but not MCD, I still counted the code as MCD to be consistent with CDC WONDER:
r=do.call(rbind,lapply(1999:2023,\(i){
  t=fread(paste0(i,".csv.gz"))[restatus!=4]
  t[year>=2003,age:=ifelse(age%/%1000%in%c(1,9),age%%1000,0)] # unknown age is usually 9999 but sometimes 1999
  t[year<2003,age:=ifelse(age>=200&age!=999,0,age)] # age field is 3 characters long for years before 2003
  t=t[,.(.I,year,month=monthdth,age,ucd=ucod,mcd=unlist(.SD,,F)),.SDcols=patterns("enicon_")][mcd!=""]
  ucd=t[rowid(I)==1,.(ucd=.N),.(year,month,age,cause=ucd)]
  t2=rbind(t[,.(I,year,month,age,cause=mcd)],t[rowid(I)==1,.(I,year,month,age,cause=ucd)])
  mcd=t2[rowid(I,cause)==1][,.(mcd=.N),.(year,month,age,cause)]
  and=t2[I%in%t2[cause=="U071",I]][rowid(I,cause)==1][,.(andcovid=.N),.(year,month,age,cause)]
  t=merge(merge(ucd,mcd,all=T),and,all=T);t[is.na(t)]=0;t}))

setorder(r,year,month,age,cause)
fwrite(r,"vital.csv",na="")
system("xz -f vital.csv")
I uploaded the output here: f/vital.csv.xz.
This gets the most common MCD for deaths with UCD COVID in ages below 18:
library(readr);library(data.table)
t=do.call(rbind,lapply(Sys.glob(paste0("VS",20:22,"MORT.*")),\(i)setDT(read_fwf(i,fwf_cols(restatus=c(20,20),age=c(70,73),ucod=c(146,149),enicon_1=c(167,170),enicon_2=c(174,177),enicon_3=c(181,184),enicon_4=c(188,191),enicon_5=c(195,198),enicon_6=c(202,205),enicon_7=c(209,212),enicon_8=c(216,219),enicon_9=c(223,226),enicon_10=c(230,233),enicon_11=c(237,240),enicon_12=c(244,247),enicon_13=c(251,254),enicon_14=c(258,261),enicon_15=c(265,268),enicon_16=c(272,275),enicon_17=c(279,282),enicon_18=c(286,289),enicon_19=c(293,296),enicon_20=c(300,303))))))

sub=t[age!=9999][,age:=ifelse(age<2000,age-1000,0)][restatus!=4&age<18&ucod=="U071"]

icd=setkey(fread("http://sars2.net/f/wonderbyicd.csv.gz")[rowid(code)==1][,code:=sub(".","",code,fixed=T)],"code")

mcd=na.omit(sub[,.(id=.I,age,pos=rep(1:20,each=.N),code=unlist(.SD[,-(1:3)],,F))])
mcd$cause=icd[mcd$code,cause]

o=merge(mcd[rowid(id,code)==1,.(pct=.N/sub[,.N]*100,age=mean(age)),code],icd)
o[order(-pct),sprintf("%5.1f %4.1f %4-s %s",pct,age,code,cause)][1:30]|>writeLines()
The first column shows the percentage of people with the MCD, and the second column shows the average age of people with the MCD. About 3.6% of the records have infantile cerebral palsy listed as a MCD, about 2.1% have Down syndrome, and about 2.3% have extreme immaturity:
100.0  9.2 U071 COVID-19
 26.3 10.8 J189 Pneumonia, unspecified
  9.4 11.2 I469 Cardiac arrest, unspecified
  9.2 11.5 J80  Adult respiratory distress syndrome
  9.2 10.3 J960 Acute respiratory failure
  7.7  9.8 A419 Septicaemia, unspecified
  7.2 10.9 J969 Respiratory failure, unspecified
  6.5  9.7 R688 Other specified general symptoms and signs
  6.1 14.4 E669 Obesity, unspecified
  4.9 11.0 J984 Other disorders of lung
  4.3  9.3 B99  Other and unspecified infectious diseases
  4.1 10.1 J961 Chronic respiratory failure
  3.8  9.5 R568 Other and unspecified convulsions
  3.7 15.3 E668 Other obesity
  3.6 11.7 G809 Infantile cerebral palsy, unspecified
  3.5  5.8 B348 Other viral infections of unspecified site
  3.1  4.3 P073 Other preterm infants
  2.9  9.7 I514 Myocarditis, unspecified
  2.9 10.6 R092 Respiratory arrest
  2.8 11.2 R090 Asphyxia
  2.6  5.9 R99  Other ill-defined and unspecified causes of mortality
  2.5  9.7 G931 Anoxic brain damage, not elsewhere classified
  2.3  5.0 P072 Extreme immaturity
  2.2 10.1 R629 Lack of expected normal physiological development, unspecified
  2.1 10.1 Q909 Down syndrome, unspecified
  2.0 10.1 G409 Epilepsy, unspecified
  2.0  7.3 J129 Viral pneumonia, unspecified
  2.0  3.9 J180 Bronchopneumonia, unspecified
  2.0 14.1 J450 Predominantly allergic asthma
  2.0 12.0 N179 Acute renal failure, unspecified
In some rare cases the NVSS files have an ICD code listed as UCD but not MCD. For example there's 45,710 deaths in 2021 with MCD X44 on CDC WONDER but only 45,709 deaths in the NVSS file. I think it's because the NVSS file has one death where X44 is UCD but not MCD, but it's still counted as MCD by CDC WONDER:
$ wget ftp.cdc.gov/pub/Health_Statistics/NCHS/Datasets/DVS/mortality/mort2021us.zip;unzip mort2021us.zip
$ awk 'substr($0,20,1)!=4{ucd=substr($0,146,4);for(i=1;i<=20;i++){mcd=substr($0,167+(i-1)*7,4);if(mcd=="    ")next;print NR,ucd,mcd}}' VS21*txt>temp
$ awk '$3=="X44"{a[$1]}$2=="X44"||$3=="X44"{b[$1]}END{print length(a),length(b)}' temp
45709 45710 # first number is MCD deaths, second number is MCD or UCD deaths
Go here: https://wonder.cdc.gov/mcd-icd10-provisional.html. Under the section for selecting multiple causes of death, select all items and click "Open Fully", and then run this:
$ xjs()(osascript -e'on run{a}' -e'tell app"google chrome"to tell active tab of window 1 to execute javascript a' -eend "$@")
$ xjs '[...document.querySelectorAll("#codes-div-D176\\.V13 option")].map(x=>x.innerText.replace(/[*†]/g,"").replace(/^\s*-?\s*(\S*)\s*\((.*)\)/,"$1,\"$2\"")).join("\n")'|sed 1d
A00-B99,"Certain infectious and parasitic diseases"
A00-A09,"Intestinal infectious diseases"
A00,"Cholera"
A00.0,"Cholera due to Vibrio cholerae 01, biovar cholerae"
[...]
I uploaded the output here: f/wondericd.csv.
The last release of this nursing home dataset was in January 2025: https://data.cms.gov/covid-19/covid-19-nursing-home-data.
system("wget https://data.cms.gov/sites/default/files/dataset_zips/ea365a77467a04182b55114c5791c2e3/COVID-19%20Nursing%20Home%20Data.zip;unzip 'COVID-19 Nursing Home Data.zip'")

t=fread("COVID-19 Nursing Home Data/2025-01-05/COVID-19 Nursing Home Data 01.05.2025.csv")

reg=fread("region states
Northeast CT,MA,ME,NH,NJ,NY,PA,RI,VT
South AL,AR,DC,DE,FL,GA,KY,LA,MD,MS,NC,OK,SC,TN,TX,VA,WV
Midwest IA,IL,IN,KS,MI,MN,MO,ND,NE,OH,SD,WI
West AK,AZ,CA,CO,HI,ID,MT,NM,NV,OR,UT,WA,WY")
reg=reg[,{x=strsplit(states,",");setNames(rep(region,lengths(x)),unlist(x))}]

t[,date:=as.Date(`Week Ending`,"%m/%d/%y")-3]
t[,region:=factor(reg[`Provider State`],unique(reg))]
a=t[,.(pop=sum(`Total Number of Occupied Beds`,na.rm=T)),.(date,region)]
a[,quar:=paste0(year(date),"Q",(month(date)-1)%/%3+1)]

m=a[pop>0,tapply(pop,.(quar,region),mean)]
round(t(t(m)/colMeans(m))*100)
# population as percentage of average quarterly population within region
#        Northeast South Midwest West
# 2020Q2        95    98     101   98
# 2020Q3        96    97     102   96
# 2020Q4        96    94      98   95
# 2021Q1        94    92      94   92
# 2021Q2        97    95      97   96
# 2021Q3        99    97      99   97
# 2021Q4        99    98      99   98
# 2022Q1        99    98      99   97
# 2022Q2       100    99      99   99
# 2022Q3       101   100     100  100
# 2022Q4       102   101     101  101
# 2023Q1       103   103     101  103
# 2023Q2       103   103     101  103
# 2023Q3       103   104     102  104
# 2023Q4       104   105     102  104
# 2024Q1       105   106     103  106
# 2024Q2       104   105     102  106
# 2024Q3       102   104     100  106
library(ggplot2)

t=read.csv("https://sars2.net/f/ons-table-1-2023-august.csv",na.strings=c("x","<3"))
t=t[t$cause=="All causes",]

xy=data.frame(x=as.Date(paste0(t$year,"-",match(t$month,month.name),"-1")),y=t$asmr,pop=t$pop)
xy$z=factor(t$status,unique(t$status))

xy$frac=xy$pop/with(subset(xy,xy$z!="Ever vaccinated"),tapply(pop,x,sum))[as.character(xy$x)]
xy$frac[xy$z=="Ever vaccinated"]=0

ystart=0;yend=7000;xstart=min(xy$x);xend=max(xy$x)

pal=c(hcl(c(210,110,110,60,60,60,0,0,310,310)+15,c(90,90,70,90,70,60,90,70,90,70),c(70,70,50,70,50,30,70,50,70,50)),"black")

ggplot(xy,aes(x=x,y=y,color=z))+
geom_area(aes(y=frac*yend*.9999,fill=z),linewidth=.1,show.legend=F,alpha=.3)+
geom_hline(yintercept=c(ystart,yend),linewidth=.3,lineend="square")+
geom_vline(xintercept=c(xstart,xend),linewidth=.3,lineend="square")+
geom_line(linewidth=.3)+
geom_point(size=.7)+
# geom_text(label=round(xy$y),size=2,vjust=-.7,show.legend=F)+
scale_x_date(breaks=unique(xy$x),expand=expansion(0),date_labels="%b\n%y")+
scale_y_continuous(limits=c(ystart,yend),breaks=seq(0,yend,1000),expand=expansion(0),labels=\(i)ifelse(i<1000,i,paste0(round(i/1e3),"k")),sec.axis=sec_axis(trans=~./yend*100,name="Percentage of group"))+
coord_cartesian(clip="off")+
labs(x=NULL,y="Age-standardized mortality rate per 100,000 person-years")+
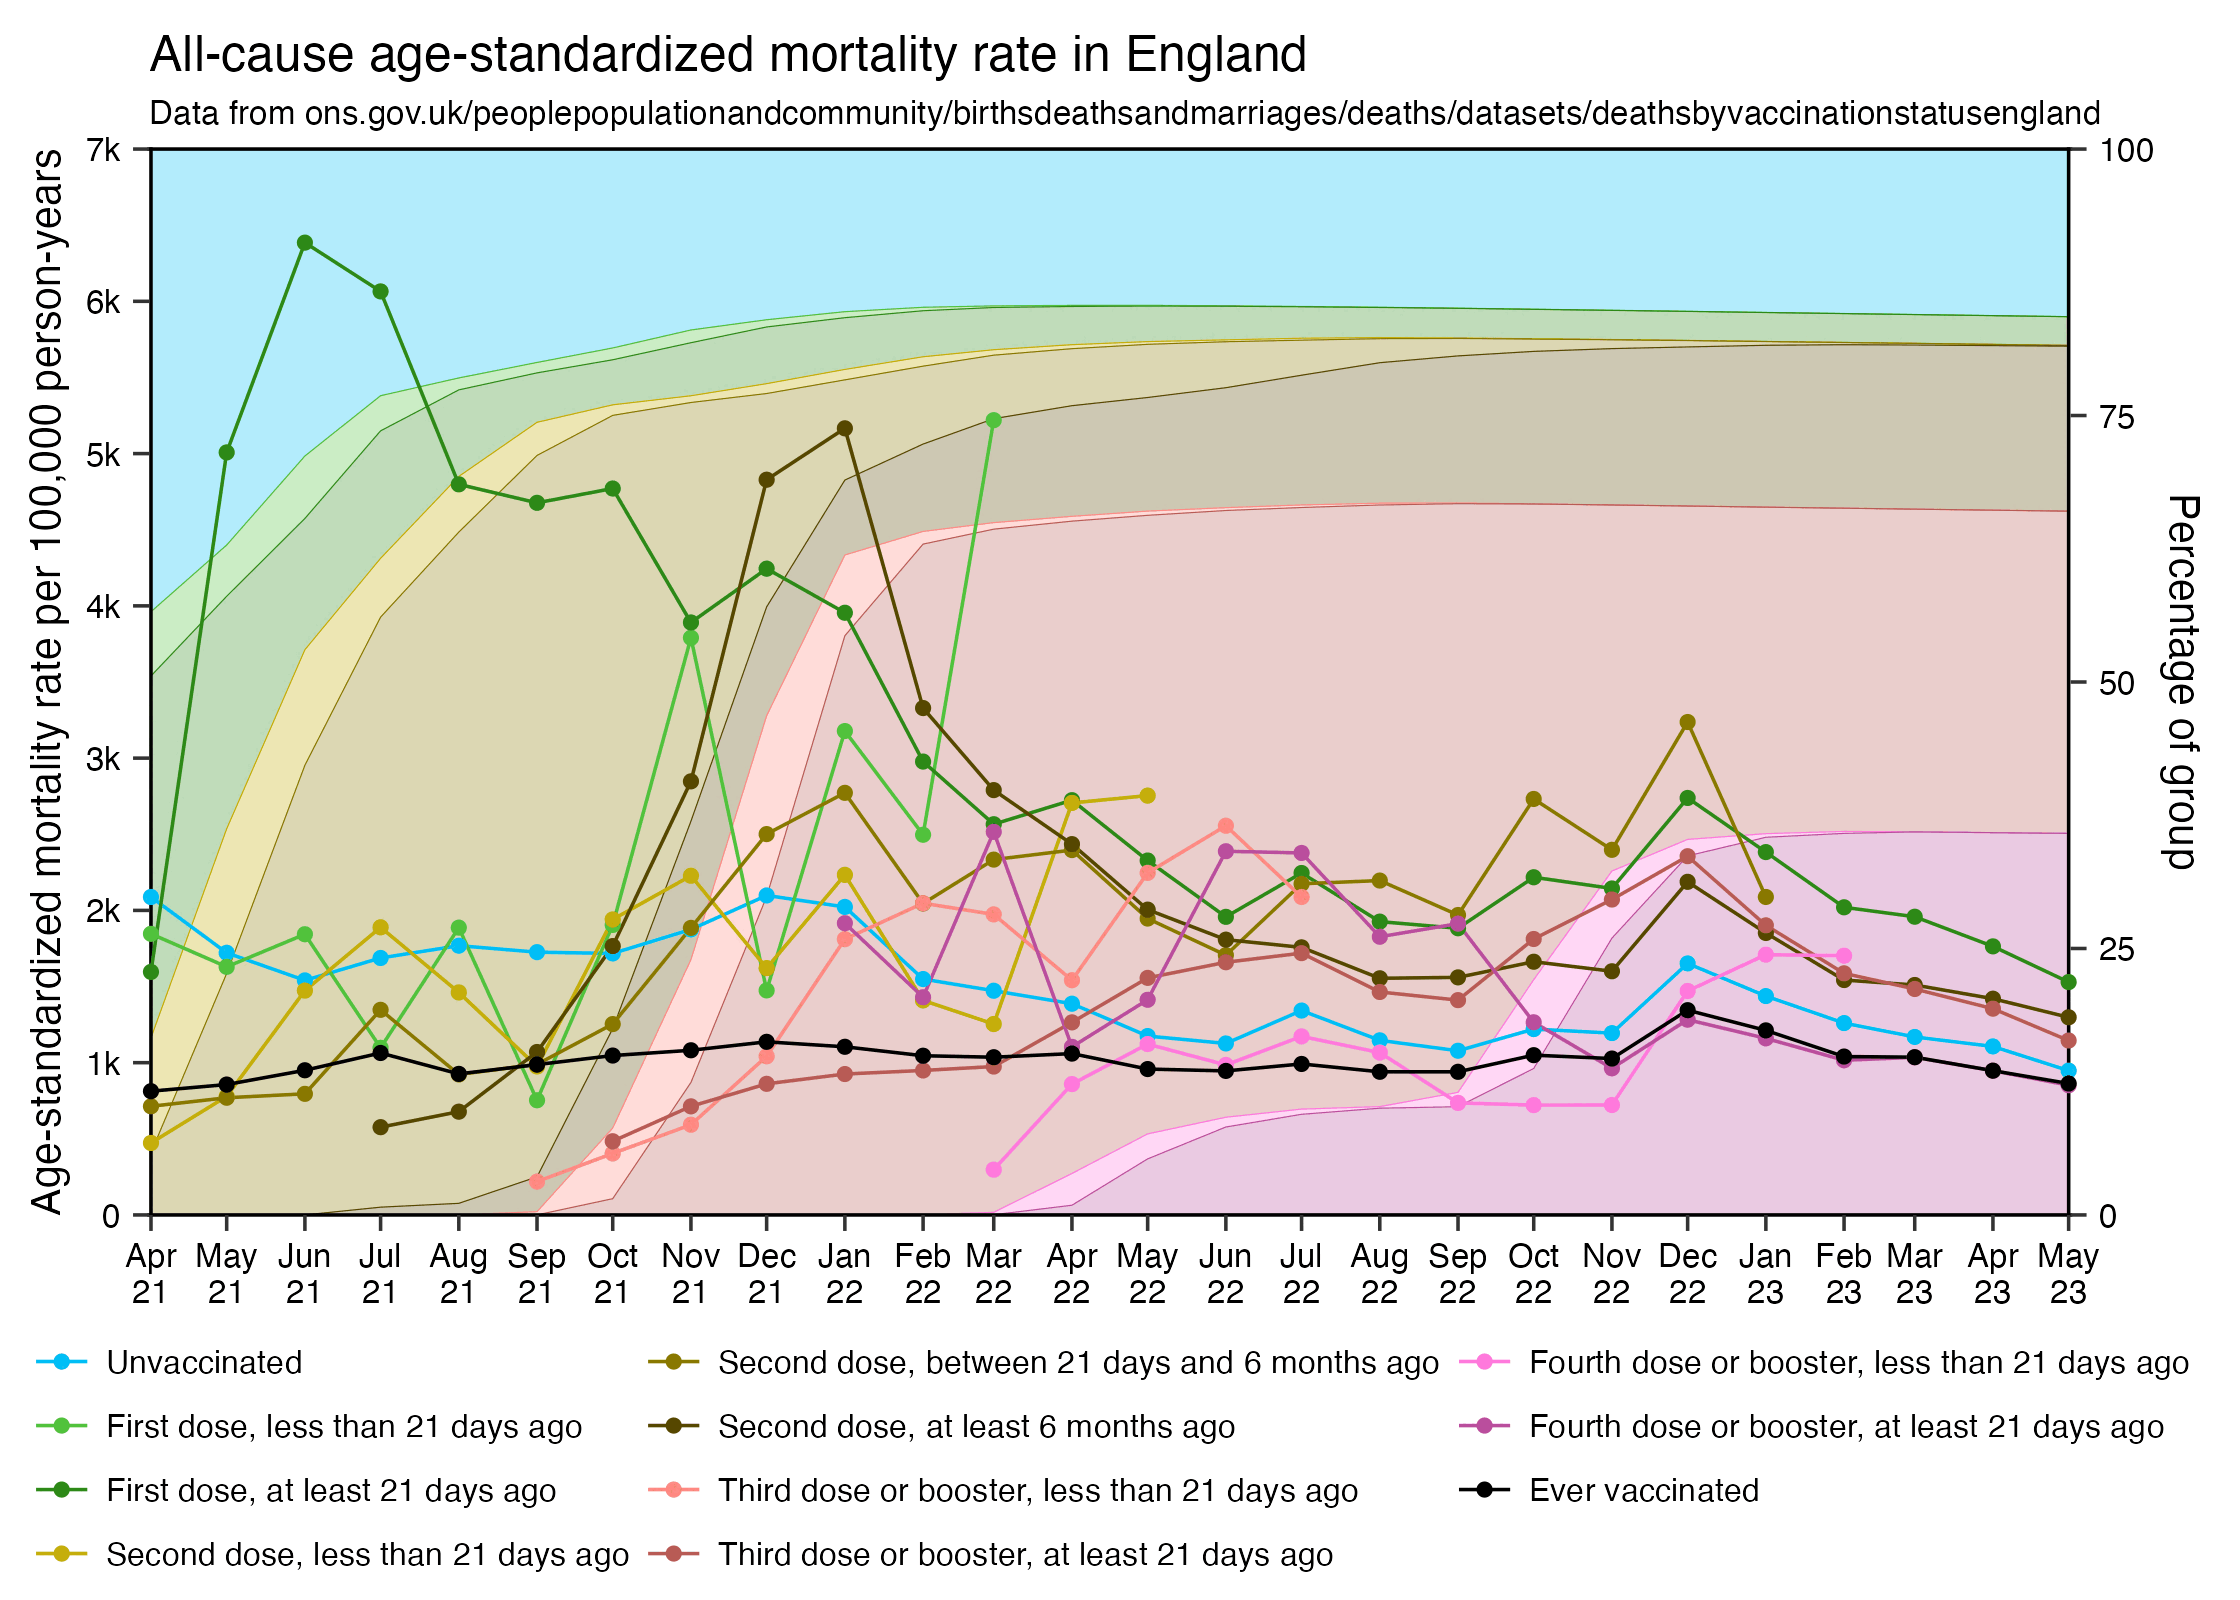
ggtitle("All-cause age-standardized mortality rate in England",subtitle="Data from ons.gov.uk/peoplepopulationandcommunity/birthsdeathsandmarriages/deaths/datasets/deathsbyvaccinationstatusengland")+
scale_color_manual(values=pal)+
scale_fill_manual(values=pal)+
guides(color=guide_legend(ncol=3))+
theme(axis.text=element_text(size=6,color="black"),
  axis.ticks=element_line(linewidth=.3),
  axis.ticks.length=unit(.2,"lines"),
  axis.title=element_text(size=7.5),
  legend.background=element_blank(),
  legend.box.just="center",
  legend.direction="vertical",
  legend.key=element_rect(fill="white"),
  legend.spacing.x=unit(.15,"lines"),
  legend.key.size=unit(.8,"lines"),
  legend.justification="center",
  legend.margin=margin(-.9,0,-.2,0,"lines"),
  legend.position="bottom",
  legend.text=element_text(size=5.85,vjust=.5),
  legend.title=element_blank(),
  panel.background=element_rect(fill="white"),
  panel.grid=element_blank(),
  plot.subtitle=element_text(size=6,margin=margin(0,0,.6,0,"lines")),
  plot.title=element_text(size=9,margin=margin(.1,0,.4,0,"lines")))
ggsave("1.png",width=5.6,height=4,dpi=400)
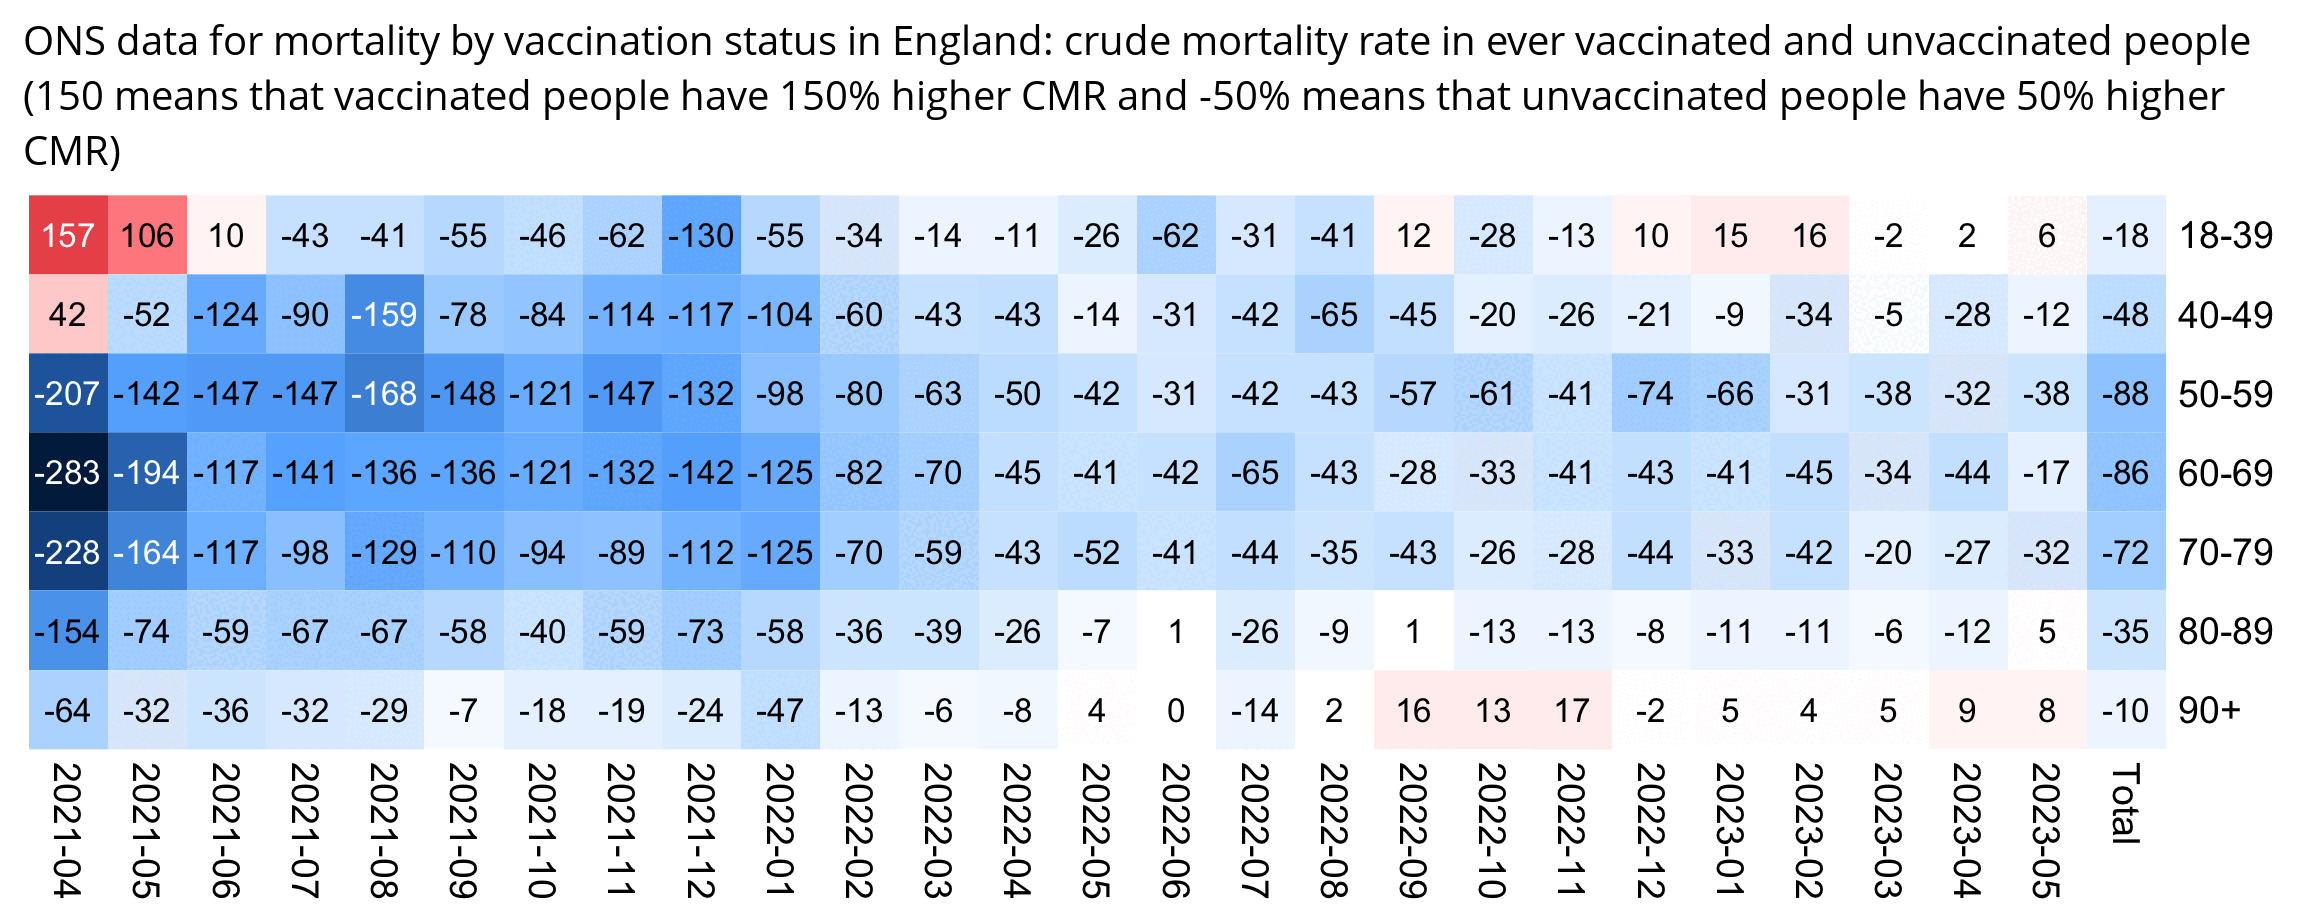
In Table 2 of the spreadsheet published by the ONS which shows ASMR by age group, for some reason there is no "ever vaccinated" group included but only individual vaccination status groups. However you can still calculate a total crude mortality rate within all vaccinated people by summing together the deaths and person-years in individual vaccination status groups:
t=read.csv("http://sars2.net/f/ons-table-2-2023-august.csv",na.strings=c("x","<3"))

d=data.frame(age=t$age,month=sprintf("%d-%02d",t$year,match(t$month,month.name)),status=t$status!="Unvaccinated",dead=t$dead,pop=t$pop)
d=rbind(d,cbind(aggregate(d[,4:5],d[,c(1,3)],sum,na.rm=T),month="Total"))

dead=tapply(d$dead,d[,1:3],sum,na.rm=T)
pop=tapply(d$pop,d[,1:3],sum,na.rm=T)

vax=(dead[,,1]/pop[,,1])
unvax=(dead[,,2]/pop[,,2])
m=(unvax-vax)/ifelse(unvax>vax,vax,unvax)*100
disp=round(m)
maxcolor=max(abs(m))

library(colorspace)
pheatmap::pheatmap(m,filename="0.png",display_numbers=disp,
  cluster_rows=F,cluster_cols=F,legend=F,cellwidth=19,cellheight=19,fontsize=9,fontsize_number=8,
  border_color=NA,na_col="white",
  number_color=ifelse((abs(m)>.55*maxcolor)&!is.na(m),"white","black"),
  breaks=seq(-maxcolor,maxcolor,,256),
  colorRampPalette(hex(HSV(c(210,210,210,210,0,0,0,0,0),c(1,.8,.6,.3,0,.3,.6,.8,1),c(.3,.65,1,1,1,1,1,.65,.3))))(256))

system("w=`identify -format %w 0.png`;convert 0.png -gravity northwest -shave x10 \\( -size $[$w-40]x -pointsize 40 caption:'ONS data for mortality by vaccination status in England: crude mortality rate in ever vaccinated and unvaccinated people (150 means that vaccinated people have 150% higher CMR and -50% means that unvaccinated people have 50% higher CMR)' -extent $[w-40]x -gravity center \\) +swap -append -trim -bordercolor white -border 24 +repage 1.png")
# install.packages("BiocManager")
# BiocManager::install("ComplexHeatmap")
# install.packages("circlize")
# install.packages("colorspace")

library(ComplexHeatmap)
library(circlize)
library(colorspace)

# system("wget -Umozilla --content-disposition https://www.ons.gov.uk/file?uri=/peoplepopulationandcommunity/birthsdeathsandmarriages/deaths/adhocs/1491dailydeathsbydateofoccurrence1june2014to31july2023bysingleyearofageenglandandwales/dailydeaths20142023.xlsx")

t=as.data.frame(readxl::read_excel("dailydeaths20142023.xlsx",sheet=4,range="A6:CP3354"))

mav=\(x,y){l=length(x);s=e=y%/%2;if(y%%2==0)s=s-1;setNames(sapply(1:l,\(i)mean(x[max(1,i-s):min(l,i+e)],na.rm=T)),names(x))}

starts=seq(0,90,10)
m=sapply(starts,\(i){
  t3=data.frame(x=as.double(as.Date(paste0(t$Year,"-",t$Month,"-",t$Day))),y=rowSums(t[,(i+3):min(i+12,ncol(t)),drop=F]))
  t3$mav=mav(t3$y,3)
  past=t3[,1]>=as.Date("2015-1-1")&t3[,1]<as.Date("2020-1-1")
  linear=predict(lm(mav~x,t3[past,]),t3)
  days=sub("^.....","",as.Date(t3$x,"1970-1-1"))
  daily=tapply((t3$y-linear)[past],days[past],mean)
  excess=100*(t3$y-linear-daily[days])/linear
  # tapply(excess,sub("...$","",as.Date(t3$x,"1970-1-1")),mean) # display monthly instead of weekly data
  tapply(excess,format(as.Date(t3$x,"1970-1-1"),"%G-%V"),mean)
})

colnames(m)=paste0(starts,"-",starts+9)
colnames(m)[ncol(m)]="90+"
m=t(m[rownames(m)>="2020"&rownames(m)<"2022",])

rowmax=apply(m,1,\(x)x==max(x))

png("1.png",w=ncol(m)*30+1000,h=nrow(m)*30+1000,res=72)

ht_opt$COLUMN_ANNO_PADDING=unit(0,"mm")
ht_opt$ROW_ANNO_PADDING=unit(0,"mm")

maxcolor=max(m)

Heatmap(
  m,
  show_heatmap_legend=F,
  show_column_names=F,
  show_row_names=F,
  width=unit(ncol(m)*30,"pt"),
  height=unit(nrow(m)*30,"pt"),
  row_dend_width=unit(200,"pt"),
  clustering_distance_rows="euclidean",
  cluster_columns=F,
  cluster_rows=F,
  column_title=stringr::str_wrap("Weekly percentage of excess deaths by date of occurrence for 10-year age groups in England and Wales. Excess percent is based on 2015-2019 linear trend with average difference from linear trend on each 366 days of the year in 2015-2019 added to the corresponding day for subsequent years (using a 15-day moving average of daily data). The data is based on number of deaths only and not divided by the size of the age groups. ISO 8601 week numbers used. Source: https://www.ons.gov.uk/peoplepopulationandcommunity/birthsdeathsandmarriages/deaths/adhocs/1491dailydeathsbydateofoccurrence1june2014to31july2023bysingleyearofageenglandandwales.",220),
  column_title_gp=gpar(fontsize=23),
  rect_gp=gpar(col="gray80",lwd=0),
  top_annotation=columnAnnotation(text=anno_text(gt_render(colnames(m),padding=unit(c(3,3,3,3),"mm")),just="left",rot=90,location=unit(0,"npc"),gp=gpar(fontsize=17,border="gray70",lwd=1))),
  bottom_annotation=columnAnnotation(text=anno_text(gt_render(colnames(m),padding=unit(c(3,3,3,3),"mm")),just="left",rot=270,gp=gpar(fontsize=17,border="gray70",lwd=1))),
  left_annotation=rowAnnotation(text=anno_text(gt_render(rownames(m),padding=unit(c(3,3,3,3),"mm")),just="right",location=unit(1,"npc"),gp=gpar(fontsize=17,border="gray70",lwd=1))),
  right_annotation=rowAnnotation(text=anno_text(gt_render(rownames(m),padding=unit(c(3,3,3,3),"mm")),just="left",location=unit(0,"npc"),gp=gpar(fontsize=17,border="gray70",lwd=1))),
  col=colorRamp2(seq(-maxcolor,maxcolor,,9),hex(HSV(c(210,210,210,210,0,0,0,0,0),c(.7,.7,.6,.3,0,.3,.6,.7,.7),c(.3,.65,1,1,1,1,1,.65,.3)))),
  cell_fun=\(j,i,x,y,w,h,fill)grid.text(sprintf("%.0f",m[i,j]),x,y,gp=gpar(fontface=ifelse(rowmax[j,i],4,"plain"),fontsize=16,col=ifelse(abs(m[i,j])>=maxcolor*.5,"white","black")))
)

dev.off()
system("mogrify -gravity center -trim -border 16 -bordercolor white 1.png")

In December 2022 when ASMR peaked in triple-jabbed people, there were about 16 times as many people with 4 doses than 3 doses in the age groups 80-89 and 90+:
> t=read.csv("https://sars2.net/f/ons-table-2-2023-august.csv",na.strings=c("x","<3"))
> t=t[t$cause=="All causes"&t$month=="December"&t$year==2022,]
> t3=t[grepl("Third",t$status),]
> t4=t[grepl("Fourth",t$status),]
> tapply(t4$pop,t4[,4],sum)/tapply(t3$pop,t3[,4],sum)
     18-39      40-49      50-59      60-69      70-79      80-89        90+
 0.1355542  0.2381953  1.5760131  3.5165494  9.5796245 15.7584568 15.7678801
People aged 80-89 make up 4% of the 2013 European Standard Population. But in the group "Third dose or booster, at least 21 days ago" in December 2022, people aged 80-89 accounted for only about 0.9% of total person-years, but they are still given 4% weight when calculating the ASMR value, so they are overrepresented by a factor of about 4.6 in the ASMR figure relative to their population size:
> t=read.csv("https://sars2.net/f/ons-table-2-2023-august.csv",na.strings=c("x","<3"))
> t=t[t$cause=="All causes"&t$month=="December"&t$year==2022&t$status=="Third dose or booster, at least 21 days ago",]
> print.data.frame(data.frame(age=t$age,pop_pct=round(100*t$pop/sum(t$pop),1)),row.names=F)
   age pop_pct
 18-39             44.5
 40-49             26.5
 50-59             16.4
 60-69              8.4
 70-79              3.0
 80-89              0.9
   90+              0.2
The following code calculates a similar overrepresentation factor for each age and vaccination status group:
# install.packages("BiocManager")
# BiocManager::install("ComplexHeatmap")
# install.packages("circlize"
# install.packages("colorspace")

library(ComplexHeatmap)
library(colorspace)
library(circlize)

esp=setNames(c(27700,14000,13500,11500,9000,4000,1000),c("18-39","40-49","50-59","60-69","70-79","80-89","90+"))

t=read.csv("https://sars2.net/f/ons-table-2-2023-august.csv",na.strings=c("x","<3"))
t=t[t$cause=="All causes",]
d2=data.frame(date=paste0(t$year,sprintf("-%02d",match(t$month,month.name))),age=t$age,status=t$status,pop=t$pop)

sums=aggregate(d2$pop,list(d2$date,d2$status),sum)|>`colnames<-`(c("date","status","sum"))
d3=merge(d2,sums)
d3$ratio=ifelse(d3$pop==0,NA,(esp[d3$age]/1e5)/(d3$pop/d3$sum))
d3=d3[order(match(d3$status,unique(t$status)),d3$age),]

l2w=\(x,row=1,col=2,val=3,default=NA){c1=as.character(x[,row]);c2=as.character(x[,col]);u1=unique(c1);u2=unique(c2);o=matrix(default,length(u1),length(u2),,list(u1,u2));o[cbind(c1,c2)]=x[,val];o}
m=l2w(data.frame(paste0(d3$status,": ",d3$age),d3$date,d3$ratio))

under=m<1&!is.na(m)
m[under]=-1/m[under]

cellwidth=30
cellheight=30
png("1.png",w=ncol(m)*cellwidth+1000,h=nrow(m)*cellheight+1000,res=72)

ht_opt$COLUMN_ANNO_PADDING=unit(0,"mm")
ht_opt$ROW_ANNO_PADDING=unit(0,"mm")

disp=sprintf(ifelse(abs(m)>=10,"%.0f","%.1f"),m)|>matrix(nrow(m))

m=m-sign(m)
m=ifelse(m<0,-1,1)*abs(m)^.5
maxcolor=max(m,na.rm=T)

Heatmap(
  m,
  row_split=factor(sub(":.*","",rownames(m)),unique(t$Vaccination.status)),
  gap=unit(4,"mm"),
  row_title=NULL,
  show_heatmap_legend=F,
  show_column_names=F,
  show_row_names=F,
  width=unit(ncol(m)*cellwidth,"pt"),
  height=unit(nrow(m)*cellheight,"pt"),
  row_dend_width=unit(200,"pt"),
  cluster_columns=F,
  cluster_rows=F,
  na_col="white",
  column_title=stringr::str_wrap("English mortality statistics by vaccination status: factor by which an age group is overrepresented in ASMR value relative to its share of person-years. The AMSR figures are calculated based on the 2013 European Standard Population, where for example the age group 80-89 is always given 4% weight because it makes up 4% of ESP2013. But in the group \"Third dose or booster, at least 21 days ago\" in December 2022, the age group 80-89 made up about 1.2% of total person years so it was overrepresented by a factor of about 4.4 in the ASMR figure. A negative value means that an age group is underrepresented. An empty square indicates that there were zero people in the group. The reason why people with three doses have had high ASMR in 2023 might be because of the healthy vaccinee effect, because in 2023 the age groups 80-89 and 90+ have contained about 15-17 times as many people with 4 doses as 3 doses, and people with only three doses in elderly age groups consist of a small number of \"stragglers\" who have a disproportionate effect on the ASMR figures. R code: sars2.net/stat.html.",130),
  column_title_gp=gpar(fontsize=26),
  rect_gp=gpar(col="gray80",lwd=0),
  top_annotation=columnAnnotation(text=anno_text(gt_render(colnames(m),padding=unit(c(3,3,3,3),"mm")),just="left",rot=90,location=unit(0,"npc"),gp=gpar(fontsize=17,border="gray70",lwd=1))),
  bottom_annotation=columnAnnotation(text=anno_text(gt_render(colnames(m),padding=unit(c(3,3,3,3),"mm")),just="left",rot=270,gp=gpar(fontsize=17,border="gray70",lwd=1))),
  left_annotation=rowAnnotation(text=anno_text(gt_render(rownames(m),padding=unit(c(3,3,3,3),"mm")),just="right",location=unit(1,"npc"),gp=gpar(fontsize=17,border="gray70",lwd=1))),
  right_annotation=rowAnnotation(text=anno_text(gt_render(rownames(m),padding=unit(c(3,3,3,3),"mm")),just="left",location=unit(0,"npc"),gp=gpar(fontsize=17,border="gray70",lwd=1))),
  col=colorRamp2(seq(-maxcolor,maxcolor,,9),hex(HSV(c(210,210,210,210,0,0,0,0,0),c(.7,.7,.6,.3,0,.3,.6,.7,.7),c(.3,.65,1,1,1,1,1,.65,.3)))),
  cell_fun=\(j,i,x,y,w,h,fill)grid.text(disp[i,j],x,y,gp=gpar(fontsize=16,col=ifelse(abs(m[i,j])>=maxcolor*.5,"white","black")))
)

dev.off()
system("mogrify -gravity center -trim -border 16 -bordercolor white 1.png")
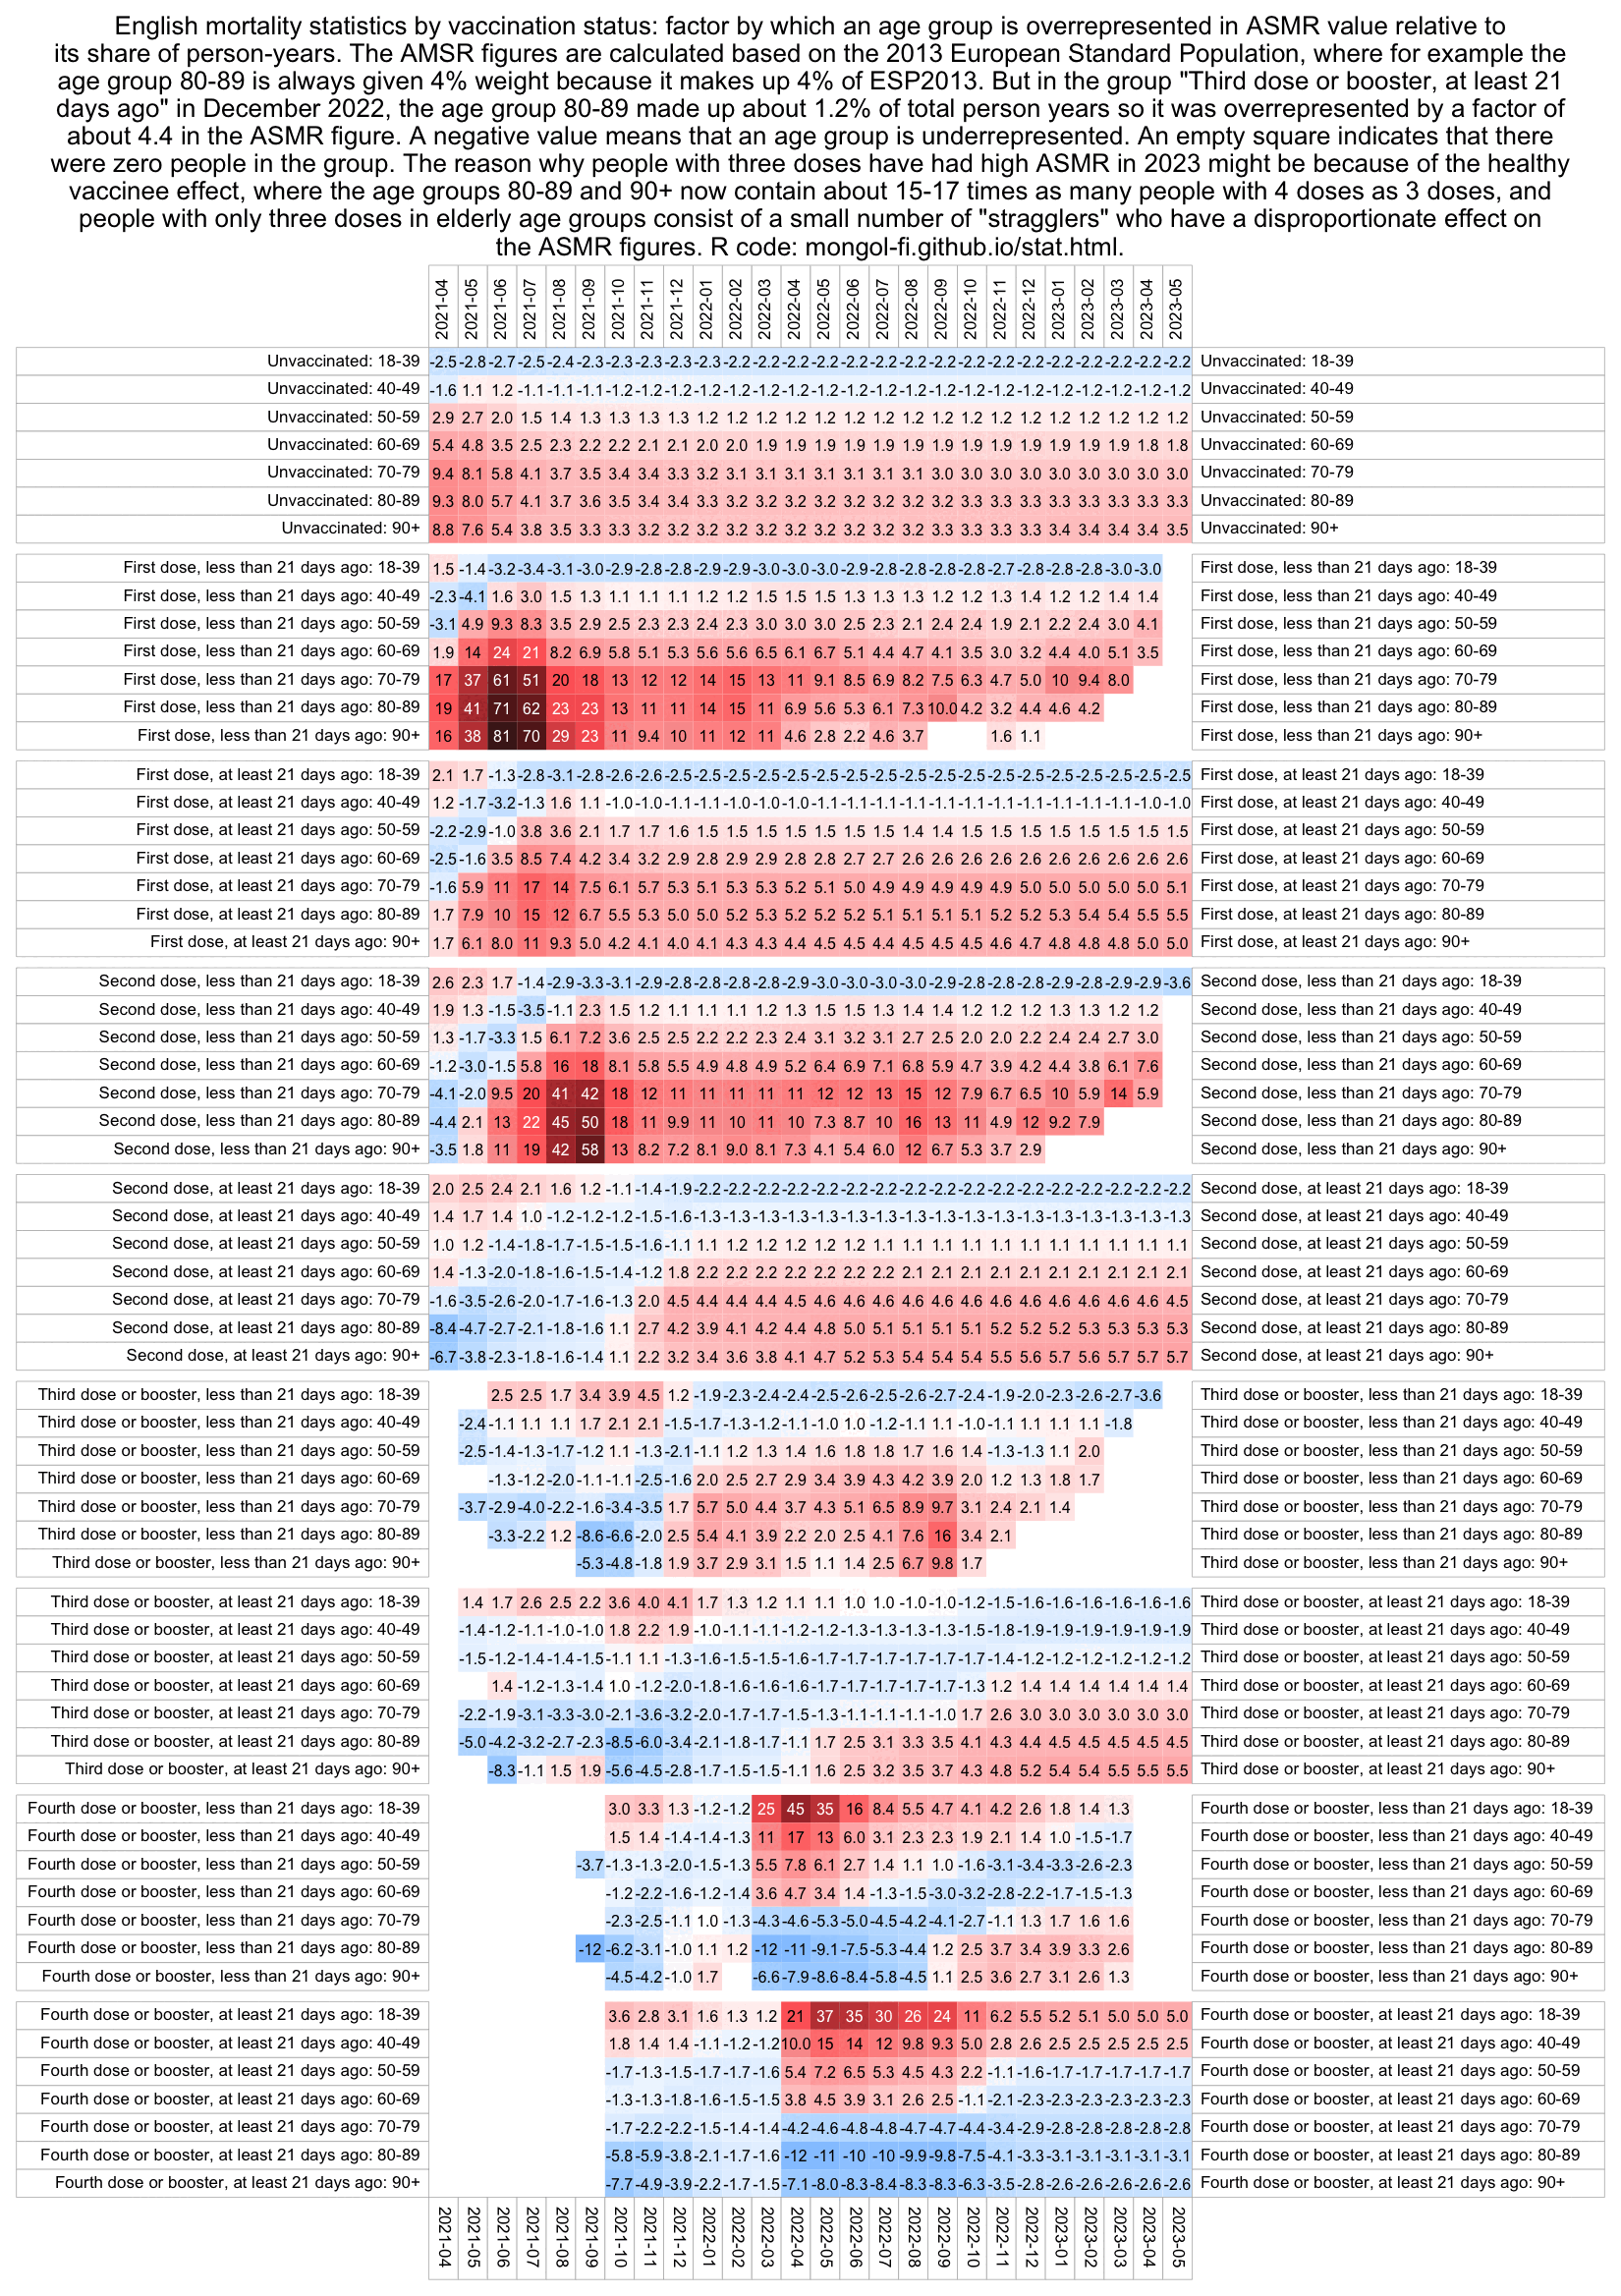
library(ggplot2);library(colorspace)

download.file("https://www.ons.gov.uk/file?uri=/peoplepopulationandcommunity/birthsdeathsandmarriages/deaths/adhocs/1343dailydeathsbydateofoccurrence1stjune2014to31stmay2023bysingleyearofageengland/dailydeaths2014to2023england.xlsx","dailydeaths2014to2023england.xlsx")

death=as.data.frame(readxl::read_excel("dailydeaths2014to2023england.xlsx",sheet=4,range="A6:CP3293"))
date=as.Date(paste0(death$Year,"-",death$Month,"-",death$Day))
death=death[,-c(1:3)]

pop=read.csv("https://sars2.net/f/englandpop.csv",row.names=1)
pop=apply(pop,2,\(x)predict(smooth.spline(data.frame(x=as.numeric(as.Date(paste0(rownames(pop),"-7-1"))),y=x)),as.numeric(date))$y)|>"rownames<-"(as.character(date))

ranges=data.frame(start=c(18,40,50,60,70,80,90))
ranges$end=c(ranges$start[-1]-1,90)

death2=apply(ranges,1,\(x)rowSums(death[,(x[1]:x[2])+1,drop=F]))
pop2=apply(ranges,1,\(x)rowSums(pop[,(x[1]:x[2])+1,drop=F]))

months=substr(date,1,7)
rowmean=\(x,y)t(sapply(split.data.frame(x,y),colMeans))
cmr=rowsum(death2,months)/rowmean(pop2,months)*365e5/lubridate::days_in_month(paste0(unique(months),"-1"))
colnames(cmr)=c(head(apply(ranges,1,paste,collapse="-"),-1),"90+")

m1=t(tail(cmr,20))

t=read.csv("https://sars2.net/f/ons-table-2-2023-august.csv",na.strings=c("x","<3"))
t=t[t$cause=="All causes",]
t2=data.frame(age=t$age,date=sprintf("%d-%02d",t$year,match(t$month,month.name)),status=t$status,pop=t$pop,cmr=t$dead/t$pop*1e5)
t2=t2[t2$date>="2021-10",]

m2=with(subset(t2,status=="Third dose or booster, at least 21 days ago"),tapply(cmr,list(age,date),c))
m3=with(subset(t2,status=="Fourth dose or booster, at least 21 days ago"),tapply(cmr,list(age,date),c))

m2=(m2/m1-1)*100
m3=(m3/m1-1)*100
disp2=round(m2)
disp3=round(m3)

maxcolor=400
pal=colorRampPalette(hex(HSV(c(210,210,210,210,0,0,0,0,0),c(1,.8,.6,.3,0,.3,.6,.8,1),c(.3,.65,1,1,1,1,1,.65,.3))))(256)

pheatmap::pheatmap(m2,filename="i2.png",display_numbers=disp2,
  cluster_rows=F,cluster_cols=F,legend=F,cellwidth=19,cellheight=19,fontsize=9,fontsize_number=8,
  border_color=NA,na_col="gray90",number_color=ifelse(abs(m2)>maxcolor*.6,"white","black"),
  breaks=seq(-maxcolor,maxcolor,,256),pal)

pheatmap::pheatmap(m3,filename="i3.png",display_numbers=disp3,
  cluster_rows=F,cluster_cols=F,legend=F,cellwidth=19,cellheight=19,fontsize=9,fontsize_number=8,
  border_color=NA,na_col="gray90",number_color=ifelse(abs(m3)>maxcolor*.6,"white","black"),
  breaks=seq(-maxcolor,maxcolor,,256),pal)

system("w=`identify -format %w i2.png`;convert i2.png -gravity northwest \\( -splice x16 -size $[w-44]x -pointsize 35 caption:'3rd dose or booster, at least 21 days ago: Excess mortality percent relative to total population of England' -extent $[w-44]x -gravity center \\) +swap -append -bordercolor white -border 6 +repage l2.png")
system("w=`identify -format %w i3.png`;convert i3.png -gravity northwest \\( -splice x16 -size $[w-44]x -pointsize 35 caption:'4th dose or booster, at least 21 days ago: Excess mortality percent relative to total population of England' -extent $[w-44]x -gravity center \\) +swap -append -bordercolor white -border 6 +repage l3.png")

system("montage -geometry +0+0 -tile 1x l[23].png 1.png")

pop2=with(subset(t2,status=="Third dose or booster, at least 21 days ago"),tapply(pop,list(age,date),c))
pop3=with(subset(t2,status=="Fourth dose or booster, at least 21 days ago"),tapply(pop,list(age,date),c))

kimi=\(x){e=floor(log10(ifelse(x==0,1,abs(x))));e2=pmax(e,0)%/%3+1;p=!is.na(x);x[p]=paste0(sprintf(paste0("%.",ifelse(e[p]%%3==0,1,0),"f"),x[p]/1e3^(e2[p]-1)),c("","k","M","B","T")[e2[p]]);x}
disp2=ifelse(pop2<10,pop2,kimi(pop2))
disp3=ifelse(pop3<10,pop3,kimi(pop3))

maxcolor=max(pop2,pop3)
pal=sapply(seq(1,0,,256),\(i)rgb(i,i,i))

pheatmap::pheatmap(pop2,filename="p2.png",display_numbers=disp2,
  cluster_rows=F,cluster_cols=F,legend=F,cellwidth=19,cellheight=19,fontsize=9,fontsize_number=8,
  border_color=NA,na_col="white",number_color=ifelse(pop2>maxcolor*.45,"white","black"),
  breaks=seq(0,maxcolor,,256),pal)

pheatmap::pheatmap(pop3,filename="p3.png",display_numbers=disp3,
  cluster_rows=F,cluster_cols=F,legend=F,cellwidth=19,cellheight=19,fontsize=9,fontsize_number=8,
  border_color=NA,na_col="white",number_color=ifelse(pop3>maxcolor*.45,"white","black"),
  breaks=seq(0,maxcolor,,256),pal)

system("w=`identify -format %w p2.png`;convert p2.png -gravity northwest \\( -splice x16 -size $[w-44]x -pointsize 35 caption:'3rd dose or booster, at least 21 days ago: Population size in person-years' -extent $[w-44]x -gravity center \\) +swap -append -bordercolor white -border 6 +repage l2.png")
system("w=`identify -format %w p3.png`;convert p3.png -gravity northwest \\( -splice x16 -size $[w-44]x -pointsize 35 caption:'4th dose or booster, at least 21 days ago: Population size in person-years' -extent $[w-44]x -gravity center \\) +swap -append -bordercolor white -border 6 +repage l3.png")
system("montage -geometry +0+0 -tile 1x l[23].png 2.png")
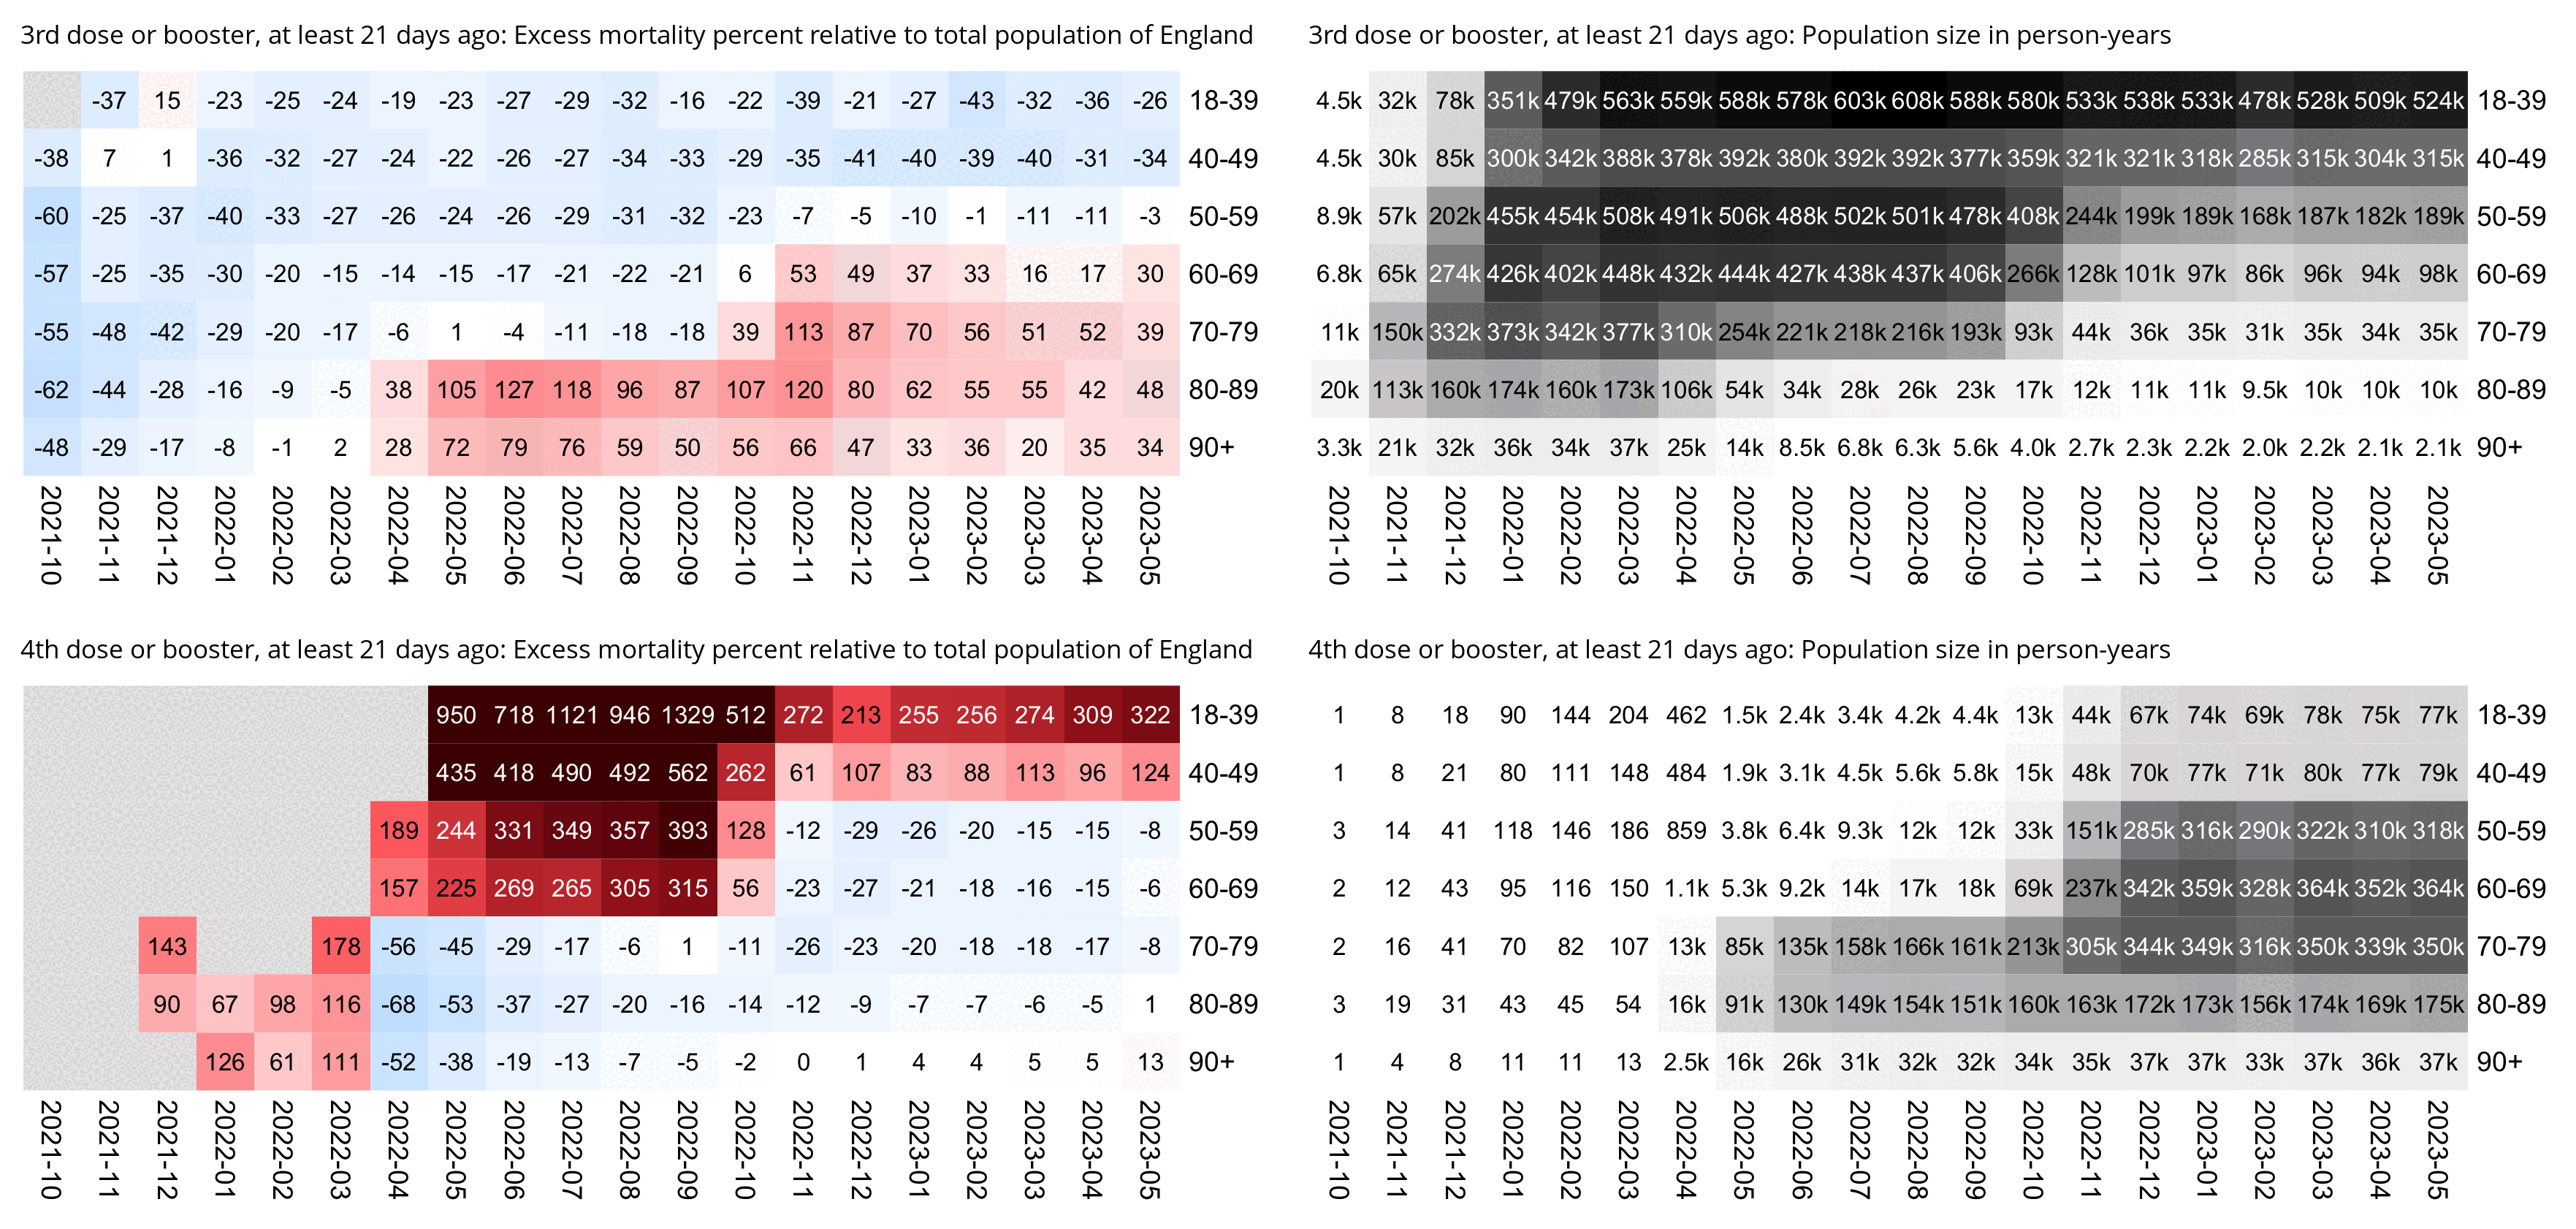
library(ggplot2);library(colorspace)

rowmean=\(x,y)t(sapply(split.data.frame(x,y),colMeans))
kimi=\(x){e=floor(log10(ifelse(x==0,1,abs(x))));e2=pmax(e,0)%/%3+1;p=!is.na(x);x[p]=paste0(sprintf(paste0("%.",ifelse(e[p]%%3==0,1,0),"f"),x[p]/1e3^(e2[p]-1)),c("","k","M","B","T")[e2[p]]);x}

download.file("https://www.ons.gov.uk/file?uri=/peoplepopulationandcommunity/birthsdeathsandmarriages/deaths/adhocs/1343dailydeathsbydateofoccurrence1stjune2014to31stmay2023bysingleyearofageengland/dailydeaths2014to2023england.xlsx","dailydeaths2014to2023england.xlsx")

dead=as.data.frame(readxl::read_excel("dailydeaths2014to2023england.xlsx",sheet=4,range="A6:CP3293"))
date=as.Date(paste0(dead$Year,"-",dead$Month,"-",dead$Day))
dead=dead[,-c(1:3)]

pop=read.csv("https://sars2.net/f/englandpop.csv",row.names=1)
pop=apply(pop,2,\(x)data.frame(x=date,y=predict(smooth.spline(data.frame(x=as.numeric(as.Date(paste0(rownames(pop),"-7-1"))),y=x)),as.numeric(date))$y))

ranges=data.frame(start=c(18,40,50,60,70,80,90))
ranges$end=c(ranges$start[-1]-1,90)

dead=apply(ranges,1,\(x)rowSums(dead[,(x[1]:x[2])+1,drop=F]))
pop=apply(ranges,1,\(x)rowSums(pop[,(x[1]:x[2])+1,drop=F]))

months=substr(date,1,7)
dead=t(rowsum(dead,months))
pop=t(rowmean(pop,months)/365*lubridate::days_in_month(paste0(unique(months),"-1")))

rownames(dead)=rownames(pop)=c(head(apply(ranges,1,paste,collapse="-"),-1),"90+")
pick=colnames(dead)>="2021-04";dead=dead[,pick];pop=pop[,pick]

pop=cbind(pop,Total=rowSums(pop));pop=rbind(pop,Total=colSums(pop))
dead=cbind(dead,Total=rowSums(dead));dead=rbind(dead,Total=colSums(dead))

m1=dead/pop*1e5

t=read.csv("https://sars2.net/f/ons-table-2-2023-august.csv",na.strings=c("x","<3"))
t=t[t$cause=="All causes",]
t2=data.frame(age=t$age,date=sprintf("%d-%02d",t$year,match(t$month,month.name)),status=ifelse(t$status=="Unvaccinated","Unvaccinated","Vaccinated"),pop=t$pop,dead=t$dead)
a=aggregate(t2[,4:5],t2[,1:3],sum,na.rm=T)

a=rbind(a,aggregate(a[,4:5],data.frame(age=a$age,date="Total",status=a$status),sum))
a=rbind(a,aggregate(a[,4:5],data.frame(age="Total",date=a$date,status=a$status),sum))

m2=with(subset(a,status=="Vaccinated"),tapply(dead/pop*1e5,list(age,date),c))
m3=with(subset(a,status=="Unvaccinated"),tapply(dead/pop*1e5,list(age,date),c))
m4=with(aggregate(a[,4:5],a[,1:2],sum),tapply(dead/pop*1e5,list(age,date),c))

r2=(m2/m1-1)*100
r3=(m3/m1-1)*100
r4=(m4/m1-1)*100

disp1=kimi(m1)
disp2=m2;disp2[!is.na(disp2)]=kimi(disp2[!is.na(disp2)])
disp3=m3;disp3[!is.na(disp3)]=kimi(disp3[!is.na(disp3)])
m1=m1^.6;m2=m2^.6;m3=m3^.6
maxcolor=max(m1,m2,m3,na.rm=T)

pal=colorRampPalette(hex(HSV(c(210,210,210,160,110,60,30,0,0,0),c(0,.25,rep(.5,8)),c(rep(1,8),.5,0))))(256)

pheatmap::pheatmap(m1,filename="i1.png",display_numbers=disp1,
  cluster_rows=F,cluster_cols=F,legend=F,cellwidth=19,cellheight=19,fontsize=9,fontsize_number=8,
  border_color=NA,na_col="gray90",
  number_color=ifelse(m1>maxcolor*.8,"white","black"),
  breaks=seq(0,maxcolor,,256),pal)

pheatmap::pheatmap(m2,filename="i2.png",display_numbers=disp2,
  cluster_rows=F,cluster_cols=F,legend=F,cellwidth=19,cellheight=19,fontsize=9,fontsize_number=8,
  border_color=NA,na_col="gray90",
  number_color=ifelse(m2>maxcolor*.8,"white","black"),
  breaks=seq(0,maxcolor,,256),pal)

pheatmap::pheatmap(m3,filename="i3.png",display_numbers=disp3,
  cluster_rows=F,cluster_cols=F,legend=F,cellwidth=19,cellheight=19,fontsize=9,fontsize_number=8,
  border_color=NA,na_col="gray90",
  number_color=ifelse(m3>maxcolor*.8,"white","black"),
  breaks=seq(0,maxcolor,,256),pal)

system("w=`identify -format %w i1.png`;convert i1.png -gravity northwest \\( -splice x16 -size $[w-44]x -pointsize 38 caption:'General population of England: Deaths per 100k person-years' -extent $[w-44]x -gravity center \\) +swap -append l1.png")
system("w=`identify -format %w i2.png`;convert i2.png -gravity northwest \\( -splice x16 -size $[w-44]x -pointsize 38 caption:'Vaccinated: Deaths per 100k person-years' -extent $[w-44]x -gravity center \\) +swap -append l2.png")
system("w=`identify -format %w i3.png`;convert i3.png -gravity northwest \\( -splice x16 -size $[w-44]x -pointsize 38 caption:'Unvaccinated: Deaths per 100k person-years' -extent $[w-44]x -gravity center \\) +swap -append l3.png")

# r2=rbind(r2,Weighted=colSums(head(t(t(r2*pop2)/colSums(pop2)),-1)))
# r3=rbind(r3,Weighted=colSums(head(t(t(r3*pop3)/colSums(pop3)),-1)))

disp2=round(r2)
disp3=round(r3)
disp4=round(r4)

maxcolor=max(r2,r3)
pal=colorRampPalette(hex(HSV(c(210,210,210,210,0,0,0,0,0),c(1,.8,.6,.3,0,.3,.6,.8,1),c(.3,.65,1,1,1,1,1,.65,.3))))(256)

pheatmap::pheatmap(r2,filename="r2.png",display_numbers=disp2,
  cluster_rows=F,cluster_cols=F,legend=F,cellwidth=19,cellheight=19,fontsize=9,fontsize_number=8,
  border_color=NA,na_col="gray90",number_color=ifelse(abs(r2)>maxcolor*.6,"white","black"),
  breaks=seq(-maxcolor,maxcolor,,256),pal)

pheatmap::pheatmap(r3,filename="r3.png",display_numbers=disp3,
  cluster_rows=F,cluster_cols=F,legend=F,cellwidth=19,cellheight=19,fontsize=9,fontsize_number=8,
  border_color=NA,na_col="gray90",number_color=ifelse(abs(r3)>maxcolor*.6,"white","black"),
  breaks=seq(-maxcolor,maxcolor,,256),pal)

pheatmap::pheatmap(r4,filename="r4.png",display_numbers=disp4,
  cluster_rows=F,cluster_cols=F,legend=F,cellwidth=19,cellheight=19,fontsize=9,fontsize_number=8,
  border_color=NA,na_col="gray90",number_color=ifelse(abs(r4)>maxcolor*.6,"white","black"),
  breaks=seq(-maxcolor,maxcolor,,256),pal)

system("w=`identify -format %w r4.png`;convert r4.png -gravity northwest \\( -splice x16 -size $[w-44]x -pointsize 38 caption:'Unvaccinated + vaccinated: Deaths per 100k person-years' -extent $[w-44]x -gravity center \\) +swap -append rl4.png")

system("w=`identify -format %w r2.png`;convert r2.png -gravity northwest \\( -splice x16 -size $[w-44]x -pointsize 35 caption:'Vaccinated: Excess mortality percent relative to general population of England' -extent $[w-44]x -gravity center \\) +swap -append rl2.png")
system("w=`identify -format %w r3.png`;convert r3.png -gravity northwest \\( -splice x16 -size $[w-44]x -pointsize 35 caption:'Unvaccinated: Excess mortality percent relative to general population of England' -extent $[w-44]x -gravity center \\) +swap -append rl3.png")

pop2=with(subset(a,status=="Vaccinated"),tapply(pop,list(age,date),c))
pop3=with(subset(a,status=="Unvaccinated"),tapply(pop,list(age,date),c))

disp2=ifelse(pop2<10,pop2,kimi(pop2))
disp3=ifelse(pop3<10,pop3,kimi(pop3))
maxcolor=1e6
pal=sapply(seq(1,0,,256),\(i)rgb(i,i,i))

pheatmap::pheatmap(pop2,filename="p2.png",display_numbers=disp2,
  cluster_rows=F,cluster_cols=F,legend=F,cellwidth=19,cellheight=19,fontsize=9,fontsize_number=8,
  border_color=NA,na_col="white",number_color=ifelse(pop2>maxcolor*.45,"white","black"),
  breaks=seq(0,maxcolor,,256),pal)

pheatmap::pheatmap(pop3,filename="p3.png",display_numbers=disp3,
  cluster_rows=F,cluster_cols=F,legend=F,cellwidth=19,cellheight=19,fontsize=9,fontsize_number=8,
  border_color=NA,na_col="white",number_color=ifelse(pop3>maxcolor*.45,"white","black"),
  breaks=seq(0,maxcolor,,256),pal)

system("w=`identify -format %w p2.png`;convert p2.png -gravity northwest \\( -splice x16 -size $[w-44]x -pointsize 35 caption:'Vaccinated: Population size in person-years' -extent $[w-44]x -gravity center \\) +swap -append pl2.png")
system("w=`identify -format %w p3.png`;convert p3.png -gravity northwest \\( -splice x16 -size $[w-44]x -pointsize 35 caption:'Unvaccinated: Population size in person-years' -extent $[w-44]x -gravity center \\) +swap -append pl3.png")

system("montage -geometry +0+0 -tile 2x l[23].png m1.png")
system("montage -geometry +0+0 -tile 2x {rl2,rl3,pl2,pl3}.png m2.png")
system("montage -geometry +0+0 -gravity west -tile 1x l1.png m[12].png 1.png;mogrify -bordercolor white -border 10 1.png")
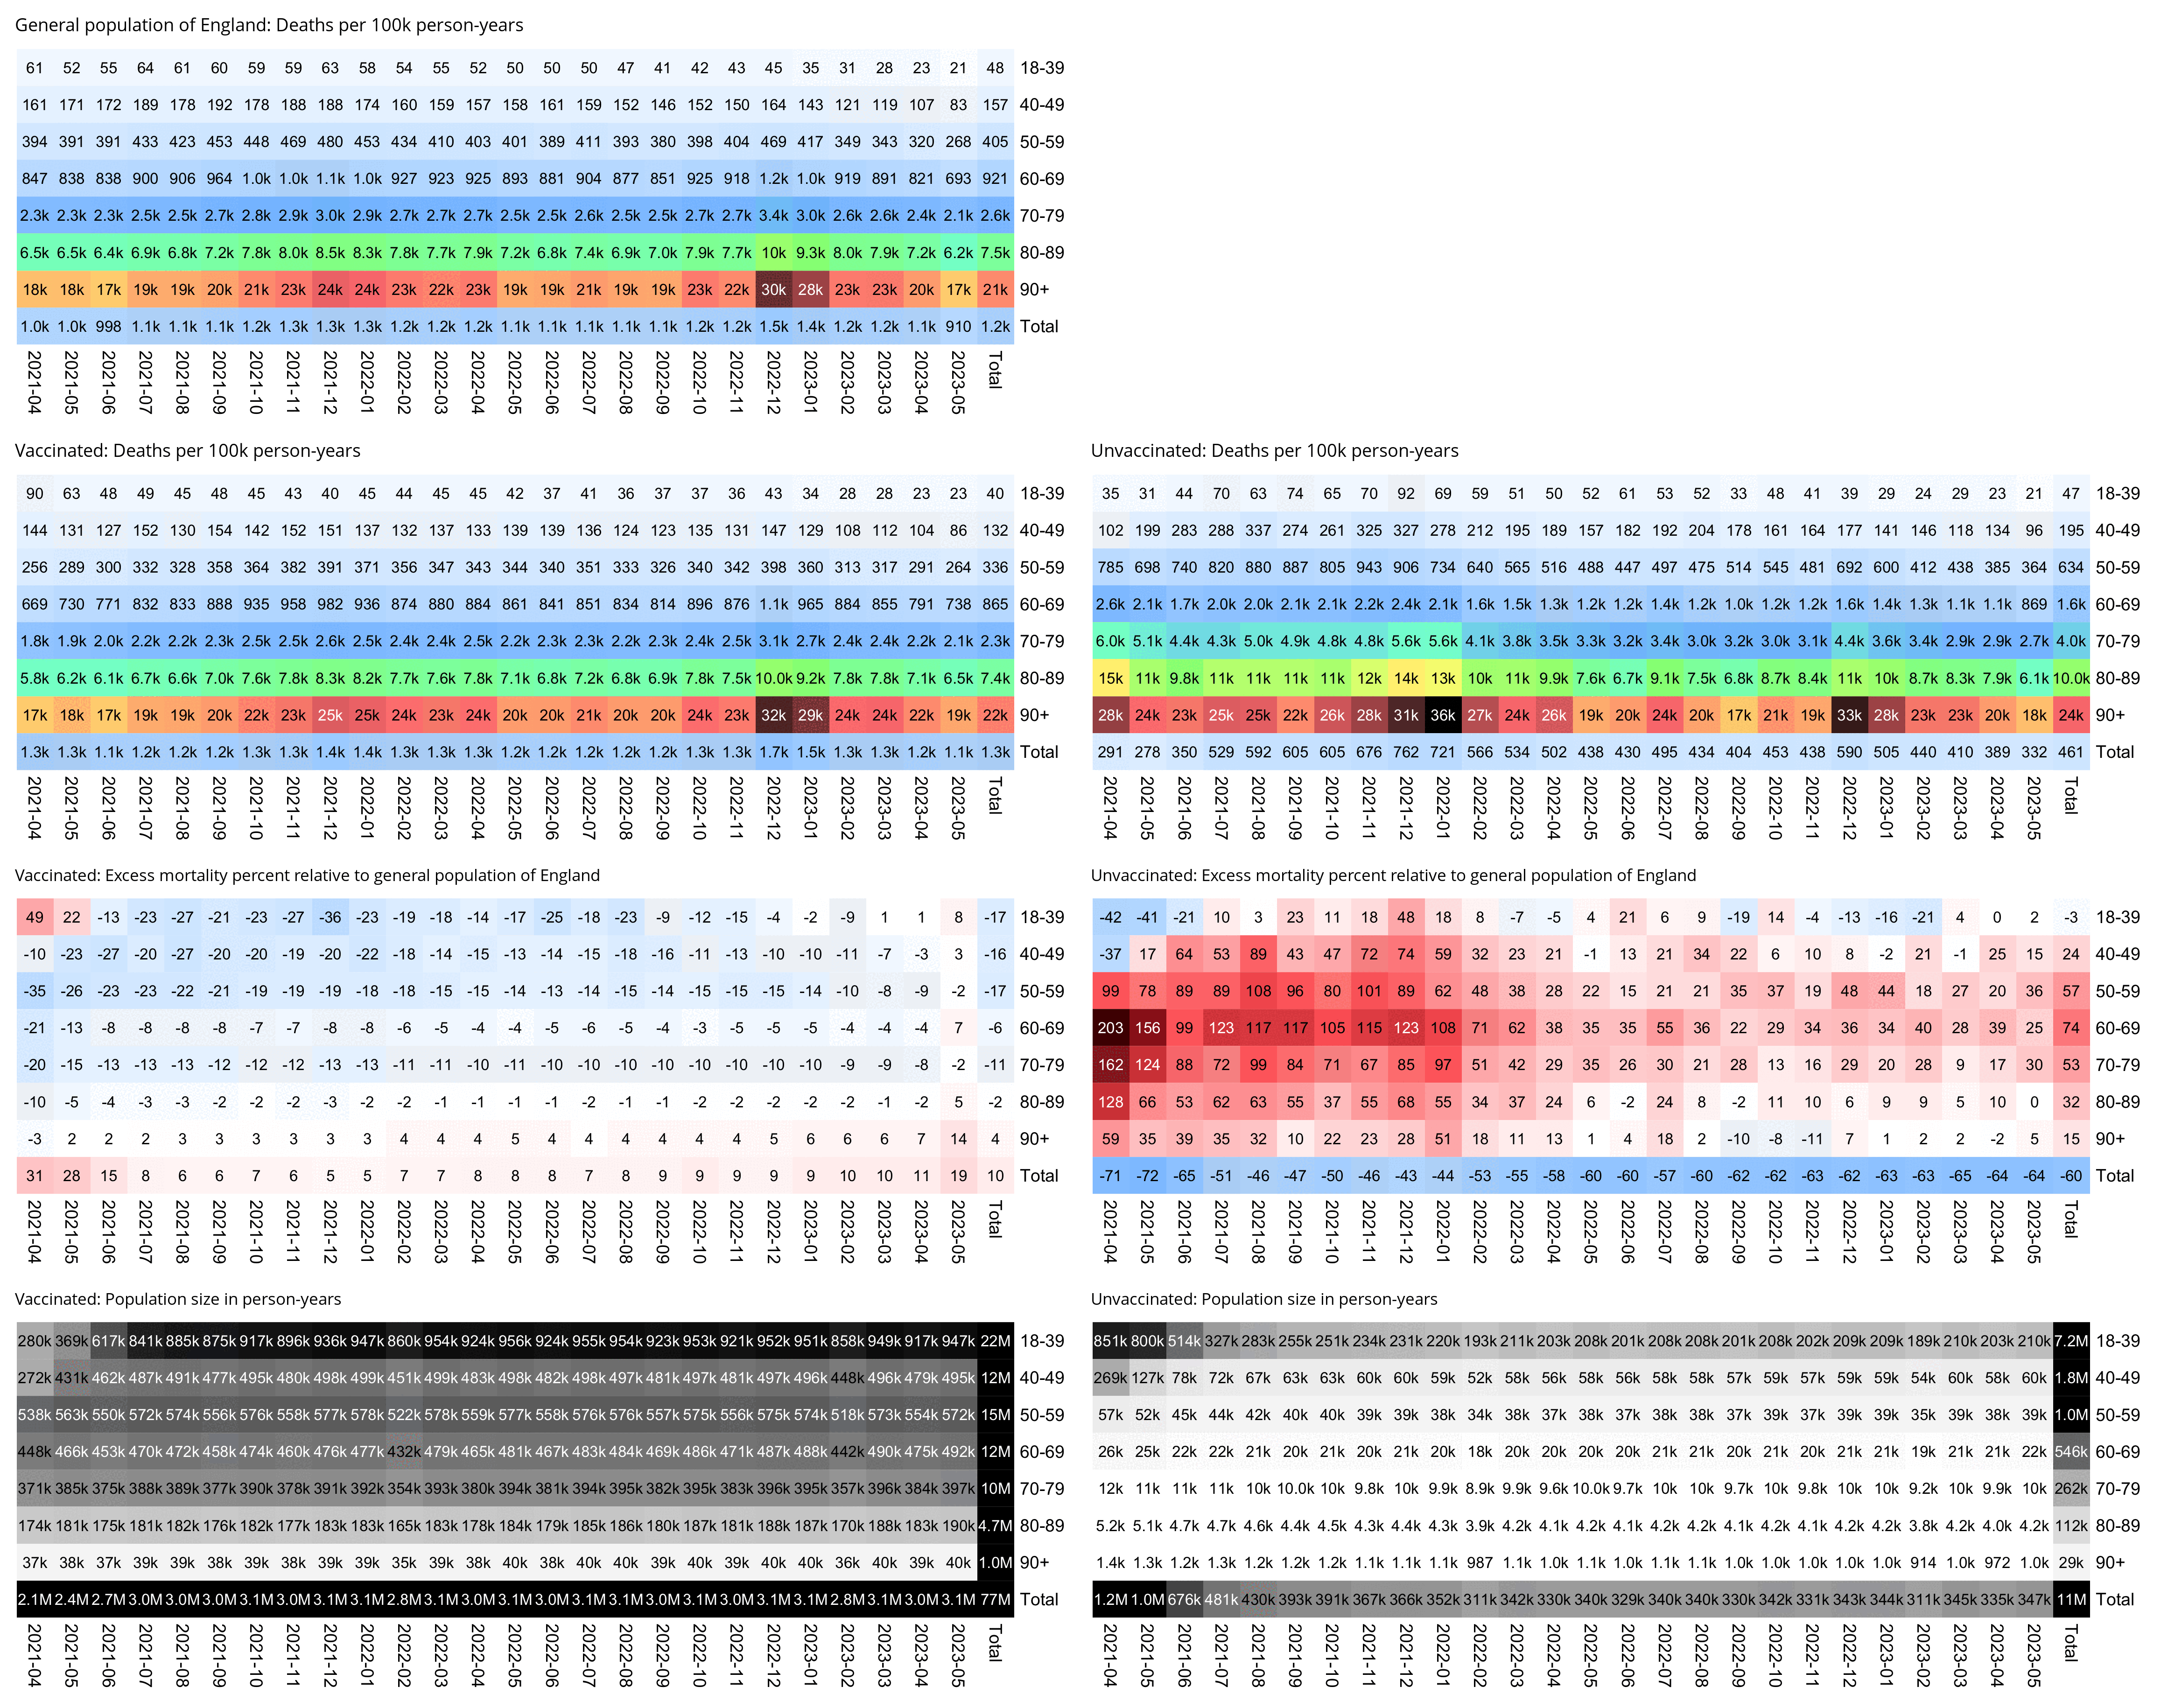
library(ggplot2);library(colorspace)

rowmean=\(x,y)t(sapply(split.data.frame(x,y),colMeans))
kimi=\(x){e=floor(log10(ifelse(x==0,1,abs(x))));e2=pmax(e,0)%/%3+1;p=!is.na(x);x[p]=paste0(sprintf(paste0("%.",ifelse(e[p]%%3==0,1,0),"f"),x[p]/1e3^(e2[p]-1)),c("","k","M","B","T")[e2[p]]);x}

# download.file("https://www.ons.gov.uk/file?uri=/peoplepopulationandcommunity/birthsdeathsandmarriages/deaths/adhocs/1343dailydeathsbydateofoccurrence1stjune2014to31stmay2023bysingleyearofageengland/dailydeaths2014to2023england.xlsx","dailydeaths2014to2023england.xlsx")

dead=as.data.frame(readxl::read_excel("dailydeaths2014to2023england.xlsx",sheet=4,range="A6:CP3293"))
date=as.Date(paste0(dead$Year,"-",dead$Month,"-",dead$Day))
dead=dead[,-c(1:3)]

pop=read.csv("https://sars2.net/f/englandpop.csv",row.names=1)
pop=apply(pop,2,\(x)predict(smooth.spline(data.frame(x=as.numeric(as.Date(paste0(rownames(pop),"-7-1"))),y=x)),as.numeric(date))$y)|>"rownames<-"(as.character(date))

ranges=data.frame(start=c(18,40,50,60,70,80,90))
ranges$end=c(ranges$start[-1]-1,90)

dead=apply(ranges,1,\(x)rowSums(dead[,(x[1]:x[2])+1,drop=F]))
pop=apply(ranges,1,\(x)rowSums(pop[,(x[1]:x[2])+1,drop=F]))

months=substr(date,1,7)
dead=t(rowsum(dead,months))
pop=t(rowmean(pop,months)/365*lubridate::days_in_month(paste0(unique(months),"-1")))

rownames(dead)=rownames(pop)=c(head(apply(ranges,1,paste,collapse="-"),-1),"90+")
pick=colnames(dead)>="2021-04";dead=dead[,pick];pop=pop[,pick]

pop=cbind(pop,Total=rowSums(pop));pop=rbind(pop,Total=colSums(pop))
dead=cbind(dead,Total=rowSums(dead));dead=rbind(dead,Total=colSums(dead))

m1=dead/pop*1e5

t=read.csv("https://sars2.net/f/ons-table-2-2023-august.csv",na.strings=c("x","<3"))|>subset(cause=="All causes")

t2=data.frame(age=t$age,date=sprintf("%d-%02d",t$year,match(t$month,month.name)),status=sub("dose.*","dose",t$status),pop=t$pop,dead=t$dead)
a=aggregate(t2[,4:5],t2[,1:3],sum,na.rm=T)

a2=a[a$status!="Unvaccinated",]
a=rbind(a,aggregate(a2[,4:5],cbind(a2[,1:2],status="Ever vaccinated"),sum,na.rm=T))
a$status=factor(a$status,c("Ever vaccinated",unique(status)))

a=rbind(a,aggregate(a[,4:5],cbind(age="Total",a[,2:3]),sum))
a=rbind(a,aggregate(a[,4:5],cbind(date="Total",a[,c(1,3)]),sum))

a$cmr=a$dead/a$pop*1e5
a$date=factor(a$date,unique(a$date))

excess=lapply(split(a,a$status),\(x)(tapply(x$cmr,list(x$age,x$date),c)))
pop=lapply(split(a,a$status),\(x)tapply(x$pop,list(x$age,x$date),c))

max1=900;max2=1e6;exp1=.6;exp2=.7

pal1=colorRampPalette(hex(HSV(c(210,210,210,210,0,0,0,0,0),c(1,.8,.6,.3,0,.3,.6,.8,1),c(.3,.65,1,1,1,1,1,.65,.3))))(256)
pal2=sapply(seq(1,0,,256),\(i)rgb(i,i,i))

for(i in 1:length(excess)){
  m=excess[[i]]
  ex=(m/m1-1)*100
  mpop=pop[[i]]
  disp=round(rbind(ex[-nrow(ex),],colSums(ex[-nrow(ex),]*mpop[-nrow(mpop),])/colSums(mpop[-nrow(mpop),])))
  rat=(m-m1)/ifelse(m>m1,m1,m)*100
  rat[is.infinite(rat)]=-max1

  rat0=rat[-nrow(rat),-ncol(rat)]
  pop0=mpop[-nrow(mpop),-ncol(mpop)]

  rat=rbind(head(rat,-1),Weighted=colSums(head(rat,-1)*head(mpop,-1))/colSums(head(mpop,-1)))

  rat[nrow(rat),ncol(rat)]=sum(rat0*pop0,na.rm=T)/sum(pop0)
  ex[nrow(ex),ncol(ex)]=sum(ex[-nrow(ex),-ncol(ex)]*pop0,na.rm=T)/sum(pop0)

  pheatmap::pheatmap(sign(rat)*abs(rat)^exp1,filename=paste0("e",i,".png"),display_numbers=disp,
    cluster_rows=F,cluster_cols=F,legend=F,cellwidth=19,cellheight=19,fontsize=9,fontsize_number=7.8,
    border_color=NA,na_col="gray90",number_color=ifelse(abs(rat)^exp1>max1^exp1*.53,"white","black"),
    breaks=seq(-max1^exp1,max1^exp1,,256),pal1)

  m=pop[[i]]
  pheatmap::pheatmap(m^exp2,filename=paste0("p",i,".png"),display_numbers=ifelse(m<10,m,kimi(m)),
    cluster_rows=F,cluster_cols=F,legend=F,cellwidth=19,cellheight=19,fontsize=9,fontsize_number=7.8,
    border_color=NA,na_col="gray90",number_color=ifelse(m^exp2>max2^exp2*.42,"white","black"),
    breaks=seq(0,max2^exp2,,256),pal2)

  system(paste0("w=`identify -format %w e",i,".png`;convert e",i,".png -gravity northwest \\( -splice x16 -size $[w-44]x -pointsize 40 caption:'",names(excess)[i],": Excess mortality percent relative to general population of England' -extent $[w-44]x -gravity center \\) +swap -append -bordercolor white -border 6 +repage e",i,"..png"))
  system(paste0("w=`identify -format %w p",i,".png`;convert p",i,".png -gravity northwest \\( -splice x16 -size $[w-44]x -pointsize 40 caption:'",names(excess)[i],": Population size in person-years' -extent $[w-44]x -gravity center \\) +swap -append -bordercolor white -border 6 +repage p",i,"..png"))
}

system("montage -geometry +0+0 -tile 2x {e1,p1,e2,p2,e3,p3,e4,p4,e5,p5,e6,p6}..png 1.png")
This script combines the categories for people who were vaccinated within 3 weeks or more than 3 weeks ago into a single category, which is possible because it uses CMR and not ASMR.
The "Weighted" row shows the weighted average of the excess mortality percent of the age groups where the weight is the number of person-years in each age group.
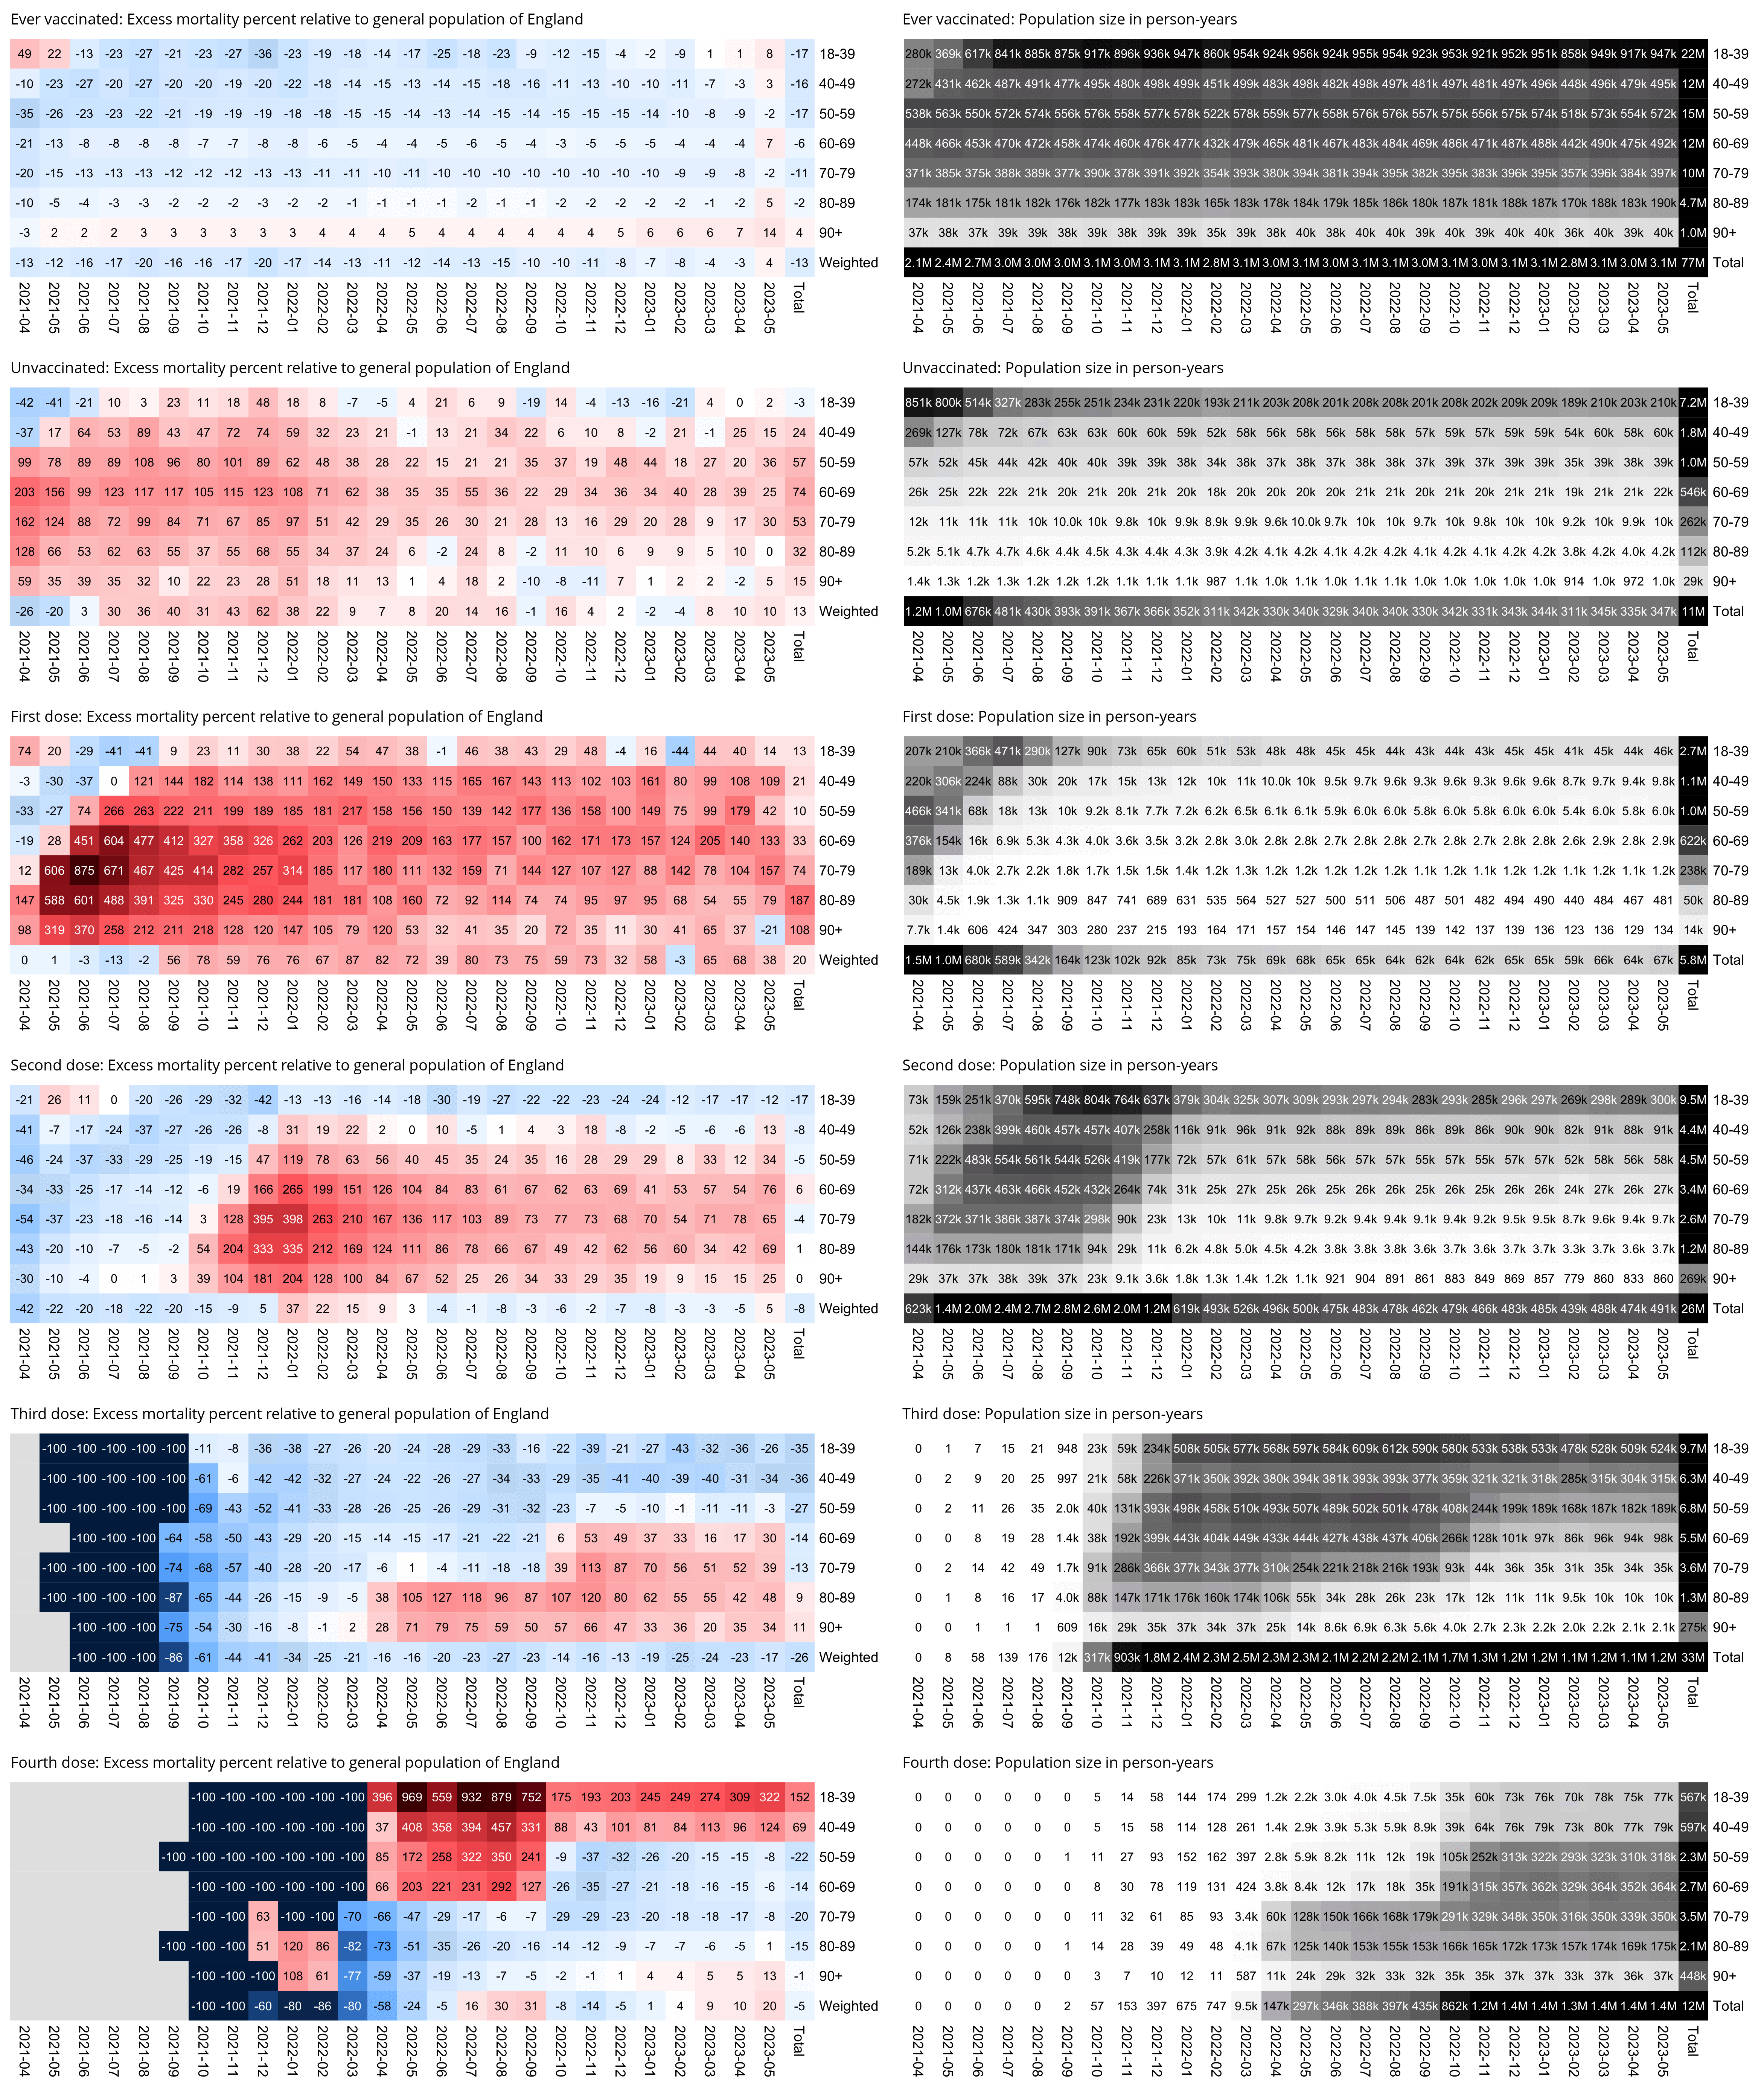

library(ggplot2)

cutl=\(x,y)cut(x,c(y,Inf),y,T,F)
rowmean=\(x,y)t(sapply(split.data.frame(x,y),colMeans))
kim=\(x)ifelse(x>=1e3,ifelse(x>=1e6,paste0(x/1e6,"M"),paste0(x/1e3,"k")),x)

# download.file("https://www.ons.gov.uk/file?uri=/peoplepopulationandcommunity/birthsdeathsandmarriages/deaths/adhocs/1343dailydeathsbydateofoccurrence1stjune2014to31stmay2023bysingleyearofageengland/dailydeaths2014to2023england.xlsx","dailydeaths2014to2023england.xlsx")

dead=as.data.frame(readxl::read_excel("dailydeaths2014to2023england.xlsx",sheet=4,range="A6:CP3293"))
date=as.Date(paste0(dead$Year,"-",dead$Month,"-",dead$Day))
dead=dead[,-c(1:3)]

pop=read.csv("http://sars2.net/f/englandpop.csv",row.names=1)
pop=apply(pop,2,\(x)predict(smooth.spline(data.frame(x=as.numeric(as.Date(paste0(rownames(pop),"-7-1"))),y=x)),as.numeric(date))$y)

months=substr(date,1,7)
ages=c(0,18,seq(40,90,10))
dead=t(rowsum(t(rowsum(dead,months)),cutl(0:90,ages)))
pop=t(rowmean(pop,months)/365*lubridate::days_in_month(paste0(unique(months),"-1")))|>rowsum(cutl(0:90,ages))|>t()

colnames(dead)=colnames(pop)=c(paste0(head(ages,-1),"-",ages[-1]-1),"90+")
pick=rownames(dead)>="2020-01";dead=dead[pick,-1];pop=pop[pick,-1]

for(age in colnames(dead)){

t=read.csv("http://sars2.net/f/ons-table-2-2023-august.csv",na.strings=c("x","<3"))
t=t[t$cause=="All causes"&t$age==age,]

t0=read.csv("http://sars2.net/f/ons-table-2-2022-july.csv",na.strings=c("x","<3"))|>subset(cause=="All causes")
t0=t0[t0$age==age,]
t=rbind(subset(t0,year==2021&month%in%month.name[1:3]),t)

date=as.Date(paste0(t$year,"-",match(t$month,month.name),"-1"))

a=aggregate(t[,6:7],list(status=sub(" dose.*"," dose",t$status),date=date),sum,na.rm=T)
a2=a[a$status!="Unvaccinated",]
a3=aggregate(a[,3:4],data.frame(status="ONS data total",date=a$date),sum)
a=rbind(a,a3,aggregate(a2[,3:4],data.frame(status="Vaccinated",date=a2$date),sum))

a=rbind(a,data.frame(status="England total",date=as.Date(paste0(rownames(dead),"-1")),dead=dead[,age],pop=pop[,age]))

label=c("England total","ONS data total","Vaccinated","Unvaccinated","First dose","Second dose","Third dose","Fourth dose")
a$status=factor(a$status,label)

a$cmr=a$dead/a$pop*1e5

a$frac=a$pop/with(subset(a,!a$status%in%label[1:3]),tapply(pop,date,sum))[as.character(a$date)]
a$frac[a$status%in%label[1:3]]=0

ystart=0;xstart=min(a$date);xend=max(a$date)
cand=c(sapply(c(1,2,5),\(x)x*10^c(-10:10)))
ymax=max(a$cmr,na.rm=T)
ystep=cand[which.min(abs(cand-ymax/5))]
yend=ystep*ceiling(ymax/ystep)
ybreak=seq(0,yend,ystep)

color=c("gray30","gray70","black",hcl(c(210,120,60,0,300)+15,100,60))
title=paste0("Ages ",age)

ggplot(a,aes(x=date,y=cmr))+
geom_area(aes(y=frac*yend*.9999,fill=status,color=status),linewidth=.1,show.legend=F,alpha=.3)+
geom_hline(yintercept=c(ystart,yend),linewidth=.3,lineend="square")+
geom_vline(xintercept=c(xstart,xend),linewidth=.3,lineend="square")+
geom_line(aes(color=status,linetype=status),linewidth=.3)+
geom_point(aes(color=status),data=subset(a,status!="General population of England"),size=.6,show.legend=F)+
scale_x_date(breaks=seq(xstart,xend,"2 month"),date_labels="%b\n%y")+
scale_y_continuous(limits=c(ystart,yend),breaks=c(0,ybreak),labels=c("1.5k",kim(ybreak)),sec.axis=sec_axis(trans=~./yend*100))+
coord_cartesian(clip="off",expand=F)+
labs(x=NULL,y=NULL,color=title,linetype=title)+
scale_color_manual(values=color)+
scale_fill_manual(values=color)+
scale_linetype_manual(values=c(2,rep(1,7)))+
guides(color=guide_legend(ncol=1))+
guides(colour=guide_legend(override.aes=list(linewidth=.4)))+
theme(axis.text=element_text(size=6,color="black"),
  axis.text.y.left=element_text(color=alpha("black",c(0,rep(1,length(ybreak))))),
  axis.ticks=element_line(linewidth=.3),
  axis.ticks.length=unit(.2,"lines"),
  axis.title=element_text(size=7.5),
  legend.background=element_blank(),
  legend.box.just="center",
  legend.direction="vertical",
  legend.key=element_rect(fill=alpha("white",0)),
  legend.spacing.x=unit(.15,"lines"),
  legend.key.size=unit(.68,"lines"),
  legend.key.width=unit(0.89,"lines"),
  legend.box.background=element_rect(fill=alpha("white",.7),color="black",linewidth=.3),
  legend.margin=margin(.4,.3,.2,.3,"lines"),
  legend.position=c(0,1),
  legend.justification=c(0,1),
  legend.text=element_text(size=6.3,vjust=.5),
  legend.title=element_text(size=8.3),
  panel.background=element_rect(fill="white"),
  panel.grid=element_blank(),
  plot.margin=margin(.2,.1,0,.1,"lines"),
  plot.subtitle=element_text(size=6,margin=margin(0,0,.6,0,"lines")),
  plot.title=element_text(size=9,margin=margin(.1,0,.4,0,"lines")))
ggsave(paste0("age.",age,".png"),width=4.8,height=2.5,dpi=400)

}

tit="ONS dataset for mortality by vaccination status: Deaths per 100k person-years"
sub="The right axis displays the percentage of each vaccination status group.
      The line labeled \"England total\" shows the general population of England which includes people who are not included in the ONS dataset. The line labeled \"ONS data total\" consists of vaccinated and unvaccinated people in the ONS dataset added together.
      People are counted as vaccinated from the day of vaccination and not with a delay of 1-4 weeks. The group labeled \"First dose\" is a sum of the groups in the ONS data labeled \"First dose, less than 21 days ago\" and \"First dose, at least 21 days ago\", and similarly for other doses.
      The ONS dataset for mortality by vaccination status was released in August 2023, and the dataset for deaths in the general English population was released in July 2023, so both datasets are missing a fairly large number of deaths because of a registration delay.
      Data for January-March 2021 is taken from the July 2022 edition of the ONS dataset, which was linked to the 2011 census and not the 2021 census like the subsequent editions.
      Sources: ons.gov.uk/peoplepopulationandcommunity/birthsdeathsandmarriages/deaths/datasets/
deathsbyvaccinationstatusengland, ons.gov.uk/peoplepopulationandcommunity/birthsdeathsandmarriages/
deaths/adhocs/1343dailydeathsbydateofoccurrence1stjune2014to31stmay2023bysingleyearofageengland,
ons.gov.uk/peoplepopulationandcommunity/populationandmigration/populationestimates/datasets/
populationestimatesforukenglandandwalesscotlandandnorthernireland."

system(paste0("wh=$(identify -format %w\\ %h age.18-39.png|awk '{print$1,$2}');convert -font '/Library/Fonts/Arial Unicode.ttf' -interline-spacing -5 -gravity west -size $(awk '{print ($1-80)\"x\"}'<<<\"$wh\") \\( -pointsize 50 -bordercolor white -border 44 caption:'",tit,"' \\) -gravity southwest -shave x40 \\( -pointsize 38 -border 40 caption:'",sub,"' -gravity northwest -shave x48 \\) -append -gravity west -extent $(tr \\  x<<<\"$wh\") 0.png"))
system("montage -geometry +0+0 -tile 2x age.* 0.png 1.png;mogrify -trim -bordercolor white -border 30 1.png")
system("qlmanage -p 1.png&>/dev/null")
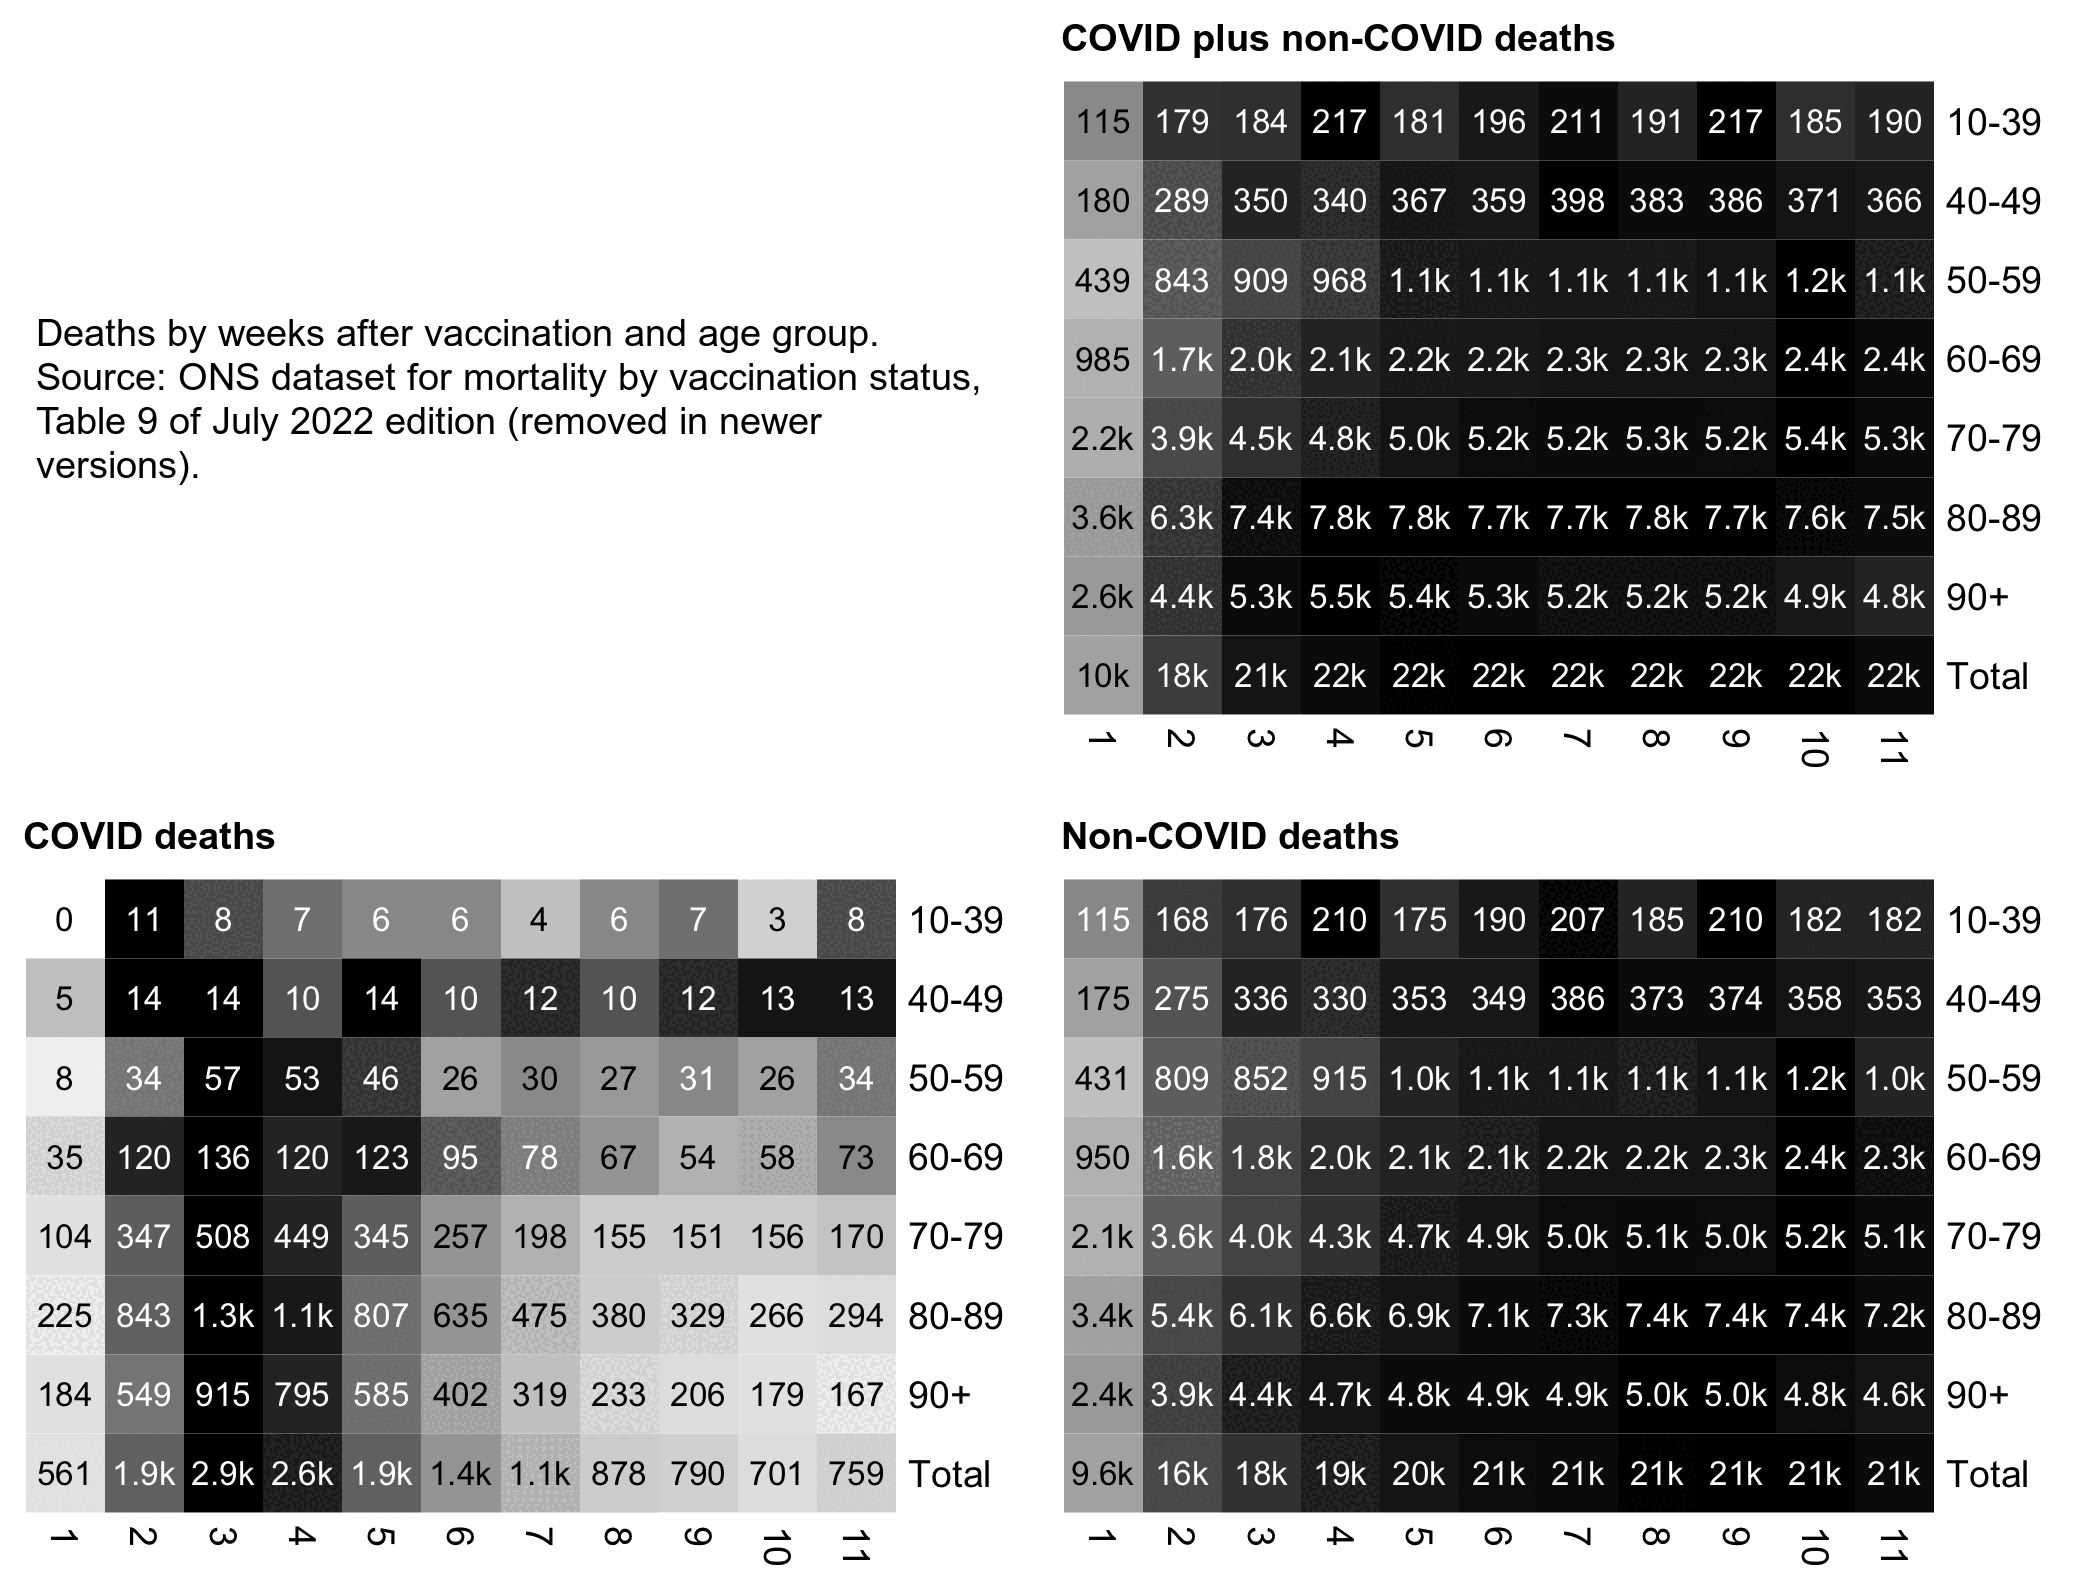
In old versions of the ONS spreadsheet for mortality by vaccination status up to the version published in July 2022, they included a table which showed the number of COVID and non-COVID deaths by weeks after vaccination. [https://www.ons.gov.uk/peoplepopulationandcommunity/birthsdeathsandmarriages/deaths/datasets/deathsbyvaccinationstatusengland, Table 9]
library(colorspace)

kimi=\(x){e=floor(log10(ifelse(x==0,1,abs(x))));e2=pmax(e,0)%/%3+1;p=!is.na(x);x[p]=paste0(sprintf(paste0("%.",ifelse(e[p]%%3==0,1,0),"f"),x[p]/1e3^(e2[p]-1)),c("","k","M","B","T")[e2[p]]);x}

t=read.csv("http://sars2.net/f/ons-table-9-deaths-by-weeks-after-vaccination.csv",na.strings="<3")
t=t[t$week!="12+",]
t$week=as.numeric(t$week)

m1=xtabs(rowSums(t[,3:4],na.rm=T)~age+week,t)
m2=xtabs(covid~age+week,t)
m3=xtabs(noncovid~age+week,t)
l=list(m1,m2,m3)

pal=sapply(seq(1,0,,256),\(i)rgb(i,i,i))
exp=1.5

for(i in 1:3){
  m=l[[i]]
  m=rbind(m,Total=colSums(m))
  disp=ifelse(m<10,m,kimi(m))
  m=m/apply(m,1,max)

  pheatmap::pheatmap(m^exp,filename=paste0("i",i,".png"),display_numbers=disp,
    cluster_rows=F,cluster_cols=F,legend=F,cellwidth=19,cellheight=19,fontsize=9,fontsize_number=8,
    border_color=NA,na_col="gray90",number_color=ifelse(m^exp>1^exp*.4,"white","black"),
    breaks=seq(0,1^exp,,256),pal)

  system(paste0("w=`identify -format %w i",i,".png`;convert i",i,".png -font Arial-Bold -gravity northwest \\( -splice x16 -size $[w-44]x -pointsize 38 caption:'",c("COVID plus non-COVID","COVID","Non-COVID")[i]," deaths' -extent $[w-44]x -gravity center \\) +swap -append +repage l",i,".png"))
}

system(paste0("wh=$(identify -format %w\\ %h l1.png);convert -gravity west -size $(awk '{print ($1-80)\"x\"}'<<<\"$wh\") -pointsize 38 -font Arial -bordercolor white -border 36 caption:'Deaths by weeks after vaccination and age group. Source: ONS dataset for mortality by vaccination status, Table 9 of July 2022 edition (removed in newer versions).' -append -extent $(tr \\  x<<<\"$wh\") l0.png"))
system("montage -geometry +0+0 -tile 2x l[0-3].png 1.png")
For some reason there was a huge number of COVID deaths on the third and fourth weeks from vaccination, so in some age groups there were more than 5 times as many COVID deaths on the 3rd weeks from vaccination as 10 weeks from vaccination. It might be because the first two doses were rolled out at the tail end of a COVID wave, and the first booster was rolled out before a short-lasting spike in COVID cases caused by Omicron, or if could also be that the vaccine still offered limited protection on the third week from vaccination.
At first I wasn't sure if the ONS table only included the first dose or all doses, but the title of table 9 also indicates that it includes "all registered deaths": "Whole period counts of all registered deaths grouped by how many weeks after vaccination the deaths occurred; for deaths involving COVID-19 and deaths not involving COVID-19, deaths occurring between 1 January 2021 and 31 March 2022, England". Table 9 includes a total of 606,534 deaths, which almost matches the total number of ever-vaccinated deaths in Table 1 (570,872). But I don't know why Table 9 includes slightly more deaths than Table 1.
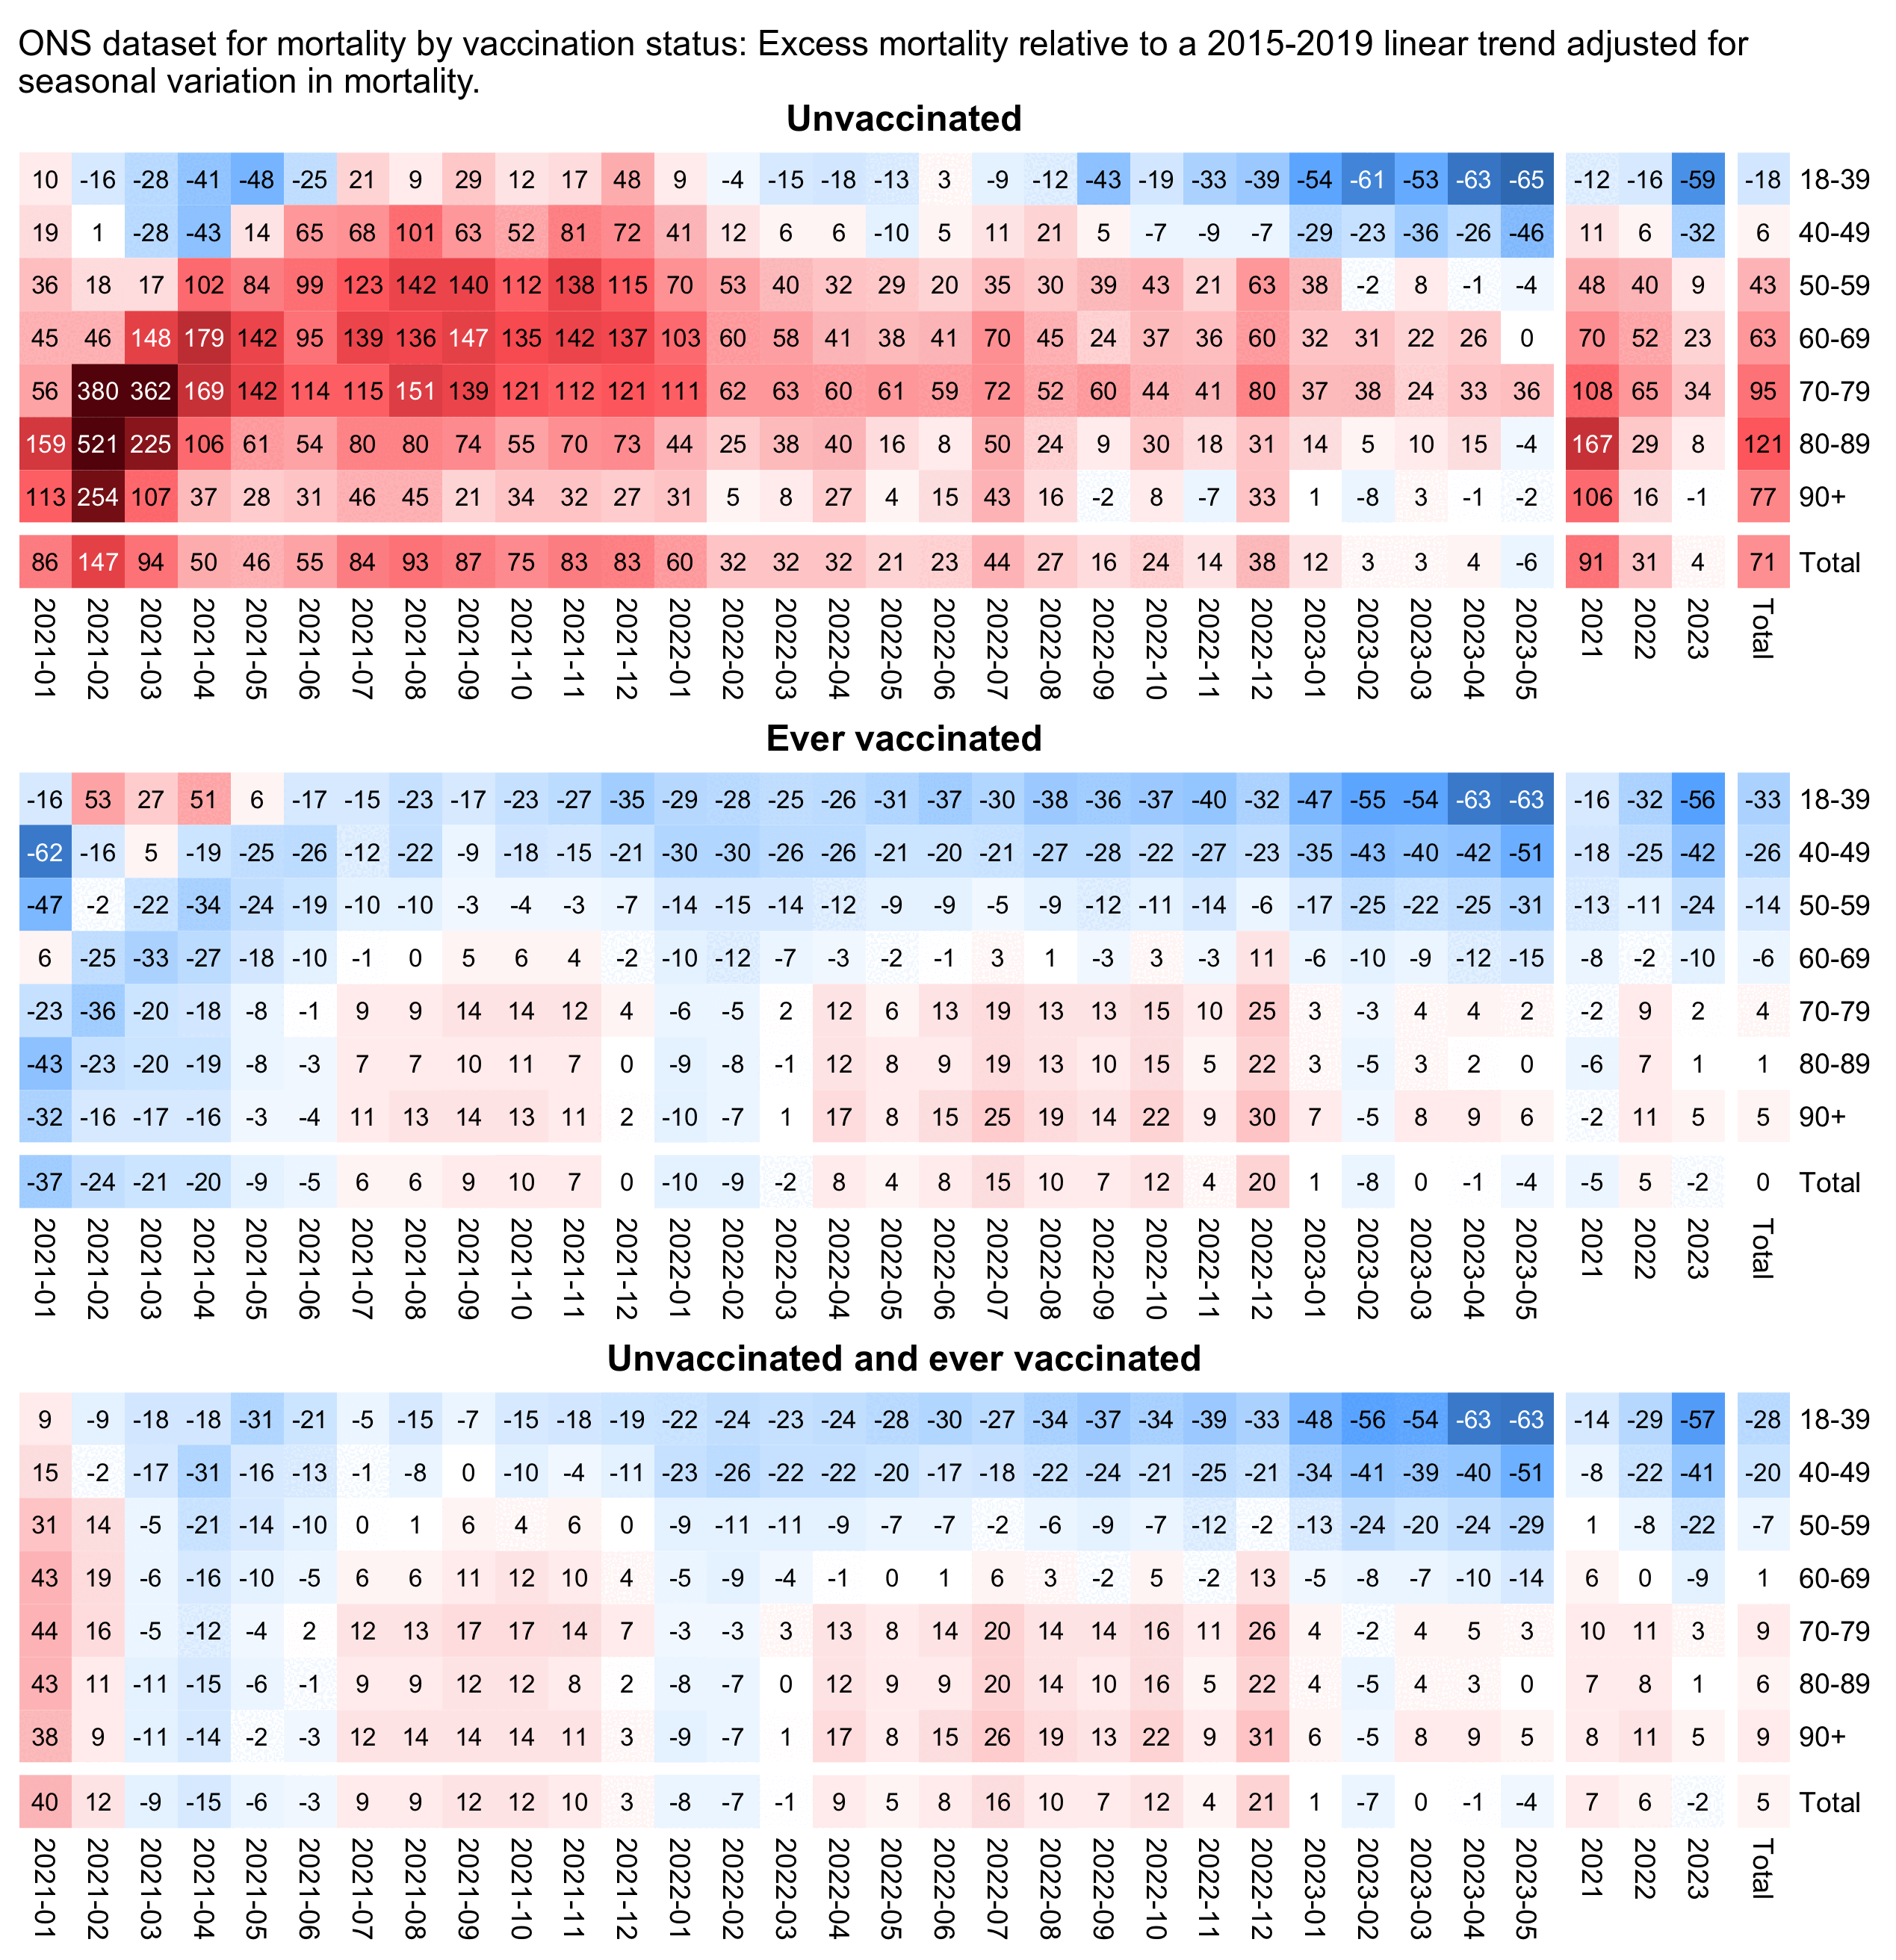
download.file("https://www.ons.gov.uk/file?uri=/peoplepopulationandcommunity/birthsdeathsandmarriages/deaths/adhocs/1343dailydeathsbydateofoccurrence1stjune2014to31stmay2023bysingleyearofageengland/dailydeaths2014to2023england.xlsx","dailydeaths2014to2023england.xlsx")

library(data.table)

ma=\(x,b=1,f=b){x[]=rowMeans(embed(c(rep(NA,b),x,rep(NA,f)),f+b+1),na.rm=T);x}

agecut=\(x,y)cut(x,c(y,Inf),paste0(y,c(paste0("-",y[-1]-1),"+")),T,F)

seapre=\(x,y,xout=x,spar=.5){class(x)=class(y)="Date"
  d=data.frame(x,y);lm=lm(y~x,d)
  daily=tapply(y-predict(lm,list(x)),substr(x,6,10),mean)
  daily=daily[names(daily)!="02-29"]
  daily[]=smooth.spline(rep(daily,3),spar=spar)$y[366:730]
  daily["02-29"]=mean(daily[c("02-28","03-01")])
  data.frame(x=xout,y=predict(lm,list(x=xout))+daily[substr(xout,6,10)])}

dead=as.data.table(readxl::read_excel("dailydeaths2014to2023england.xlsx",sheet=4,range="A6:CP3293"))
dead=dead[,.(date=as.Date(paste0(Year,"-",Month,"-",Day)),age=rep(0:90,each=.N),dead=unlist(.SD[,-(1:3)],,F))]

pop=fread("http://sars2.net/f/englandpop.csv")[,date:=as.Date(paste0(year,"-7-1"))]
pop=pop[,with(spline(date,pop,xout=unique(dead$date)),.(date=`class<-`(x,"Date"),pop=y)),age]

me=merge(dead,pop)[age>=18,.(cmr=sum(dead)/sum(pop)),.(date,age=agecut(age,c(18,4:9*10)))]
future=seq(as.Date("2020-1-1"),as.Date("2023-5-31"),1)
me=me[,.(date,cmr=ma(cmr,10)),age][date<="2019-12-31",seapre(date,cmr,future),age]
me=me[,.(cmr=mean(y)),.(month=substr(x,1,7),age=levels(age)[age])]

ons=fread("http://sars2.net/f/ons.csv")[ed==9|ed==7&month<="2021-03"][cause=="All causes"]
ons=merge(ons,me)[,.(month,age,dead,status,base=cmr*pop*365)]
ons=rbind(ons,ons[status!="Unvaccinated",.(dead=sum(dead),base=sum(base),status="Ever vaccinated"),.(age,month)])
ons=rbind(ons,ons[status%in%paste0(c("Ever ","Un"),"vaccinated"),.(
  dead=sum(dead),base=sum(base),status="Unvaccinated and ever vaccinated"),.(age,month)])
ons[,month:=factor(month,c(unique(month),2021:2023,"Total"))]
ons=rbind(ons,ons[,.(dead=sum(dead),base=sum(base),month="Total"),.(age,status)])
ons=rbind(ons,ons[,.(dead=sum(dead),base=sum(base),age="Total"),.(month,status)])
ons=rbind(ons,ons[month!="Total",.(dead=sum(dead),base=sum(base)),.(month=substr(month,1,4),age,status)])

stat=c("Unvaccinated","Ever vaccinated","Unvaccinated and ever vaccinated")

for(i in 1:length(stat)){
  m1=ons[status==stat[i],tapply(dead,list(age,month),c)]
  m2=ons[status==stat[i],tapply(base,list(age,month),c)]

  disp=round((m1/m2-1)*100)
  m=(m1-m2)/ifelse(m1>m2,m2,m1)*100
  exp=.82;m=abs(m)^exp*sign(m);maxcolor=300^exp

  pheatmap::pheatmap(m,filename=paste0("i",i,".png"),display_numbers=disp,main=stat[i],
    gaps_col=ncol(m)-c(4,1),gaps_row=nrow(m)-1,
    cluster_rows=F,cluster_cols=F,legend=F,cellwidth=17,cellheight=17,fontsize=9,fontsize_number=8,
    number_color=ifelse((abs(m)>.55*maxcolor)&!is.na(m),"white","black"),border_color=NA,na_col="gray90",
    breaks=seq(-maxcolor,maxcolor,,256),
    colorRampPalette(hsv(rep(c(7/12,0),5:4),c(.9,.75,.6,.3,0,.3,.6,.75,.9),c(.4,.65,1,1,1,1,1,.65,.4)))(256))
}

cap="ONS dataset for mortality by vaccination status: Excess mortality relative to a 2015-2019 linear trend adjusted for seasonal variation in mortality."

system(paste0("w=`identify -format %w i1.png`;pad=48;convert -gravity northwest -pointsize 46 -font Arial -interline-spacing -2 \\( -splice x32 -size $[w-pad]x caption:'",cap,"' -extent $[w-pad]x -gravity center \\) \\( -shave 0x8 i[123].png \\) -append 1.png"))
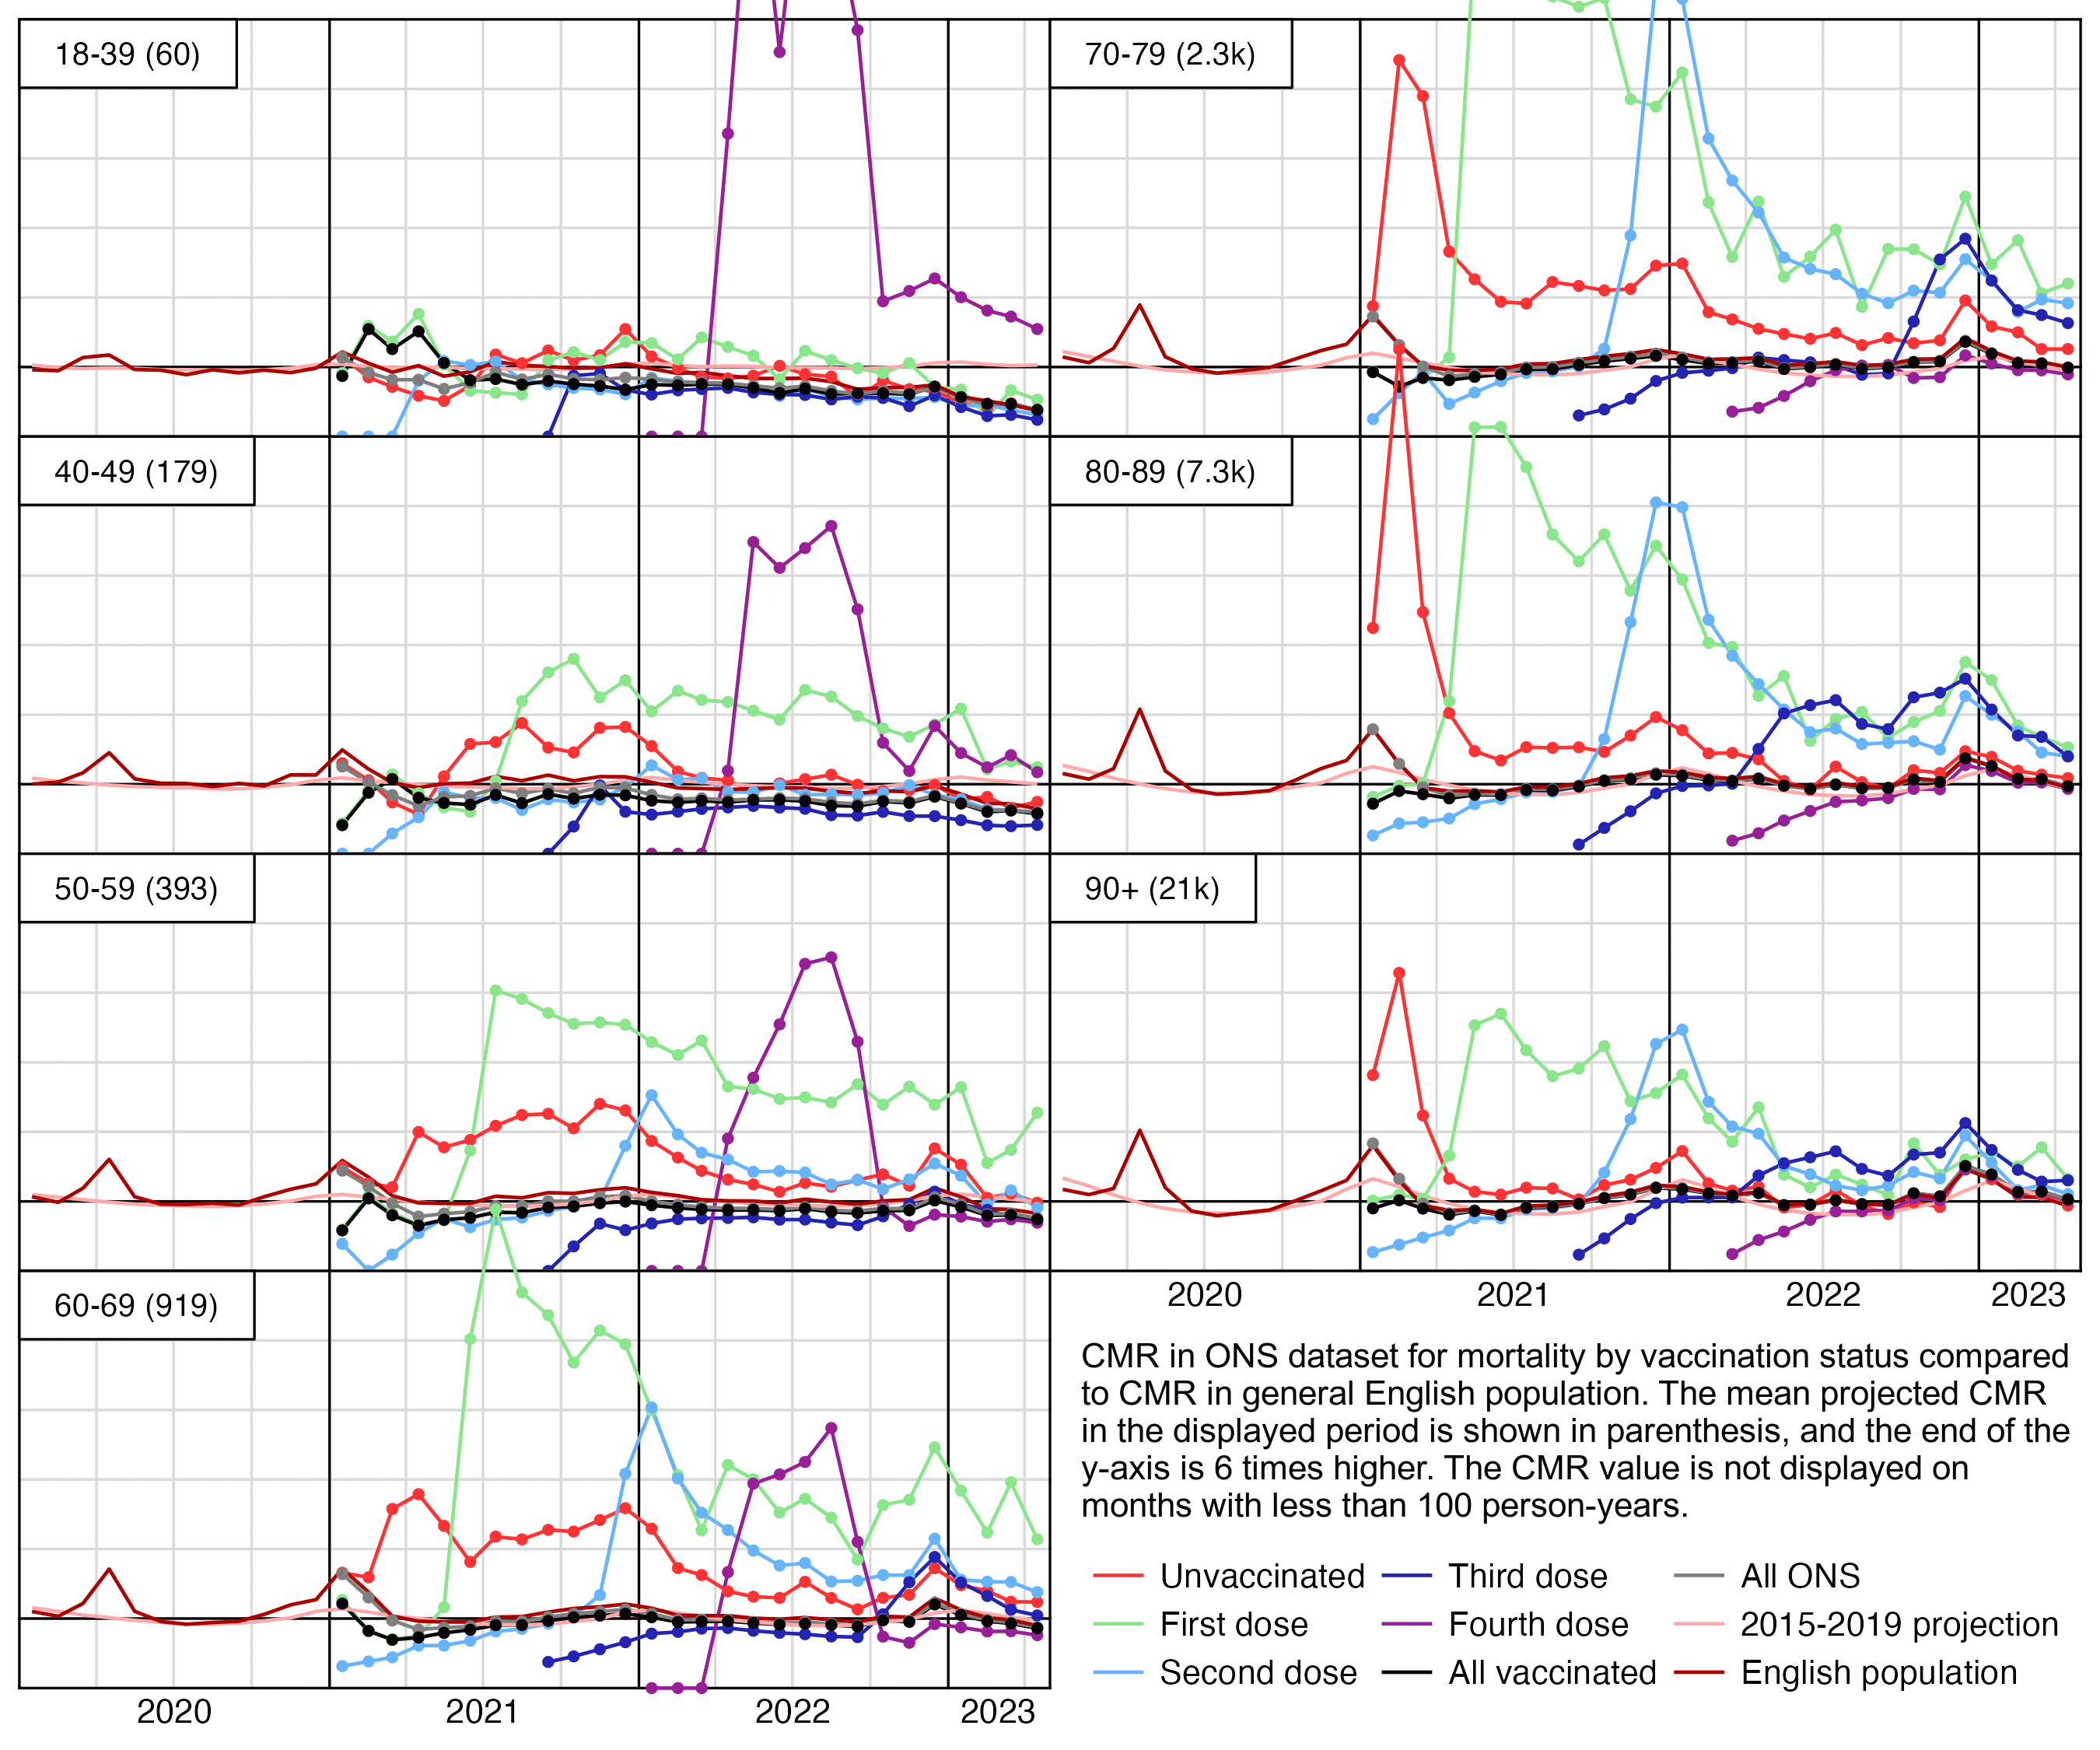
download.file("https://www.ons.gov.uk/file?uri=/peoplepopulationandcommunity/birthsdeathsandmarriages/deaths/adhocs/1343dailydeathsbydateofoccurrence1stjune2014to31stmay2023bysingleyearofageengland/dailydeaths2014to2023england.xlsx","dailydeaths2014to2023england.xlsx")

library(ggplot2);library(data.table)

kimi=\(x){e=floor(log10(ifelse(x==0,1,abs(x))));e2=pmax(e,0)%/%3+1;x[]=ifelse(abs(x)<1e3,round(x),
  paste0(sprintf(paste0("%.",ifelse(e%%3==0,1,0),"f"),x/1e3^(e2-1)),c("","k","M","B","T")[e2]));x}

agecut=\(x,y)cut(x,c(y,Inf),paste0(y,c(paste0("-",y[-1]-1),"+")),T,F)

ma=\(x,b=1,f=b){x[]=rowMeans(embed(c(rep(NA,b),x,rep(NA,f)),f+b+1),na.rm=T);x}

seapre=\(x,y,xout=x,spar=.5){class(x)=class(y)="Date"
  d=data.frame(x,y);lm=lm(y~x,d)
  daily=tapply(y-predict(lm,list(x)),substr(x,6,10),mean)
  daily=daily[names(daily)!="02-29"]
  daily[]=smooth.spline(rep(daily,3),spar=spar)$y[366:730]
  daily["02-29"]=mean(daily[c("02-28","03-01")])
  data.frame(x=xout,y=predict(lm,list(x=xout))+daily[substr(xout,6,10)])}

dead=as.data.table(readxl::read_excel("dailydeaths2014to2023england.xlsx",sheet=4,range="A6:CP3293"))
dead=dead[,.(date=as.Date(paste0(Year,"-",Month,"-",Day)),age=rep(0:90,each=.N),dead=unlist(.SD[,-(1:3)],,F))]

pop=fread("http://sars2.net/f/englandpop.csv")[,date:=as.Date(paste0(year,"-7-1"))]
pop=pop[,with(spline(date,pop,xout=unique(dead$date)),.(date=`class<-`(x,"Date"),pop=y)),age]

past=merge(dead,pop)[age>=18][,age:=agecut(age,c(18,4:9*10))]
proj=past[,.(cmr=sum(dead)/sum(pop)),.(date,age)]
future=seq(as.Date("2020-1-1"),as.Date("2023-5-31"),1)
proj=proj[,.(date,cmr=ma(cmr,10)),age][date<="2019-12-31",seapre(date,cmr,future),age]
proj=proj[,.(cmr=mean(y)*365e5),.(month=substr(x,1,7),age=levels(age)[age])]

ons=fread("http://sars2.net/f/ons.csv")[ed==9|ed==7&month<="2021-03"][cause=="All causes"&age!="Total"]
ons=ons[,.(dead=sum(dead),pop=sum(pop)),.(month,age,status=sub("(,| or).*","",status))]
tot=ons[,.(dead=sum(dead),pop=sum(pop),status="All people"),.(month,age)]
ons=rbind(ons,tot,ons[status!="Unvaccinated",.(dead=sum(dead),pop=sum(pop),status="All vaccinated"),.(month,age)])

p=rbind(ons[,.(month,age,cmr=ifelse(pop<1e2,NA,dead/pop*1e5),status)],cbind(proj,status="2015-2019 projection"))
p=rbind(p,past[,.(cmr=sum(dead)/sum(pop)*365e5,status="English population"),.(month=substr(date,1,7),age)])
p[,month:=as.Date(paste0(month,"-1"))]
p[,status:=factor(status,c("Unvaccinated",paste0(c(
  "First","Second","Third","Fourth")," dose"),"All vaccinated","All people","2015-2019 projection","English population"))]
p[is.infinite(cmr),cmr:=NA]

meancmr=p[grep("proj",status),.(mean=mean(cmr)),age]
p[,cmr:=cmr/meancmr$mean[match(age,meancmr$age)]/6]

xstart=as.Date("2020-1-1");xend=as.Date("2023-5-1")
xbreak=c(seq(xstart+183,xend,"year"),as.Date("2023-3-1"));xlab=2020:2023

color=c(hsv(0,.8,1),hsv(c(12,21,24,30)/36,c(.4,.6,.8,.8),c(.9,1,.7,.6)),"black","gray50","#ffaaaa","#aa0000")

ggplot(p,aes(x=month+15))+
facet_wrap(~age,ncol=2,dir="v",strip.position="top")+
geom_vline(xintercept=seq(xstart,xend,"3 month"),linewidth=.25,color="gray85")+
geom_hline(yintercept=seq(0,1,,7),linewidth=.25,color="gray85",lineend="square")+
geom_vline(xintercept=c(seq(xstart,xend,"year"),xend),linewidth=.25,lineend="square")+
geom_hline(yintercept=c(0,1/6,1),linewidth=.25,lineend="square")+
geom_line(aes(y=cmr,color=status),linewidth=.35)+
geom_point(data=p[status%in%levels(status)[1:7]],aes(y=cmr,color=status),size=.5,show.legend=F)+
geom_label(data=meancmr,aes(label=paste0("\n    ",age," (",kimi(mean),")    \n")),x=xstart,y=1,lineheight=.6,hjust=0,vjust=1,size=2.3,fill="white",label.r=unit(0,"lines"),label.padding=unit(0,"lines"),label.size=.25)+
labs(x=NULL,y=NULL)+
scale_x_date(limits=c(xstart,xend),breaks=xbreak,labels=xlab)+
scale_color_manual(values=color)+
scale_fill_manual(values=color)+
coord_cartesian(ylim=c(0,1),clip="off",expand=F)+
guides(color=guide_legend(nrow=3,byrow=F))+
theme(axis.text=element_text(size=7,color="black"),
  axis.text.y=element_blank(),
  axis.ticks=element_blank(),
  axis.ticks.length=unit(0,"pt"),
  legend.background=element_blank(),
  legend.box.spacing=unit(0,"pt"),
  legend.direction="horizontal",
  legend.position=c(.99,-.005),
  legend.justification=c(1,0),
  legend.key.height=unit(10,"pt"),
  legend.key.width=unit(13,"pt"),
  legend.key=element_rect(fill=alpha("white",0)),
  legend.margin=margin(2),
  legend.spacing.x=unit(2,"pt"),
  legend.text=element_text(size=7,vjust=.5),
  legend.title=element_blank(),
  panel.spacing=unit(0,"lines"),
  panel.background=element_rect(fill="white"),
  panel.grid=element_blank(),
  plot.margin=margin(4,4,4,4),
  plot.subtitle=element_text(size=6.5,margin=margin(0,0,3,0)),
  plot.title=element_text(size=7,face="bold",margin=margin(1,0,4,0)),
  strip.background=element_blank(),
  strip.text=element_blank())
ggsave("0.png",width=6,height=5,dpi=450)

system("convert 0.png -background '#0000' -fill black -gravity southwest -size 1300x -font Arial -interline-spacing -2 -pointsize 44 caption:'CMR in ONS dataset for mortality by vaccination status compared to CMR in general English population. The maximum value of the y-axis is 6 times the average projected CMR in the displayed period, which is shown in parentheses. The CMR value is not displayed on months with less than 100 person-years.' -gravity southeast -geometry +10+290 -composite 1.png")
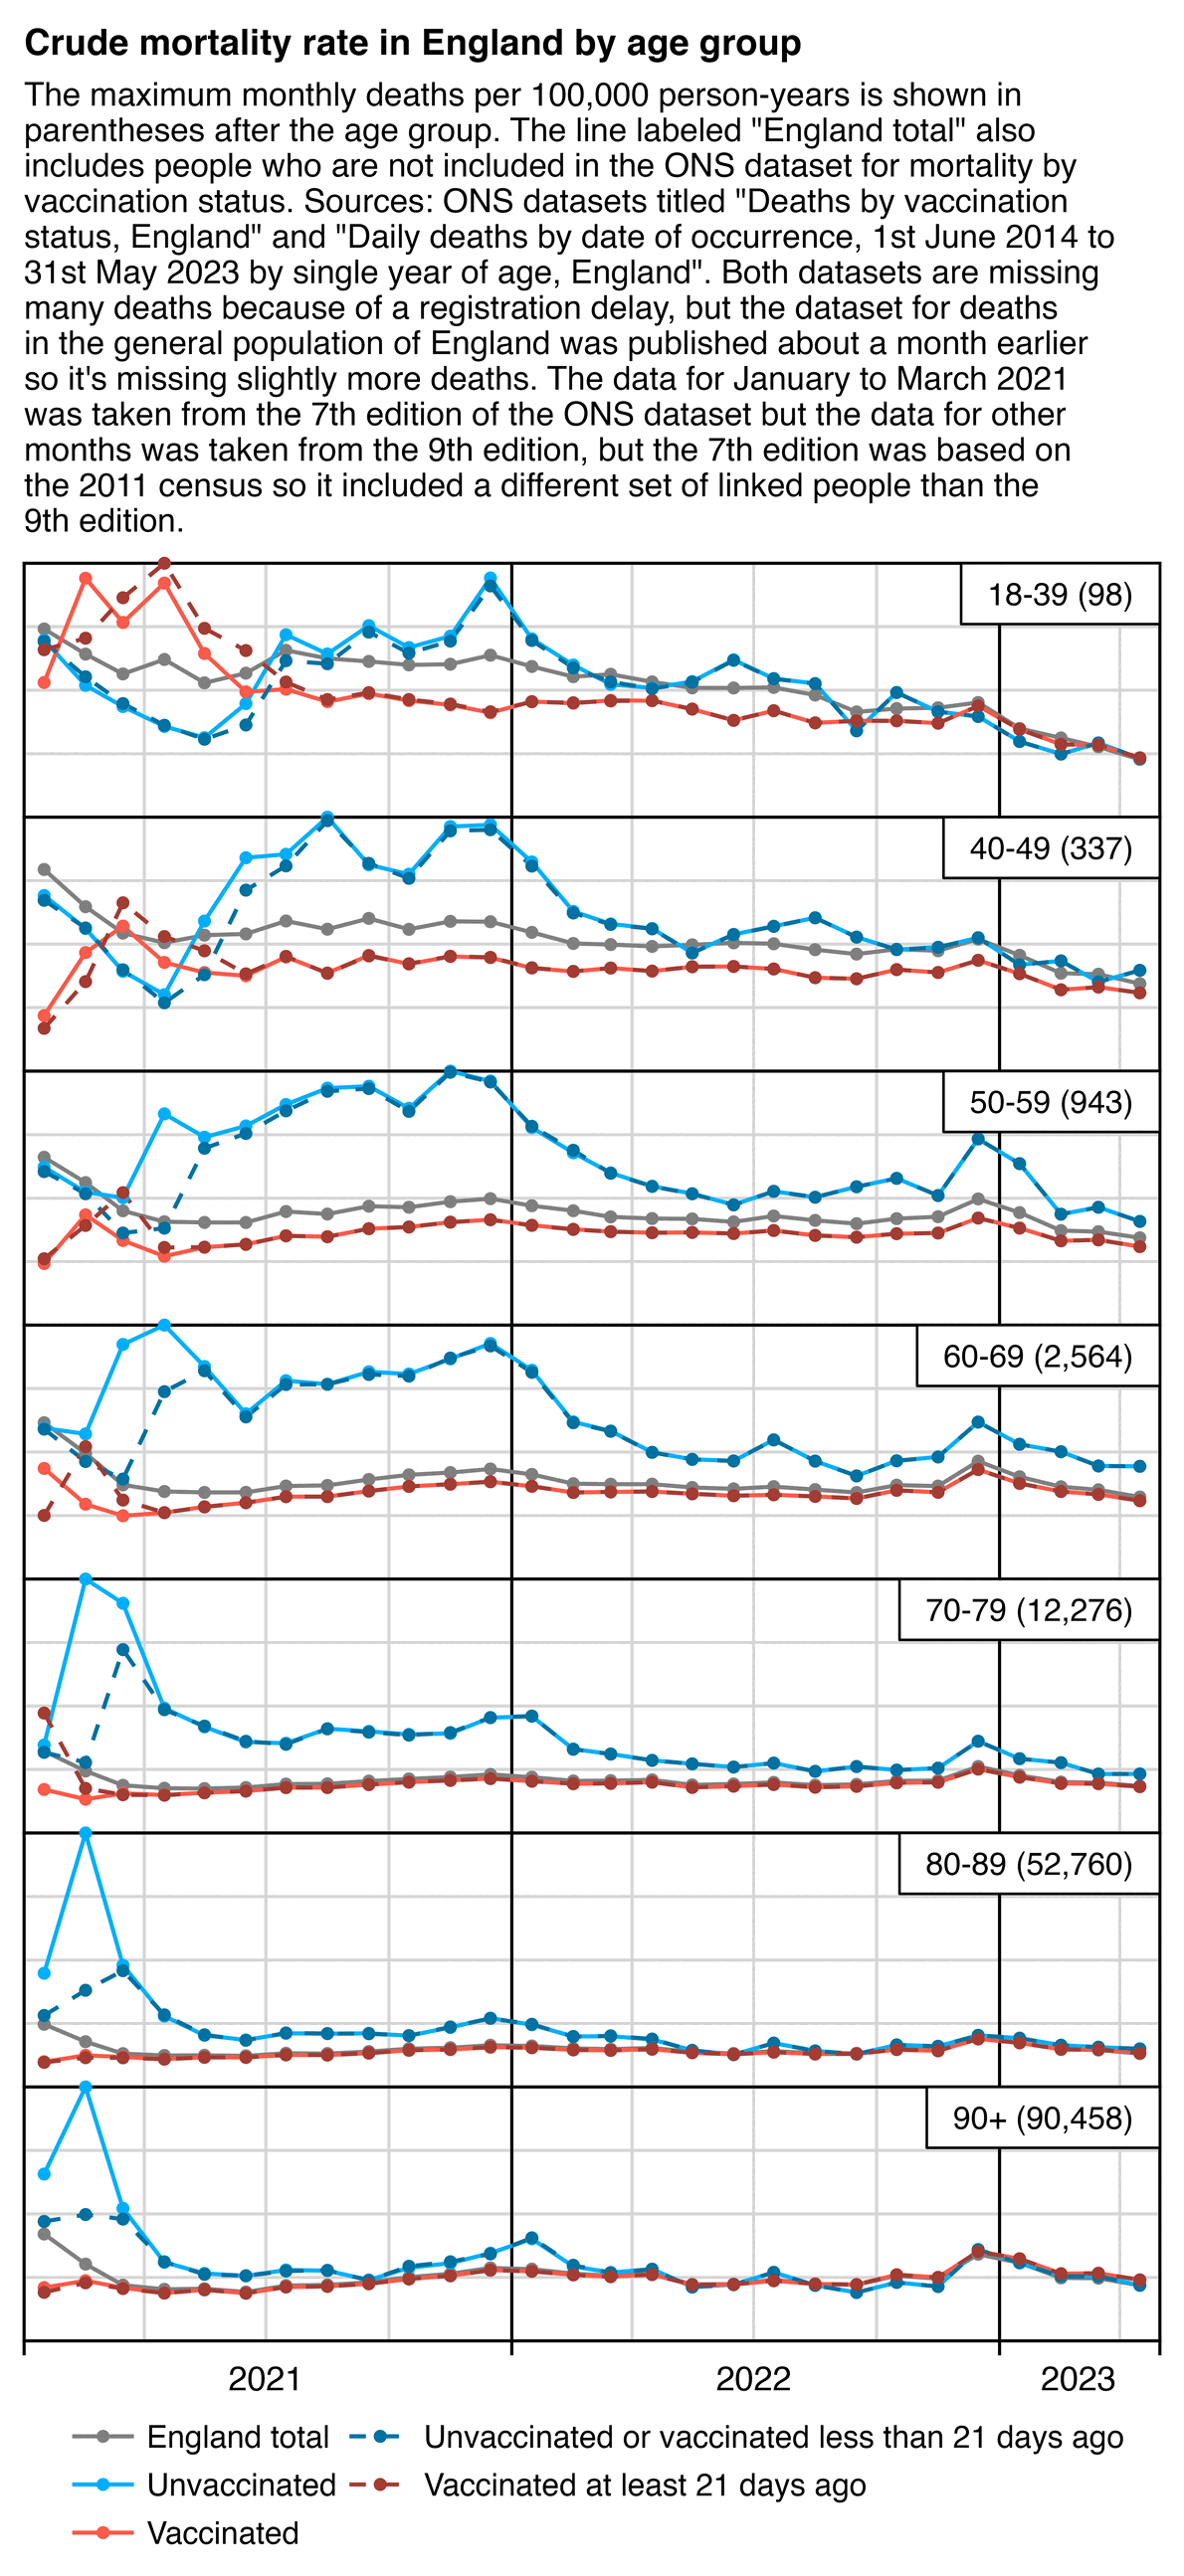
library(data.table);library(ggplot2)

agecut=\(x,y)cut(x,c(y,Inf),paste0(y,c(paste0("-",y[-1]-1),"+")),T,F)

# download.file("https://www.ons.gov.uk/file?uri=/peoplepopulationandcommunity/birthsdeathsandmarriages/deaths/adhocs/1343dailydeathsbydateofoccurrence1stjune2014to31stmay2023bysingleyearofageengland/dailydeaths2014to2023england.xlsx","dailydeaths2014to2023england.xlsx")

dead=data.table(readxl::read_excel("dailydeaths2014to2023england.xlsx",sheet=4,range="A6:CP3293"))
dead=dead[,.(x=as.Date(paste0(Year,"-",Month,"-",Day)),dead=unlist(.SD[,-(1:3)]),age=rep(0:90,each=.N))]
pop=fread("http://sars2.net/f/englandpop.csv")
pop=pop[,spline(as.Date(paste0(year,"-7-1")),pop,xout=unique(dead$x)),age][,.(pop=y,x=`class<-`(x,"Date"),age)]
ages=c(18,4:9*10)
p=merge(dead,pop)[,.(y=sum(dead)/sum(pop)*365e5,z="English population"),.(age=agecut(age,ages),x=substr(x,1,7))]

t=fread("http://sars2.net/f/ons.csv")
t=rbind(t[ed==9],t[ed==7&month<="2021-03"])[cause=="All causes"]
p=rbind(p,t[,.(y=sum(dead)/sum(pop)*1e5),.(z=ifelse(status=="Unvaccinated",status,"Vaccinated"),x=month,age)])
p=rbind(p,t[,.(y=sum(dead)/sum(pop)*1e5),.(z=ifelse(grepl("Unvac|First dose, less",status),"Unvaccinated or vaccinated less than 21 days ago","Vaccinated at least 21 days ago"),x=month,age)])

p=p[!is.na(age)&age!="Total"]
p[,z:=factor(z,unique(z))]
p[,x:=as.Date(paste0(x,"-1"))]

xstart=as.Date("2021-1-1");xend=as.Date("2023-5-1")
p=p[x>=xstart&x<=xend]
xbreak=seq(as.Date("2021-1-1"),xend,"6 month");xlab=c(rbind("",2021:2022),"")

p=merge(p,p[,.(max=max(y)),age])[,y:=y/max]

color=c("gray50",hcl(c(210,0)+15,130,60),hcl(c(210,0)+15,80,40))

sub="The maximum monthly deaths per 100,000 person-years is shown in parentheses after the age group. The line labeled \"English population\" also includes people who are not included in the ONS dataset for mortality by vaccination status. Sources: ONS datasets titled \"Deaths by vaccination status, England\" and \"Daily deaths by date of occurrence, 1st June 2014 to 31st May 2023 by single year of age, England\". Both datasets are missing many deaths because of a registration delay, but the dataset for deaths in the general population of England was published about a month earlier so it's missing slightly more deaths."|>stringr::str_wrap(74)

ggplot(p,aes(x=x+15,y))+
facet_wrap(~age,ncol=1,dir="v",scales="free_y",strip.position="top")+
geom_hline(yintercept=seq(0,1,.25),linewidth=.3,color="gray84")+
geom_vline(xintercept=seq(as.Date("2021-1-1"),as.Date("2023-4-1"),"3 month"),linewidth=.3,color="gray84")+
geom_vline(xintercept=c(xend,seq(as.Date("2021-1-1"),as.Date("2023-1-1"),"year")),linewidth=.3,lineend="square")+
geom_hline(yintercept=0:1,linewidth=.3,lineend="square")+
geom_line(aes(color=z,linetype=z),linewidth=.4)+
geom_point(aes(color=z),size=.6)+
geom_label(data=p[order(-y)][!duplicated(age)],aes(label=paste0("\n   ",age," (",formatC(max,digits=0,format="f",big.mark=","),")","   \n")),x=xend,y=1,lineheight=.5,hjust=1,vjust=1,size=2.3,label.r=unit(0,"lines"),label.padding=unit(0,"lines"),label.size=.25)+
labs(x=NULL,y=NULL,title="Table 2 of ONS dataset: Crude mortality rate in England",subtitle=sub)+
scale_x_date(limits=c(xstart,xend),breaks=xbreak,labels=xlab)+
scale_color_manual(values=color)+
scale_linetype_manual(values=c(1,1,1,2,2))+
coord_cartesian(clip="off",expand=F)+
guides(color=guide_legend(ncol=2))+
theme(axis.text=element_text(size=7,color="black"),
  axis.text.y=element_blank(),
  axis.ticks=element_line(linewidth=.3),
  axis.ticks.x=element_line(color=alpha("black",c(1,0))),
  axis.ticks.length=unit(3,"pt"),
  axis.ticks.length.y=unit(0,"pt"),
  axis.title=element_text(size=8),
  legend.background=element_blank(),
  legend.justification=c(.5,.5),
  legend.key=element_blank(),
  legend.key.width=unit(16,"pt"),
  legend.key.height=unit(10,"pt"),
  legend.margin=margin(-8,0,0,0),
  legend.position="bottom",
  legend.spacing=unit(0,"pt"),
  legend.spacing.x=unit(1,"pt"),
  legend.text=element_text(size=6.5,vjust=.5),
  legend.title=element_blank(),
  panel.background=element_blank(),
  panel.grid=element_blank(),
  panel.spacing=unit(0,"pt"),
  plot.margin=margin(4,5,4,5),
  plot.subtitle=element_text(size=6.8,margin=margin(,,5)),
  plot.title=element_text(size=7.5,face="bold",margin=margin(2,,4)),
  strip.background=element_blank(),
  strip.text=element_blank())
ggsave("1.png",width=3.4,height=7,dpi=350*4)
system("mogrify -resize 25% 1.png")
Eurostat has datasets for deaths and population estimates by single year of age up to ages 100+. This code combines them into a single CSV file with a more convenient format than the original files:
api="https://ec.europa.eu/eurostat/api/dissemination/sdmx/2.1/data/"

pop=read.table(paste0(api,"demo_pjan?format=TSV"),sep="\t",header=T,check.names=F,na.strings=":")
meta=read.csv(text=pop[,1],header=F)
pick=grepl("^Y",meta[,3])&meta[,4]=="T";meta=meta[pick,];pop=pop[pick,-1]
year=as.numeric(names(pop))[col(pop)]
age=as.numeric(sub("_LT1",0,sub("_OPEN",100,sub("^Y","",meta[,3]))))
d1=data.frame(year,age,location=meta[,5],pop=as.numeric(sub(":? *\\w*?$","",unlist(pop))))

dead=read.table(paste0(api,"demo_magec?format=TSV"),sep="\t",header=T,check.names=F,na.strings=":")
meta=read.csv(text=dead[,1],header=F)
pick=grepl("^Y",meta[,4])&meta[,3]=="T";meta=meta[pick,];dead=dead[pick,-1]
year=as.numeric(names(dead))[col(dead)]
age=as.numeric(sub("_LT1",0,sub("_OPEN",100,sub("^Y","",meta[,4]))))
d2=data.frame(year,age,location=meta[,5],dead=as.numeric(sub(":? *\\w*?$","",unlist(dead))))

o=merge(d1,d2,all=T)
o=o[!is.na(o$pop)|!is.na(o$dead),]
o=o[order(o$location,o$year,o$age),]

iso=read.csv("https://raw.githubusercontent.com/lukes/ISO-3166-Countries-with-Regional-Codes/master/all/all.csv")
iso=setNames(iso$name,iso$alpha.2)
iso["XK"]="Kosovo"
iso["UK"]="United Kingdom"
iso["EL"]="Greece"
iso["FX"]="Metropolitan France"
iso["TR"]="Turkey"
iso["RU"]="Russia"
iso["MD"]="Moldova"
iso["NL"]="Netherlands"
iso["DE_TOT"]="Germany including former GDR"

o$name=iso[o$location]
o=o[,c("location","name","year","age","dead","pop")]

write.csv(o,"eurostatpopdead.csv",quote=F,row.names=F,na="")
I uploaded the output here: f/eurostatpopdead.csv.gz. The output looks like this:
$ curl -Ls sars2.net/f/eurostatpopdead.csv.gz|gzip -dc|awk 'NR==1||/Russia/'|sed 4q
location,name,year,age,dead,pop
RU,Russia,2006,0,15079,1444214
RU,Russia,2006,1,1568,1484516
RU,Russia,2006,2,940,1457682
library(data.table);library(ggplot2)

t=fread("http://sars2.net/f/eurostatpopdead.csv.gz")[year%in%2013:2022]
t=merge(t,t[location=="EU27_2020"&year==2020,.(age,std=pop/sum(pop))])
t=t[location%in%na.omit(t)[,.N,location][N==max(N),location]]
t=t[!location%in%c("DE_TOT")]

a=t[,.(dead=sum(dead),asmr=sum(dead/pop*std)*1e5),.(location,name,year)]
a$base=a[year<2020,predict(lm(asmr~year),.(year=2013:2022)),location]$V1
a$base2=a[year%in%2015:2019,predict(lm(dead~year),.(year=2013:2022)),location]$V1
p=a[year==2022,.(x=(asmr/base-1)*100,y=(dead/base2-1)*100),name]

q=\(...)as.character(substitute(...()))
east=q(Bulgaria,Croatia,Cyprus,Czechia,Estonia,Greece,Hungary,Latvia,Poland,Romania,Serbia,Slovenia,Slovakia)
lab=q(Western,Eastern)
p$z=factor(ifelse(p$name%in%east,lab[2],lab[1]),lab)

breaks=p[,pretty(c(x,y),9)];lims=p[,extendrange(range(c(x,y)),,.04)]

ggplot(p,aes(x,y))+
coord_fixed(clip="off",expand=F)+
geom_vline(xintercept=0,linewidth=.4,color="gray60")+
geom_hline(yintercept=0,linewidth=.4,color="gray60")+
geom_abline(linetype="dashed",color="gray60",size=.4)+
geom_point(aes(color=z),size=.6)+
ggrepel::geom_text_repel(aes(label=name,color=z),size=3,max.overlaps=Inf,segment.size=.1,min.segment.length=.2,box.padding=.07,show.legend=F)+
labs(title="Eurostat: Excess ASMR in 2022 vs excess raw deaths in 2022",x="Excess ASMR in 2022 relative to 2013-2019 linear trend",y="Excess raw deaths in 2022 relative to 2015-2019 linear trend")+
scale_x_continuous(limits=lims,breaks=breaks,labels=\(x)paste0(x,"%"))+
scale_y_continuous(limits=lims,breaks=breaks,labels=\(x)paste0(x,"%"))+
scale_color_manual(values=c("#5555ff","#ff4444"))+
theme(axis.text=element_text(size=11,color="black"),
  axis.text.x=element_text(margin=margin(3)),
  axis.ticks=element_line(linewidth=.4,color="black"),
  axis.ticks.length=unit(-4,"pt"),
  axis.title=element_text(size=11),
  axis.title.x=element_text(margin=margin(3)),
  axis.title.y=element_text(margin=margin(,2)),
  legend.background=element_blank(),
  legend.box.spacing=unit(0,"pt"),
  legend.key=element_blank(),
  legend.key.height=unit(13,"pt"),
  legend.key.width=unit(26,"pt"),
  legend.position="top",
  legend.justification="left",
  legend.spacing.x=unit(2,"pt"),
  legend.margin=margin(,,6),
  legend.text=element_text(size=11,vjust=.5),
  legend.title=element_blank(),
  panel.background=element_blank(),
  panel.border=element_rect(fill=NA,linewidth=.4),
  panel.grid.major=element_blank(),
  plot.subtitle=element_text(size=11),
  plot.title=element_text(size=11.5,face=2,margin=margin(1,,5)))
ggsave("1.png",width=6,height=6,dpi=300*4)

sub="ASMR was calculated by single year of age up to ages 100+ so that the 2020 EU population estimates were used as the standard population. Deaths and population estimates by single year of age were compiled with this script: sars2.net/stat.html#Compile_a_CSV_file_for_deaths_and_population_estimates_by_single_year_of_age_in_various_countries. Countries that had deaths or population estimates missing for any combination of age or year in 2013-2022 were omitted."
system(paste0("mogrify -trim 1.png;w=`identify -format %w 1.png`;magick 1.png \\( -size $[w]x -font Arial -interline-spacing -3 -pointsize $[44*4] caption:'",gsub("'","'\\\\'",sub),"' -splice x100 \\) -append -resize 25% -bordercolor white -border 30 -colors 256 1.png"))
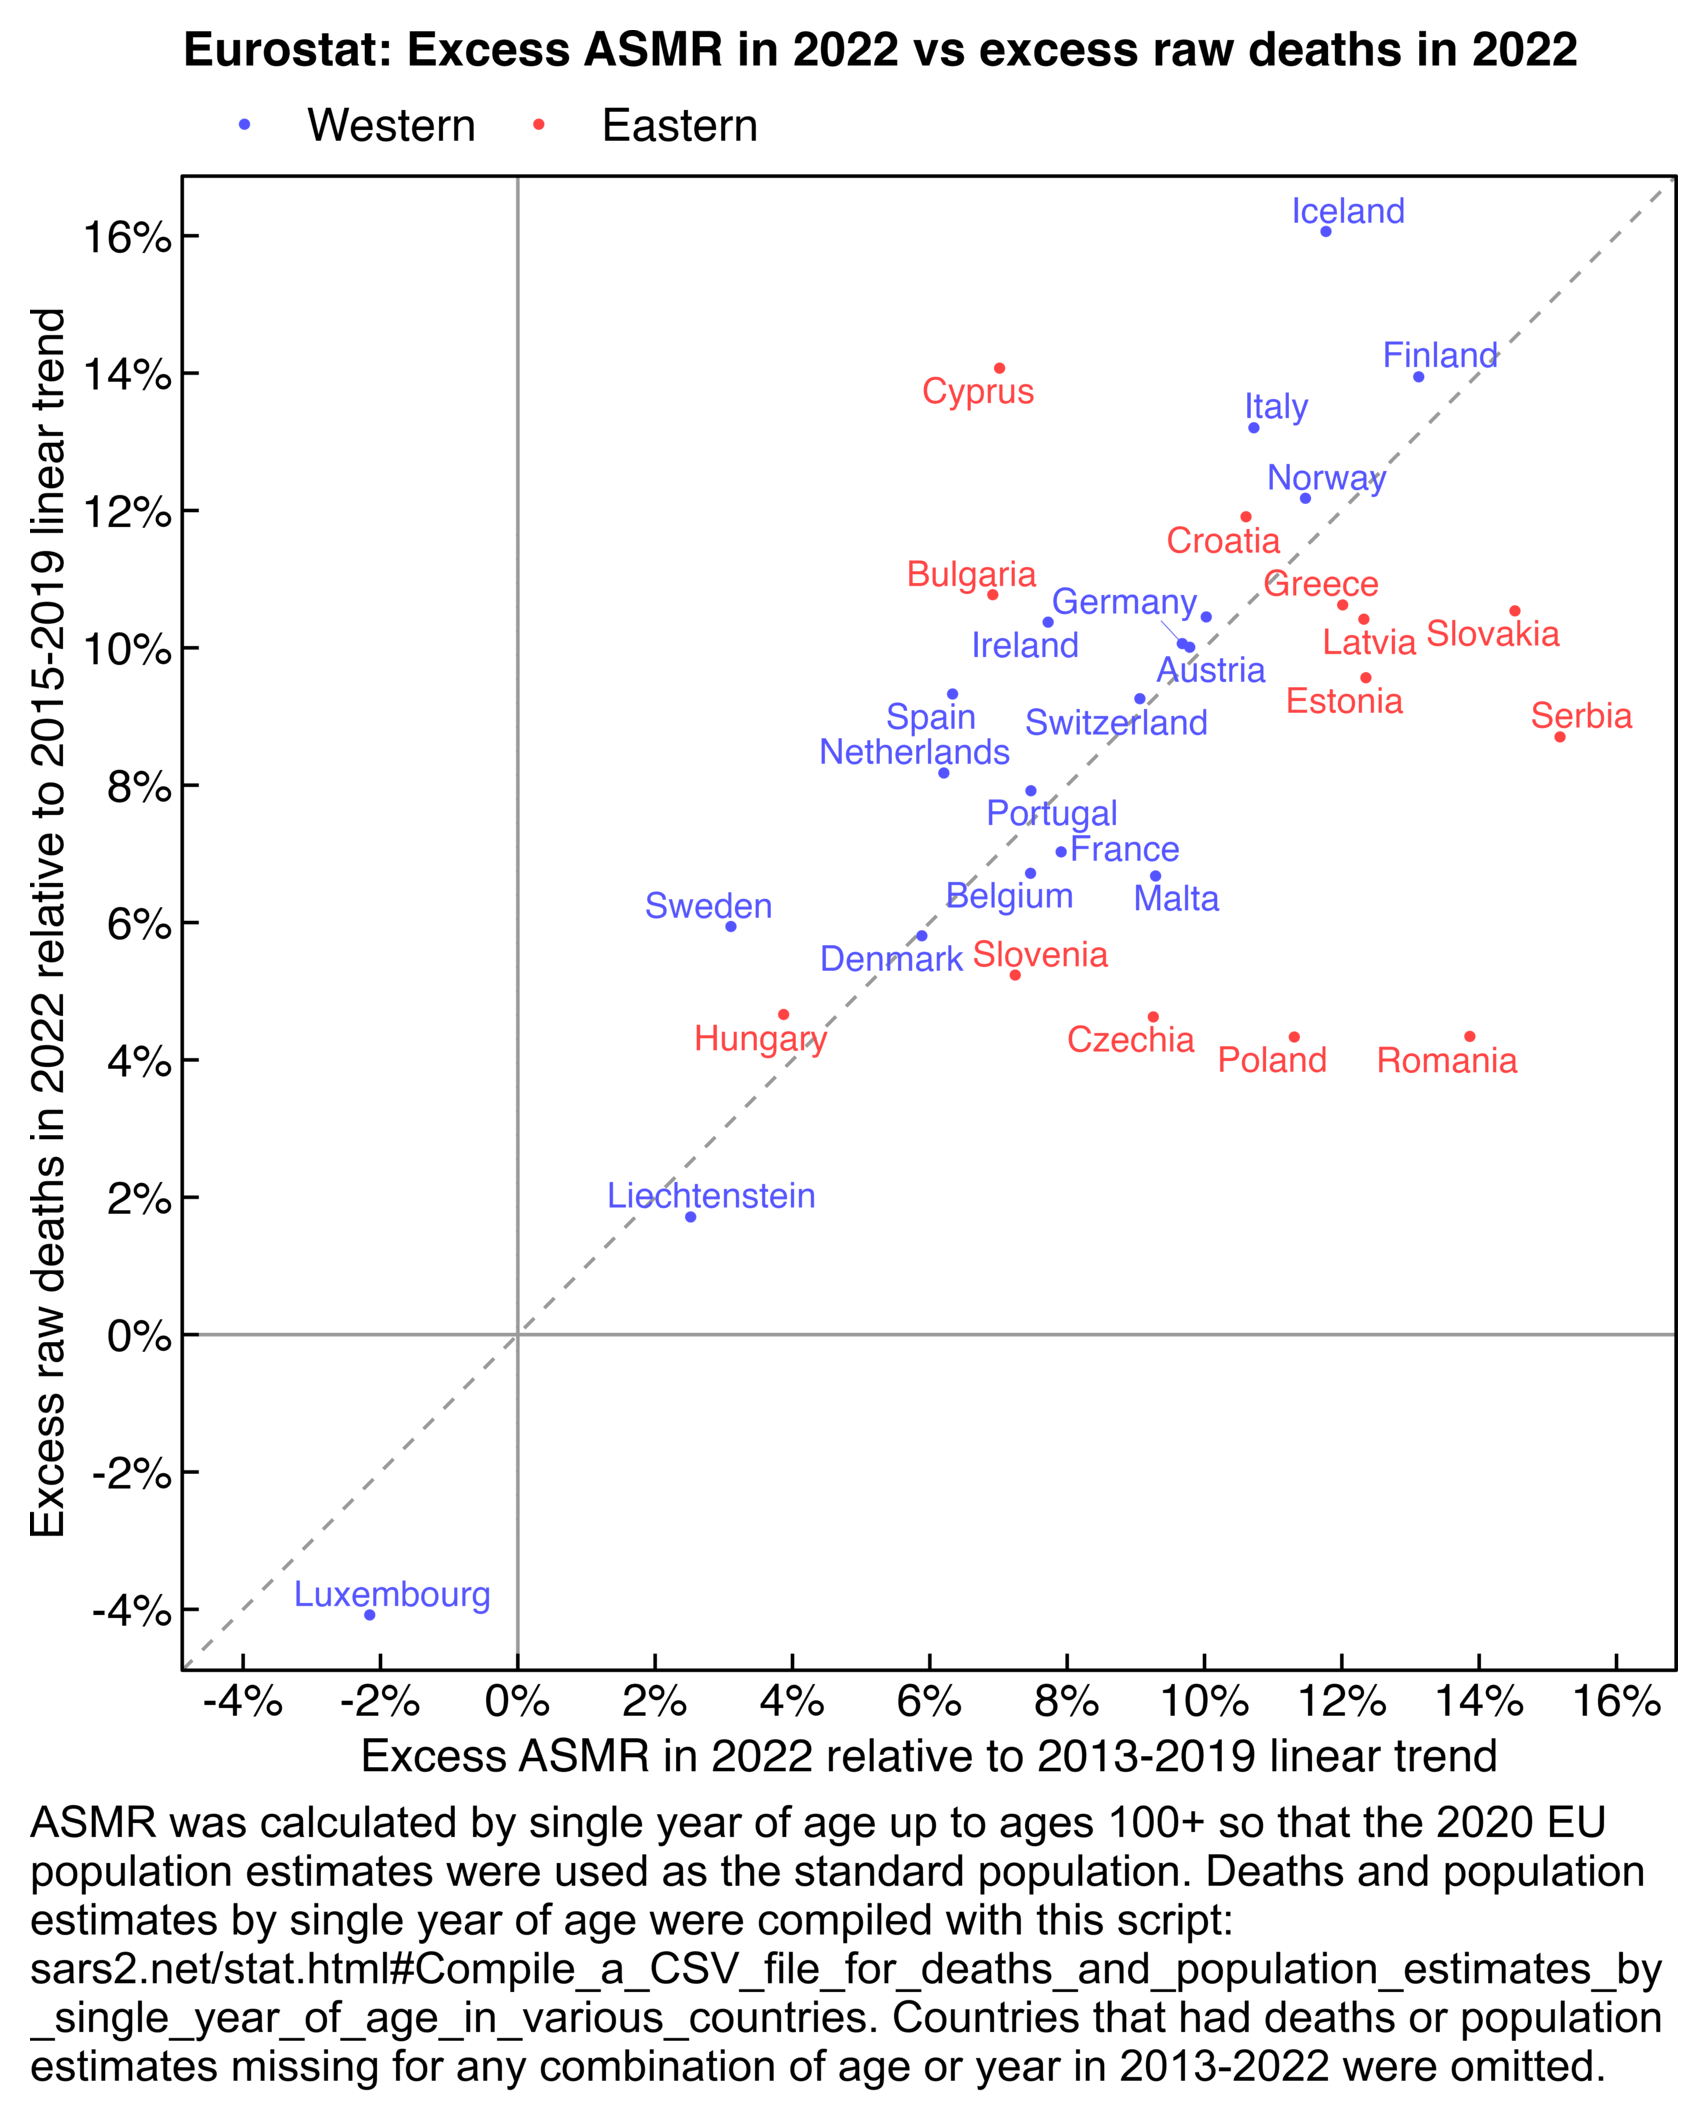
This uses UN's "World Population Prospects" dataset which starts in 1950: https://population.un.org/wpp/Download/Standard/CSV/. The dataset uses modeled data for many developing countries, which explains why there is little variation in the CMR of many developing countries during the first decades of data.
The dataset was published in July 2022, but it uses modeled data from January 2022 onwards: "In the 2022 revision, the figures from 1950 up to 2021 are treated as estimates, and thus the projections for each country or area begin on 1 January 2022 and extend until 2100. Because population data are not necessarily available for that date, the 2022 estimate is derived from the most recent population data available for each country, obtained usually from a population census or a population register, projected to 2022 using all available data on fertility, mortality and international migration trends between the reference date of the population data available and 1 January 2022." [https://population.un.org/wpp/Methodology/] Notes about the dataset also say: "For 74 countries or areas, the most recent available population count was from the period 2005-2014. For the remaining 11 countries or areas, the most recent available census data were from before 2005."
library(ComplexHeatmap)
library(circlize)
library(colorspace)

t=read.csv("WPP2022_Demographic_Indicators_Medium.csv")

pick=t[t$Time==2020&t$TPopulation1July>=1e3&t$LocTypeName=="Country/Area","Location"]
t2=t[t$Location%in%pick,]
t2%@%nu('Time',2022)

m=t(sapply(split.data.frame(t2,t2$Location),\(x){
  v=setNames(x$Deaths/x$TPopulation1July,x$Time)
  100*(v[-1]/head(v,-1)-1)
}))

m=m[order(setNames(t$SortOrder,t$Location)[rownames(m)]),]

rowmax=apply(m,1,\(x)x==max(x))

png("1.png",w=ncol(m)*30+1000,h=nrow(m)*30+1000,res=72)

ht_opt$COLUMN_ANNO_PADDING=unit(0,"mm")
ht_opt$ROW_ANNO_PADDING=unit(0,"mm")

disp=m
m=ifelse(m<0,-sqrt(abs(m)),sqrt(m))
maxcolor=.8*max0(abs(m))

maxcolor=sqrt(150)

Heatmap(
  m,
  show_heatmap_legend=F,
  show_column_names=F,
  show_row_names=F,
  width=unit(ncol(m)*30,"pt"),
  height=unit(nrow(m)*30,"pt"),
  row_dend_width=unit(200,"pt"),
  clustering_distance_rows="euclidean",
  cluster_columns=F,
  cluster_rows=F,
  column_title="Percentage change in crude mortality rate compared to previous year, population.un.org/wpp/Download/Standard/CSV/, file \"1950-2100, medium\" in section \"Demographic Indicators\".",
  column_title_gp=gpar(fontsize=23),
  rect_gp=gpar(col="gray80",lwd=0),
  top_annotation=columnAnnotation(text=anno_text(gt_render(colnames(m),padding=unit(c(3,3,3,3),"mm")),just="left",rot=90,location=unit(0,"npc"),gp=gpar(fontsize=17,border="gray70",lwd=1))),
  bottom_annotation=columnAnnotation(text=anno_text(gt_render(colnames(m),padding=unit(c(3,3,3,3),"mm")),just="left",rot=270,gp=gpar(fontsize=17,border="gray70",lwd=1))),
  left_annotation=rowAnnotation(text=anno_text(gt_render(rownames(m),padding=unit(c(3,3,3,3),"mm")),just="right",location=unit(1,"npc"),gp=gpar(fontsize=17,border="gray70",lwd=1))),
  right_annotation=rowAnnotation(text=anno_text(gt_render(rownames(m),padding=unit(c(3,3,3,3),"mm")),just="left",location=unit(0,"npc"),gp=gpar(fontsize=17,border="gray70",lwd=1))),
  # col=colorRamp2(seq(0,maxcolor,,15),hex(HSV(c(210,210,210,210,160,110,60,40,20,0,0,0,0,0,0),c(0,.166,.333,rep(.5,8),.6,.7,.8,.9),c(rep(1,11),.75,.5,.25,0)))),
  col=colorRamp2(seq(-maxcolor,maxcolor,,9),hex(HSV(c(210,210,210,210,0,0,0,0,0),c(.7,.7,.6,.3,0,.3,.6,.7,.7),c(.3,.65,1,1,1,1,1,.65,.3)))),
  cell_fun=\(j,i,x,y,w,h,fill)grid.text(sprintf("%.0f",disp[i,j]),x,y,gp=gpar(fontface=ifelse(rowmax[j,i],4,"plain"),fontsize=16,col=ifelse(abs(m[i,j])>=maxcolor*.5,"white","black")))
)

dev.off()
system("mogrify -gravity center -trim -border 16 -bordercolor white 1.png")
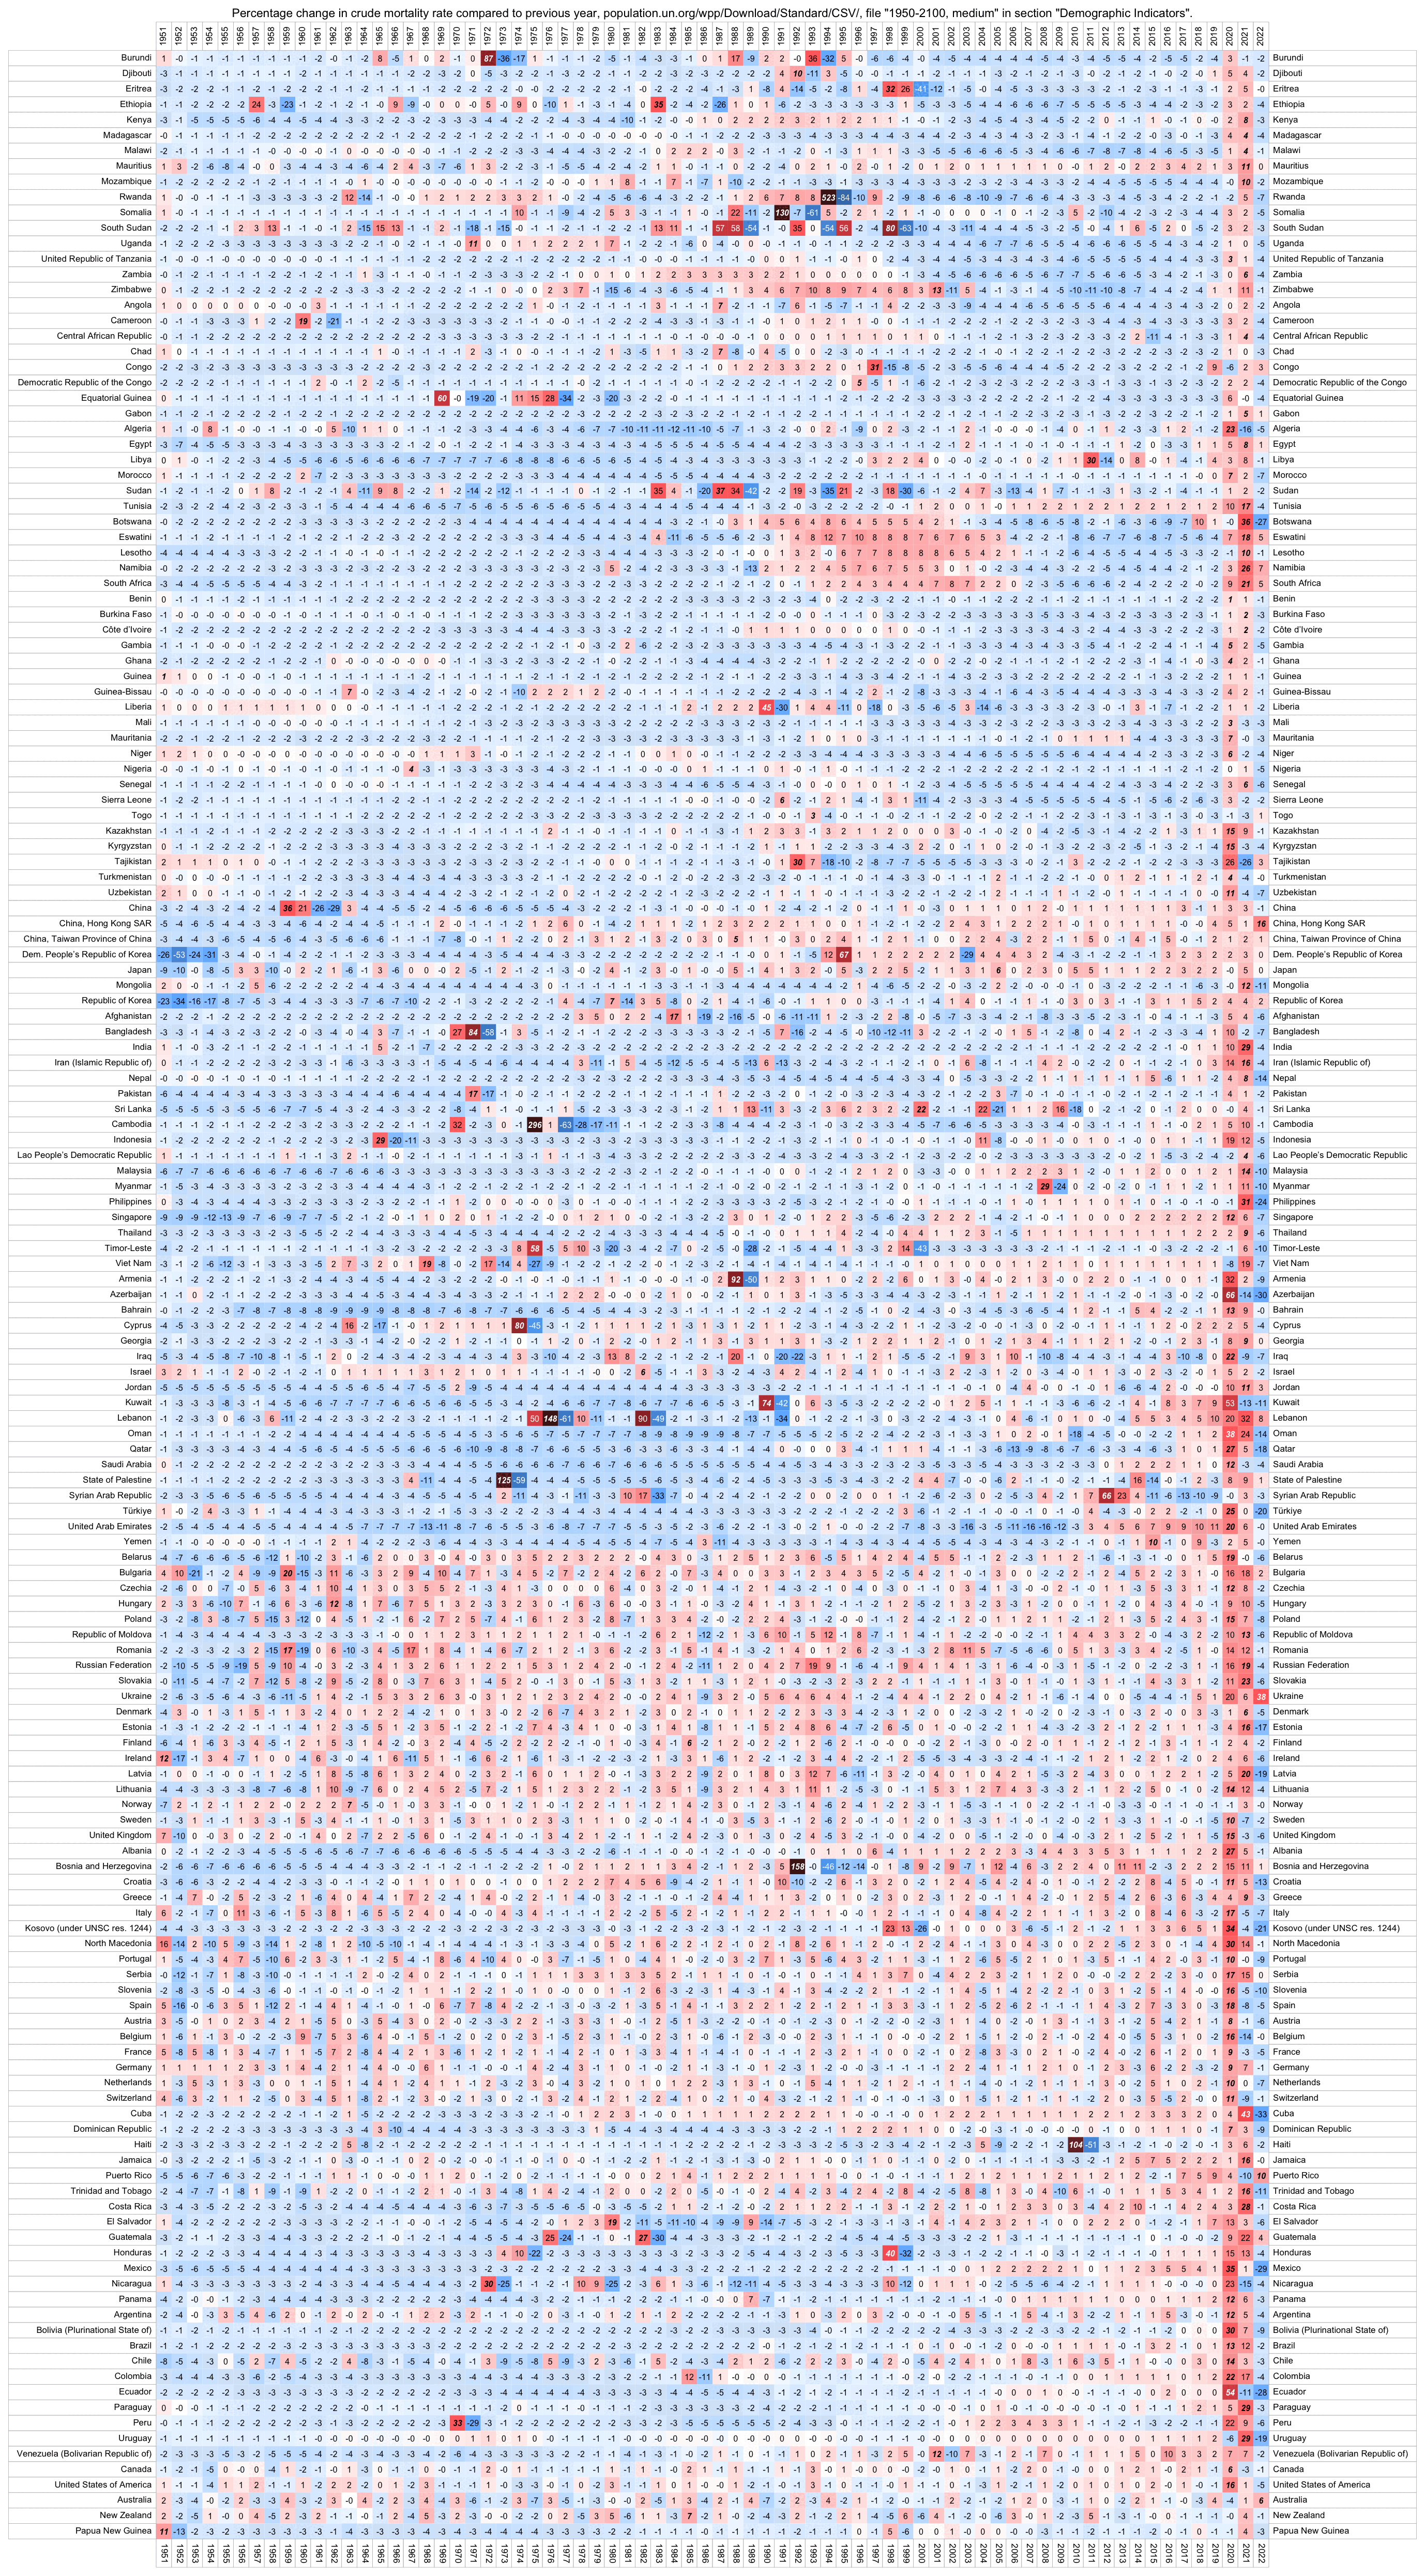
WHO has a dataset for monthly excess mortality in 2020 and 2021 where they use reported data for some countries and modeled data for other countries. [https://www.who.int/data/sets/global-excess-deaths-associated-with-covid-19-modelled-estimates] The dataset uses modeled data for most sub-Saharan African countries so I don't know how accurate it is though.
OWID has vaccination data for almost all African countries, but the data ends in 2022 for some countries, and some countries may have recorded only a part of their vaccinations.
library(ggplot2)

# `geom_mark_hull` draws the hulls incorrectly in new versions of `ggforce` so you need to install an old version of `ggforce`:
# install.packages("https://cran.r-project.org/src/contrib/Archive/ggforce/ggforce_0.3.4.tar.gz")

# download.file("https://covid.ourworldindata.org/data/owid-covid-data.csv","owid-covid-data.csv")

# https://www.who.int/data/sets/global-excess-deaths-associated-with-covid-19-modelled-estimates
who=read.csv("https://pastebin.com/raw/PVTHyL8V")
who2=who[who$year==2021,]
excess=100*tapply(who2$excess.mean/who2$expected.mean,who2$iso3,mean)

t=read.csv("owid-covid-data.csv")
t2=t[grepl("2021",t$date)&t$continent=="Africa",]

vax=tapply(t2$total_vaccinations_per_hundred,t2$iso_code,\(x){x=zoo::na.approx(x,na.rm=F);first=which(!is.na(x))[1];if(!is.na(first))x[1:first]=0;x})
vax=sapply(vax,mean,na.rm=T)[sapply(vax,\(x)sum(is.na(x))<50)]

xy=na.omit(data.frame(x=vax,y=excess[names(vax)],iso3=names(vax),name=setNames(t2$location,t2$iso_code)[names(vax)]))

regions=read.csv("https://raw.githubusercontent.com/lukes/ISO-3166-Countries-with-Regional-Codes/master/all/all.csv")
k=factor(paste(regions$sub.region,regions$intermediate.region)[match(xy$iso3,regions$alpha.3)])

set.seed(0)
hue=sample(seq(15,375,,nlevels(k)+1)[-1])
color=hcl(hue,90,50)
fill=hcl(hue,90,60)

candidates=c(sapply(c(1,2,5),\(x)x*10^c(-10:10)))
xstep=candidates[which.min(abs(candidates-max(xy$x)/8))]
ystep=candidates[which.min(abs(candidates-max(xy$y)/6))]
xstart=xstep*floor(min(xy$x)/xstep)
xend=xstep*ceiling(max(xy$x)/xstep)
ystart=ystep*floor(min(xy$y)/ystep)
yend=ystep*ceiling(max(xy$y)/ystep)

ggplot(xy,aes(x,y))+
geom_vline(xintercept=c(xstart,xend),color="gray75",linewidth=.3,lineend="square")+
geom_hline(yintercept=c(ystart,yend),color="gray75",linewidth=.3,lineend="square")+
ggforce::geom_mark_hull(aes(color=k,fill=k),concavity=1000,radius=unit(.3,"lines"),expand=unit(.3,"lines"),alpha=.2,size=.15)+
geom_smooth(method="lm",formula=y~x,size=.35,se=F)+
geom_point(aes(color=k),size=.6)+
# geom_text(aes(color=k),label=name,size=2.5,vjust=-.7)+
ggrepel::geom_text_repel(aes(color=k,label=name),size=2.5,max.overlaps=Inf,segment.size=.1,min.segment.length=.2,box.padding=.07)+
coord_cartesian(clip="off")+
ggtitle(paste0("Average cumulative vaccine doses per hundred in 2021 compared to average excess mortality in 2021 (r≈",sprintf("%.2f",cor(xy$x,xy$y)),")"),"Sources:
covid.ourworldindata.org/data/owid-covid-data.csv
who.int/data/sets/global-excess-deaths-associated-with-covid-19-modelled-estimates")+
labs(x="Average cumulative vaccine doses per hundred in 2021",y="Average excess mortality percent in 2021")+
scale_x_continuous(limits=c(xstart,xend),breaks=seq(xstart,xend,xstep),expand=expansion(0))+
scale_y_continuous(limits=c(ystart,yend),breaks=seq(ystart,yend,ystep),expand=expansion(0))+
scale_fill_manual(values=fill)+
scale_color_manual(values=color)+
theme(
  axis.text=element_text(size=7,color="black"),
  axis.text.y=element_text(angle=90,vjust=1,hjust=.5),
  axis.ticks=element_blank(),
  axis.ticks.length=unit(0,"lines"),
  axis.title=element_text(size=8),
  legend.position="none",
  panel.background=element_rect(fill="white"),
  panel.grid.major=element_line(color="gray85",linewidth=.2),
  plot.margin=margin(.5,.6,.5,.6,"lines"),
  plot.subtitle=element_text(size=7.5),
  plot.title=element_text(size=9)
)

ggsave("1.png",width=7,height=5)
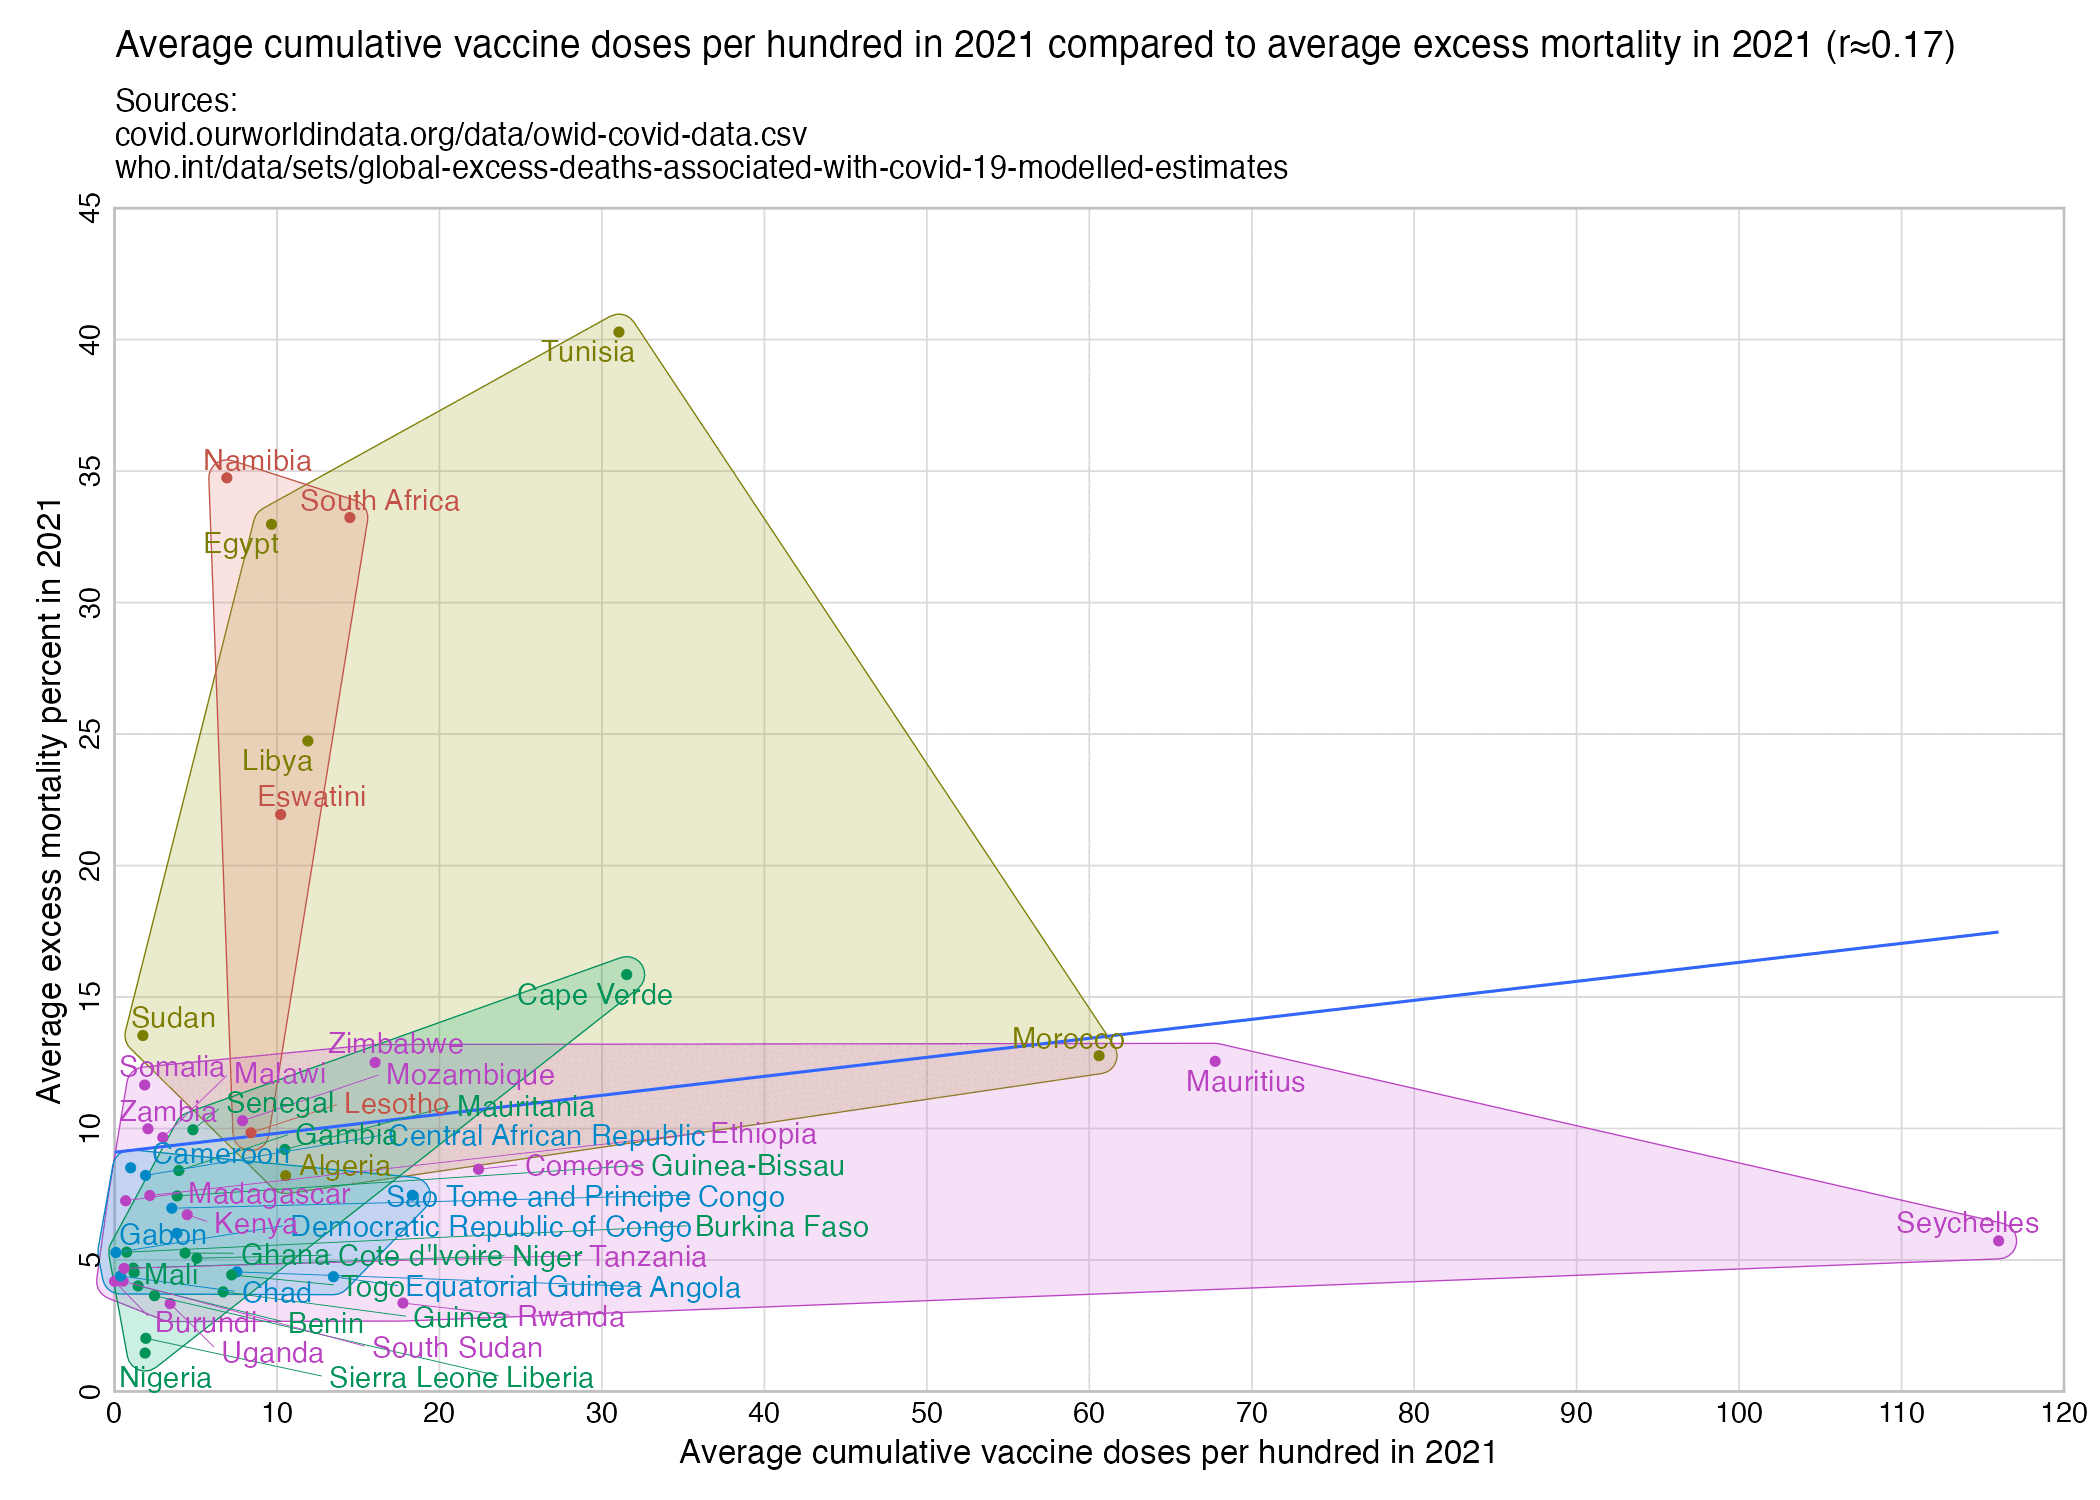
Source: https://github.com/cheongsa/Coronavirus-COVID-19-statistics-in-China.
library(colorspace)

t=read.csv("https://github.com/cheongsa/Coronavirus-COVID-19-statistics-in-China/raw/master/China_daily_new_infections.csv",check.names=F)
# t=read.csv("https://github.com/cheongsa/Coronavirus-COVID-19-statistics-in-China/raw/master/China_daily_new_deaths.csv",check.names=F)

colnames(t)=sub(" .*","",colnames(t))
m=as.matrix(rowsum(t[,-(1:4)],t[,2]))

disp=ifelse(m>=1e3,sprintf("%.1fk",m/1e3),m)
m=m/apply(m,1,max,na.rm=T)

pal=colorRampPalette(hex(HSV(c(210,210,210,160,110,60,30,0,0,0),c(0,.25,rep(.5,6),.7,.9),c(rep(1,8),.5,0))))(256)

pheatmap::pheatmap(m,filename="0.png",display_numbers=disp,
  cluster_rows=F,cluster_cols=F,legend=F,cellwidth=19,cellheight=19,fontsize=9,fontsize_number=8,
  border_color=NA,na_col="gray90",number_color=ifelse(m>.8,"white","black"),
  breaks=seq(0,1,,256),pal)

system("w=`identify -format %w 0.png`;convert 0.png -gravity northwest \\( -splice x16 -size $[w-44]x -pointsize 44 caption:'New COVID cases by day in China (github.com/cheongsa/Coronavirus-COVID-19-statistics-in-China). Each row has its own color scale where the maximum value is shown in black.' -extent $[w-44]x -gravity center \\) +swap -append -bordercolor white -border 6 +repage 1.png")
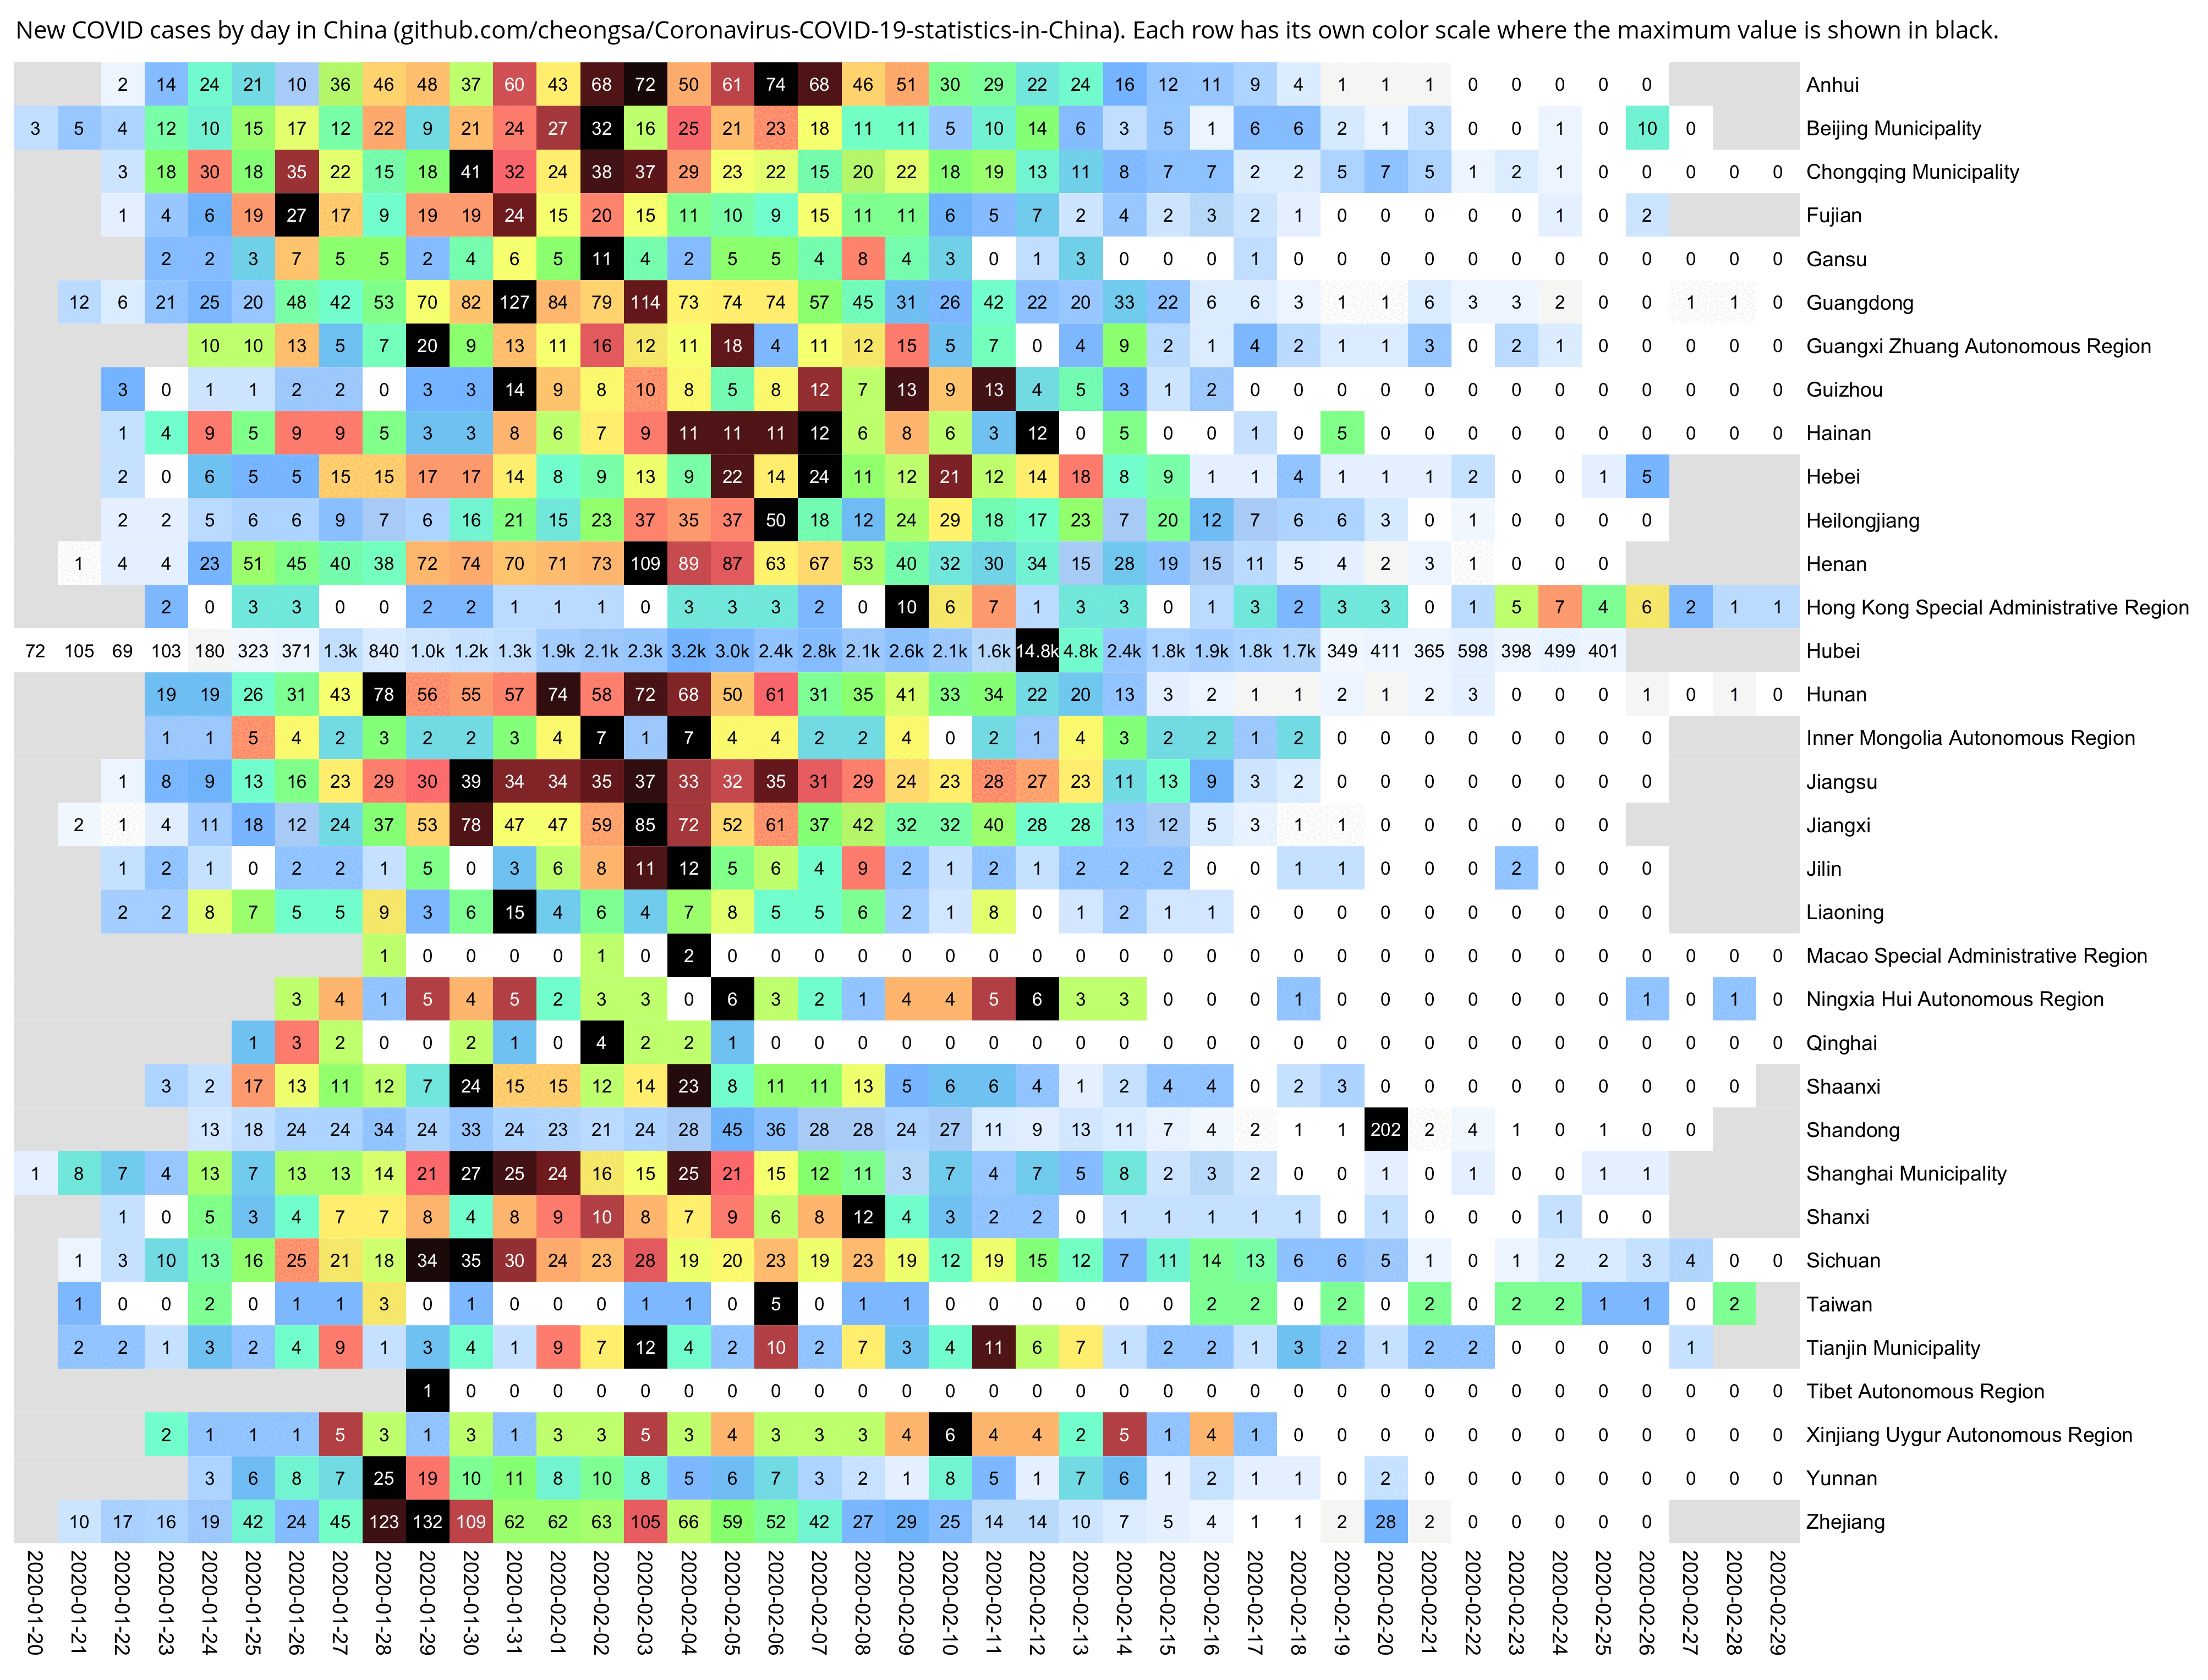
pop=fread("http://sars2.net/f/uspopdead.csv")[year==2019]
age=0:120;n=length(age)
mx=pop[age<100,dead/pop] # cmr
mx=c(mx,pop[age%in%90:99,exp(predict(lm(log(dead/pop)~age),.(age=100:120)))])

qx=pmin(mx/(1+mx/2),1) # probability of dying (cmr adjusted for exposure time)
px=1-qx # probability of surviving
lx=cumprod(c(1e5,px[-n])) # number of survivors
dx=lx*qx # number of deaths
Lx=lx-dx/2 # person-years lived
Tx=rev(cumsum(rev(Lx))) # cumulative person-years remaining
ex=Tx/lx # life expectancy

options(digits=3)
data.frame(age,mx,qx,px,lx,dx,Lx,Tx,ex)[1:10,]
#    age       mx       qx    px     lx    dx    Lx      Tx   ex
# 1    0 0.005604 0.005588 0.994 100000 558.8 99721 7892645 78.9
# 2    1 0.000385 0.000384 1.000  99441  38.2 99422 7792924 78.4
# 3    2 0.000234 0.000234 1.000  99403  23.3 99391 7693502 77.4
# 4    3 0.000177 0.000177 1.000  99380  17.6 99371 7594111 76.4
# 5    4 0.000142 0.000142 1.000  99362  14.1 99355 7494740 75.4
# 6    5 0.000132 0.000132 1.000  99348  13.1 99341 7395385 74.4
# 7    6 0.000121 0.000121 1.000  99335  12.0 99329 7296044 73.4
# 8    7 0.000109 0.000109 1.000  99323  10.8 99317 7196715 72.5
# 9    8 0.000106 0.000106 1.000  99312  10.6 99307 7097397 71.5
# 10   9 0.000106 0.000106 1.000  99302  10.5 99296 6998090 70.5