An old myth got revived in GER around "Bergamo
mass deaths must be a fake because there was no mass death deficit
afterwards"
What gets forgotten is that such a deficit is a) small (4% of the excess with covid) b) mostly taken
care off in mortality trend based expected deaths
First of all: why is the displacement small? Here is the simplest way
to explain it
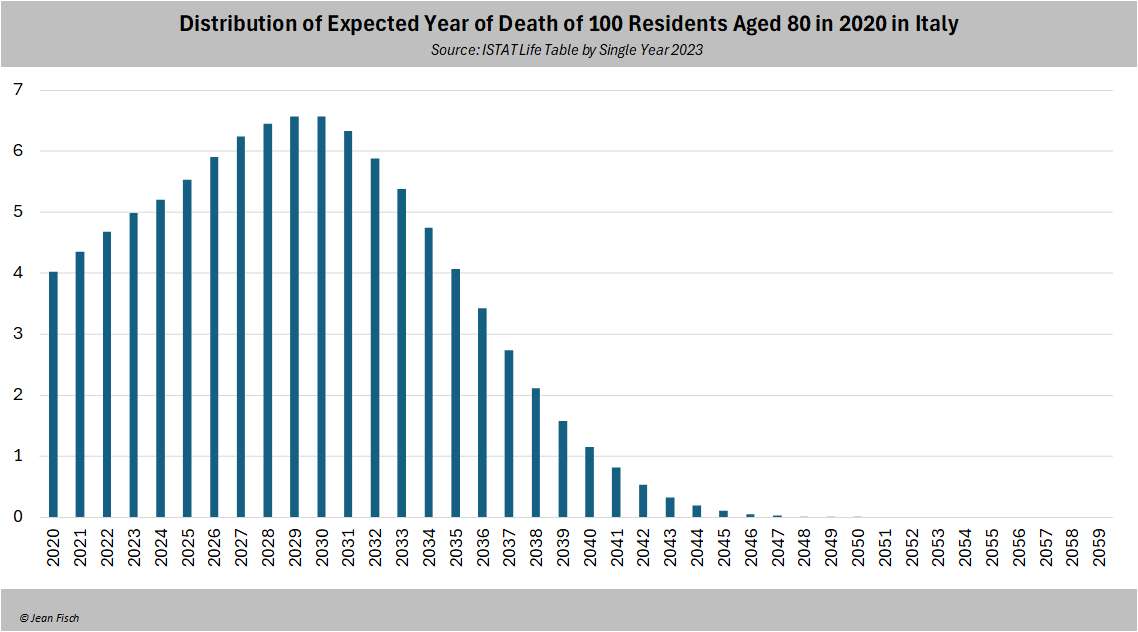
The average age of a covid death in Spring 2020 in Bergamo was 80
If you look at the annual probability of dying in Italy of an 80 yo,
<5% with die aged 81 or 82 (ie in 2021 or 2022
for Bergamo)
If you get now confused because you get 83 years after googling "Life Expectancy Italy", that's because the 83
years is the expectancy at BIRTH
Once you reach 80, your life expectancy is 10 years and that explains
why the stats say that only <5% of 80s old die annually at first
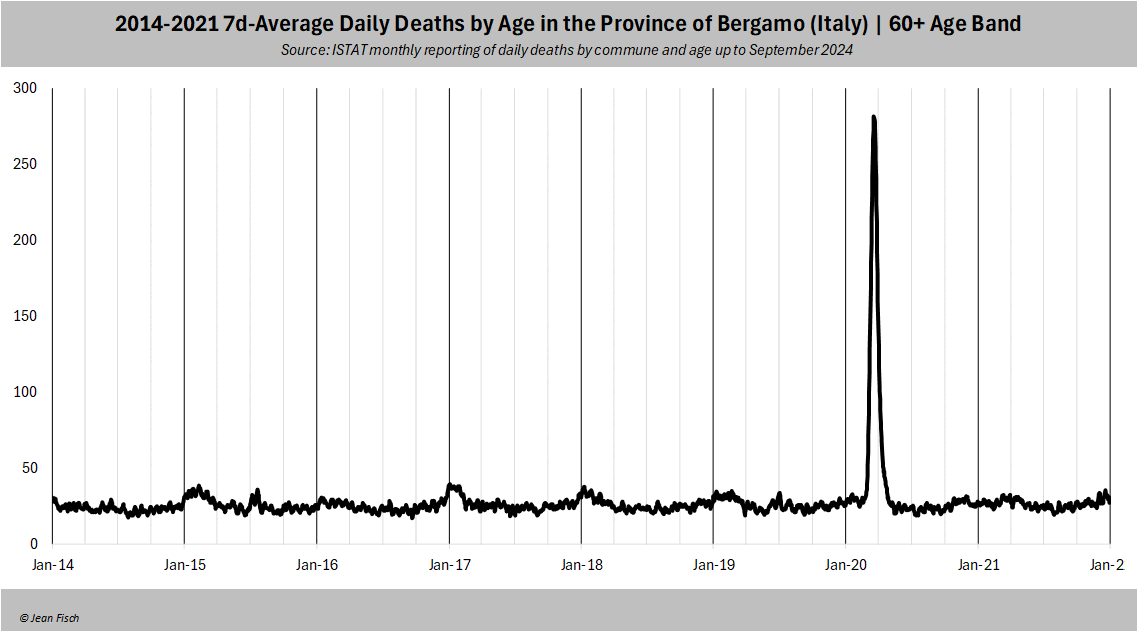
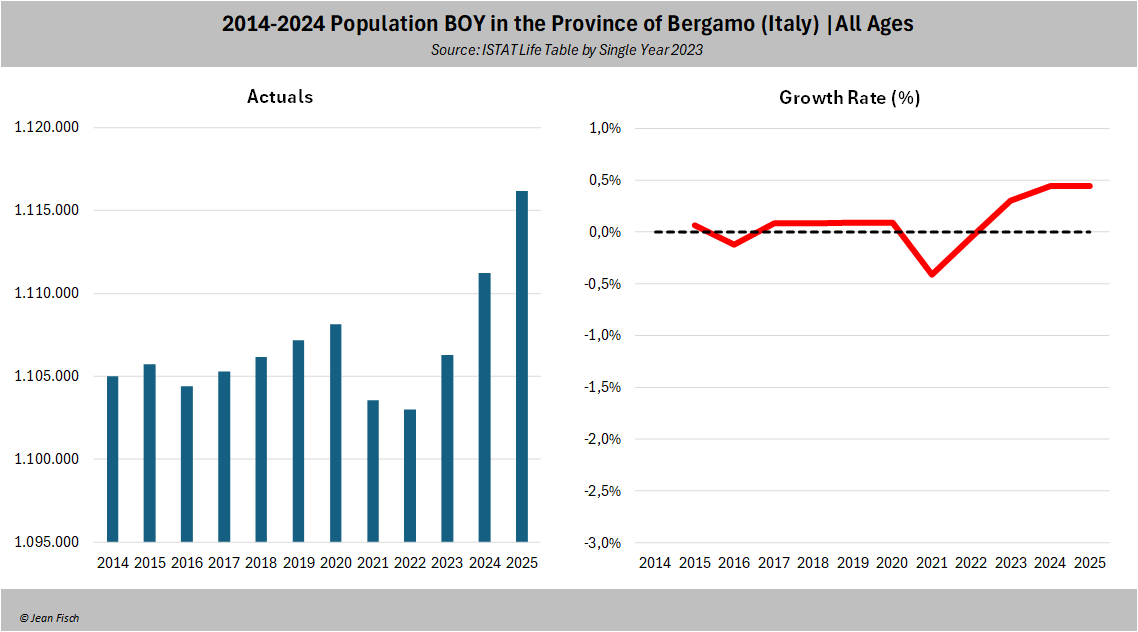
Let's go back to Bergamo: The huge spike of deaths led to 6,000
excess deaths on a usual basis of 10,000 (rounded)
So these 6,000, aged 80 on average, will be "missing" in the death statistics of the following
years and expectations need to be corrected accordingly
How much does make out annually? It means approx. 250-300 fewer
deaths to be expected in 2021-2023 (4-5% of
6,000)
So you see, despite a 60% excess in 2020, stats tell you that there
are ONLY 2.5-3% fewer deaths (ie a tiny %) to
be expected less annually in 2021-2023
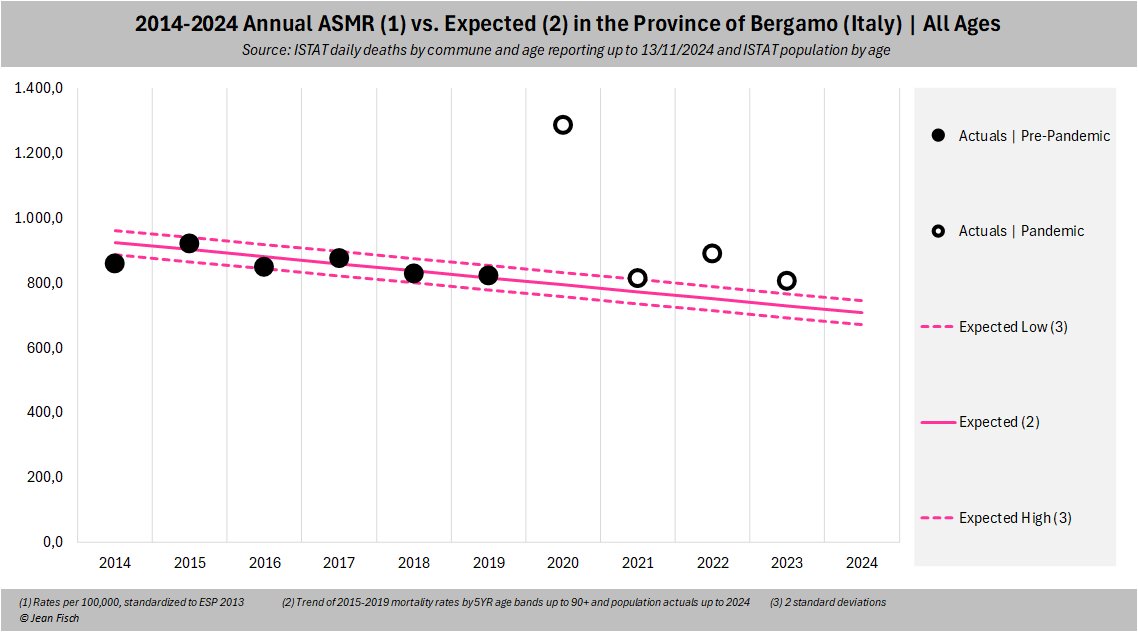
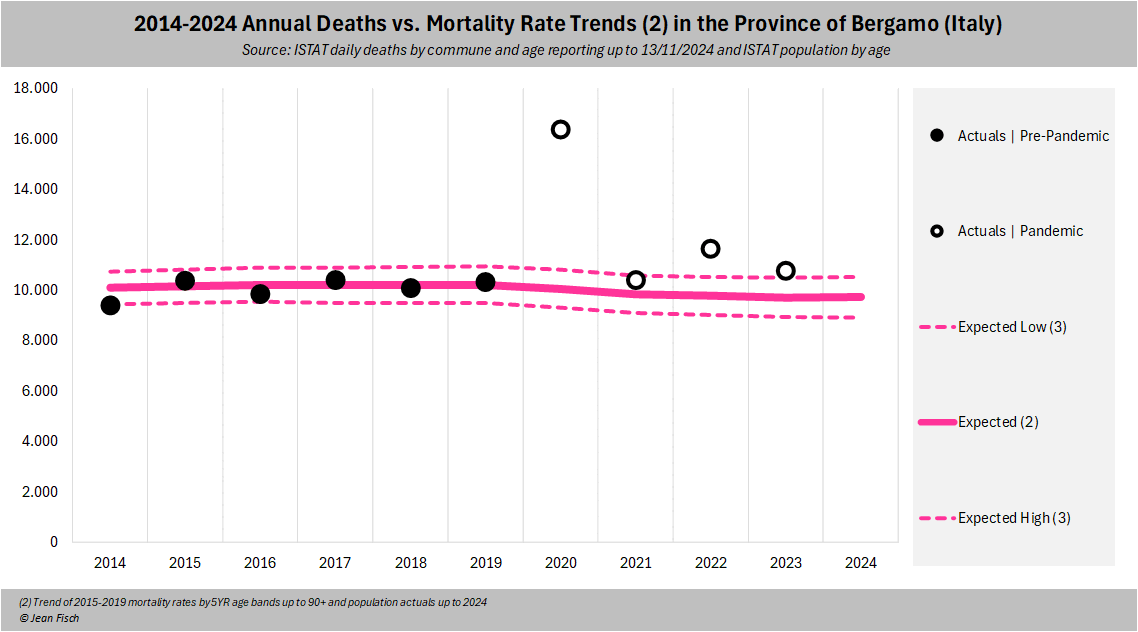
But there is more: Most advanced stats and health institutions
monitor excess mortality against trends from MORTALITY RATES, not
deaths
The reason is that the rate of improvement of mortality rates has
been more or less linear over the past years (so a
good indicator)
What one then does is to multiply these expected mortality rates
(ideally by age band) by population actuals
to get expected deaths
This also has the advantage to automatically incorporate the changes
in age pyramid seen lately in western democracies, especially in old age
bands
But this has the additional advantage that this method for expected
deaths immediately also incorporates a massive excess in one year
Why? Because (here for Bergamo) the
population will be smaller the year there after and the expected deaths
automatically corrected accordingly
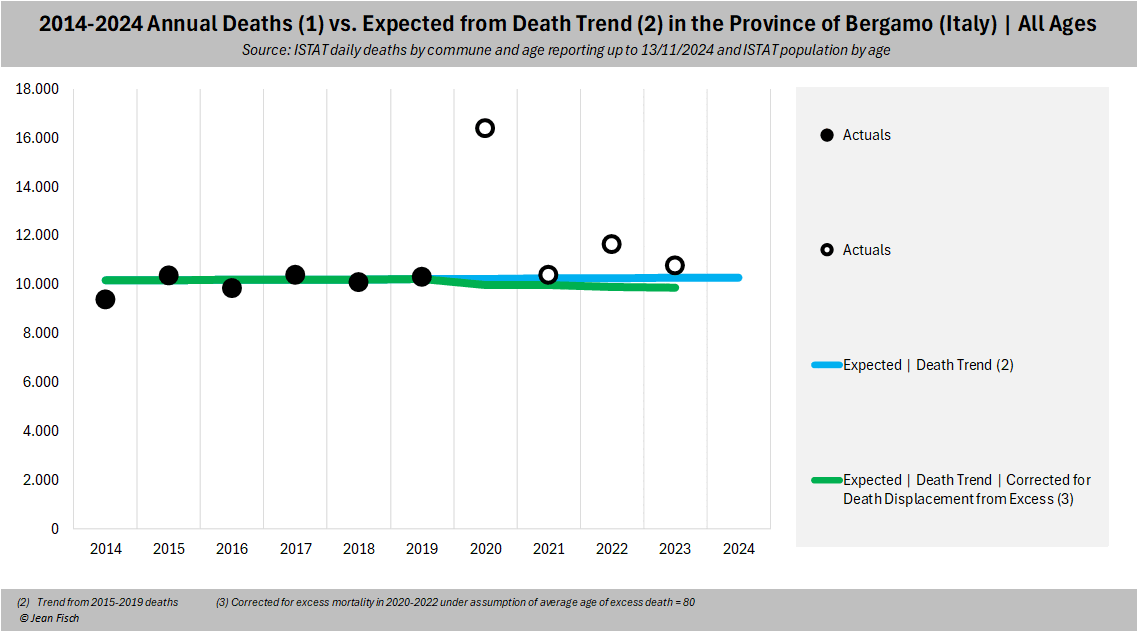
And this is exactly what happens in Bergamo
After an "upwards trend up to 2019",
expected deaths from mortality rates then go down after 2020 due to the
sizeable excess
(also they are roughly the same as the one
calculated using corrected deaths, as they should be)
In summary, there are two "ahas" on death
displacement following excess
TAKEAWAY 1: Views that "Bergamo's huge death peak
is fake because we didn't see a massive deficit in the subsequent
years" are just an expression of a lack of understanding how
mortality works
TAKEAWAY2: In principle, high excess in a year does not require
tweaking the expected deaths thereafter if these were estimated from
mortality trends
I mention this because I see this argument made regularly
FWIW, all my mortality analysis is based on mortality trend
END
I took the 2019 US life table for both sexes combined from the
spreadsheet linked here:
https://www.cdc.gov/nchs/data/nvsr/nvsr70/nvsr70-19.pdf.
I then calculated excess deaths for each age in NYC relative to a
2010-2019 linear trend, but the average life expectancy of the people
who died in excess was about 15 years, even though the average age of
the people who died in excess was about 73. I excluded ages 0 to 15
because they had some years with less than 10 deaths so the number of
deaths was suppressed by CDC WONDER. And even when I excluded all ages
below 50 to reduce the impact of drug deaths, the average life
expectancy remained at about 13 years:
download.file("https://ftp.cdc.gov/pub/Health_Statistics/NCHS/Publications/NVSR/70-19/Table01.xlsx","Table01.xlsx")
t=data.table(readxl::read_excel("Table01.xlsx",skip=2))
t=t[,.(age=as.numeric(sub("\\D.*","",t[[1]])),expectancy=ex)][1:101]# deaths where county of residence was one of 5 counties of NYC at CDC WONDER
dead=fread("http://sars2.net/f/nycyearlydead.csv")[age>=16]
base=dead[year%in%2010:2019,.(year=2020,base=predict(lm(dead~year),.(year=2020))),age]
me=merge(t,merge(base,dead)[,.(excess=dead-base,age)])
me[,weighted.mean(age,excess)]# 73.04446 (average age of excess deaths)
me[,weighted.mean(expectancy,excess)]# 15.1019 (life expectancy for ages 16 and above)
me[age>=50,weighted.mean(expectancy,excess)]# 12.98951 (life expectancy for ages 50 and above)
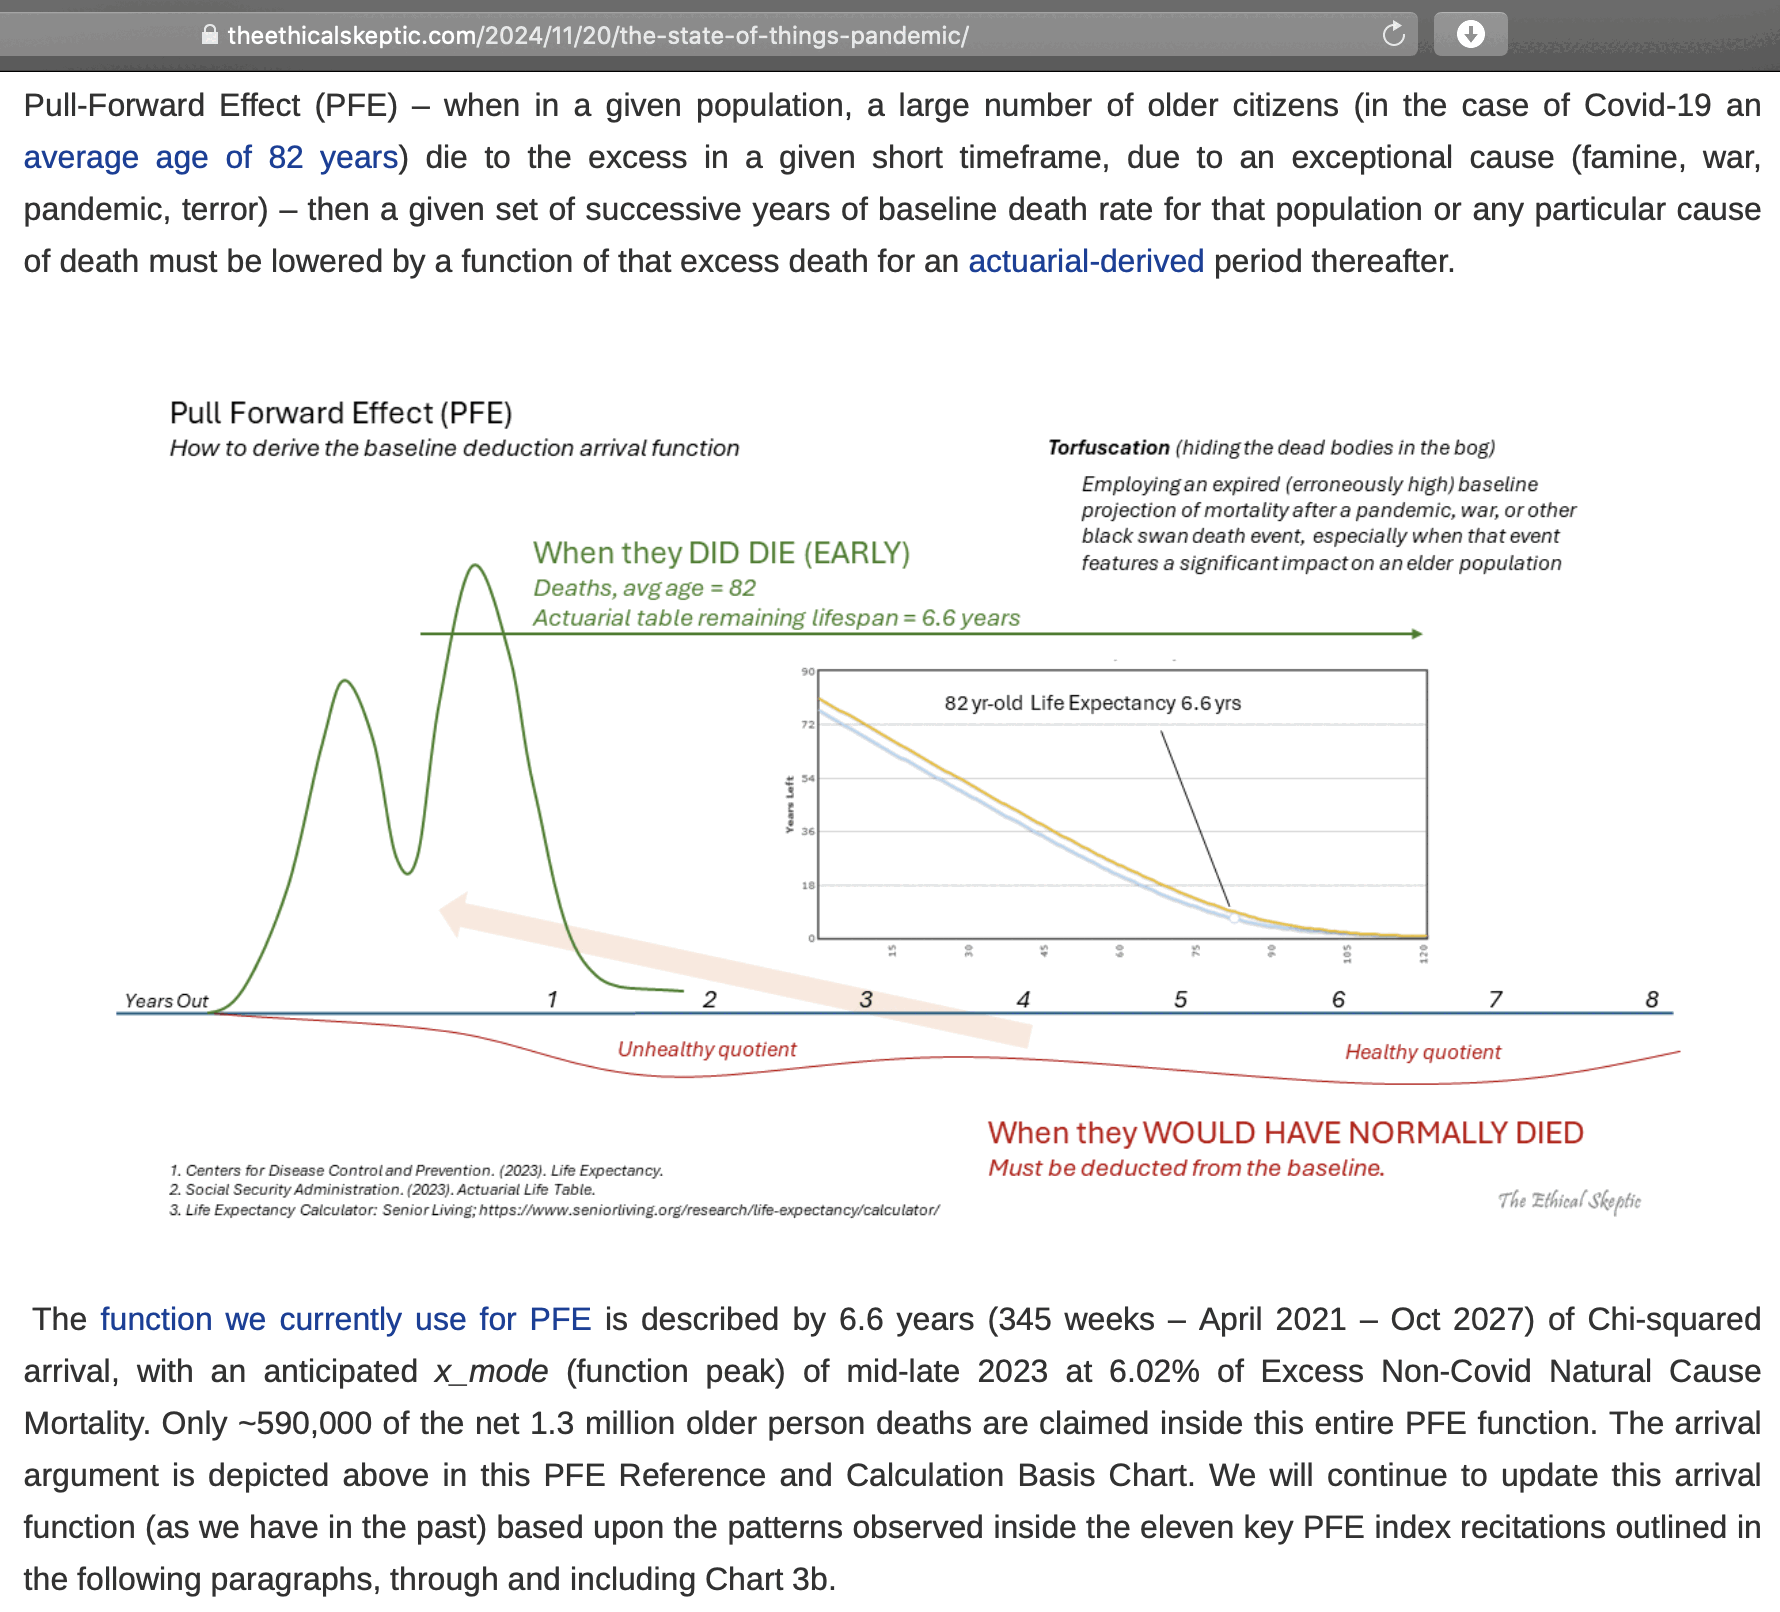
However if the mean life expectancy of people who died in excess in
NYC in 2020 was about 15 years, many of the people aren't expected to
have died even 15 years after 2020, so the PFE adjustment should last
much longer than until the end of October 2027.
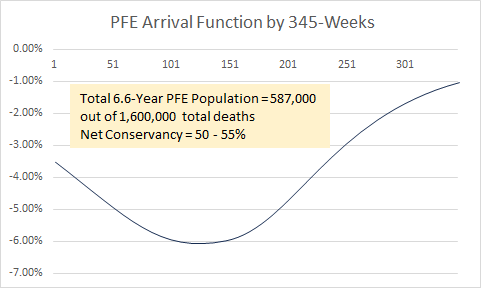
Ethical Skeptic came up with the figure of 6.6 years because he said
the average age of COVID deaths in Florida was 82, and he got a life
expectancy of 6.6 years for age 82 from some unspecified source (even though in the 2019 US life expectancy table the life
expectancy for age 82 is about 8.2 years): [https://theethicalskeptic.com/2024/11/20/the-state-of-things-pandemic/]
At CDC WONDER the average age of UCD COVID deaths was 73.8 in Florida
and about 73.9 in the whole US. And in the 2019 life table the life
expectancy for age 74 is about 13.1 years, so it's about twice as high
as Ethical Skeptic's figure of 6.6 years. And the average of life
expectancies for each age weighted by the number of COVID deaths for the
age was about 14.5 years:
# 2019 life expectancy table for both sexes combined
download.file("https://ftp.cdc.gov/pub/Health_Statistics/NCHS/Publications/NVSR/70-19/Table01.xlsx","Table01.xlsx")
ex=read_excel("Table01.xlsx",skip=2,n_max=101)$ex
# UCD COVID deaths by single year of age from CDC WONDER (last value is age 100 and above)
coviddead=c(363,116,46,41,39,30,38,32,33,47,40,35,41,56,51,97,88,130,162,210,255,288,367,407,499,530,620,707,819,979,1112,1255,1329,1441,1607,1703,1850,2066,2237,2502,2713,2987,3253,3486,3942,4197,4610,4912,5686,6278,7075,7365,8017,8227,8942,9822,11084,11748,12866,14070,15174,16061,17259,18347,19229,20037,20443,20874,22012,22623,23586,24446,25783,27417,27760,26024,26237,27531,28188,27690,27437,27093,27200,27223,26753,26849,26190,25121,24827,24104,22756,21336,19309,17787,15069,12656,10416,8337,6321,4626,8773)
weighted.mean(ex,coviddead)# 14.50457
The following code shows the average life expectancy by month for
deaths with UCD COVID. I now calculated the life expectancy separately
for males and females even though it didn't make much difference. CDC
WONDER suppresses the number of deaths on rows with less than 10 deaths,
so I got the number of COVID deaths from the fixed-width files for the
NVSS data instead:
stat.html#Download_fixed_width_and_CSV_files_for_the_NVSS_data_used_at_CDC_WONDER.
The life expectancy was unsurprisingly much higher in 2021 than 2020
(which is because the percentage of COVID deaths in
2021 relative to 2020 is much higher in working-age people than in
elderly people, which might be because in 2021 working-age people were
less likely to be vaccinated than elderly people):
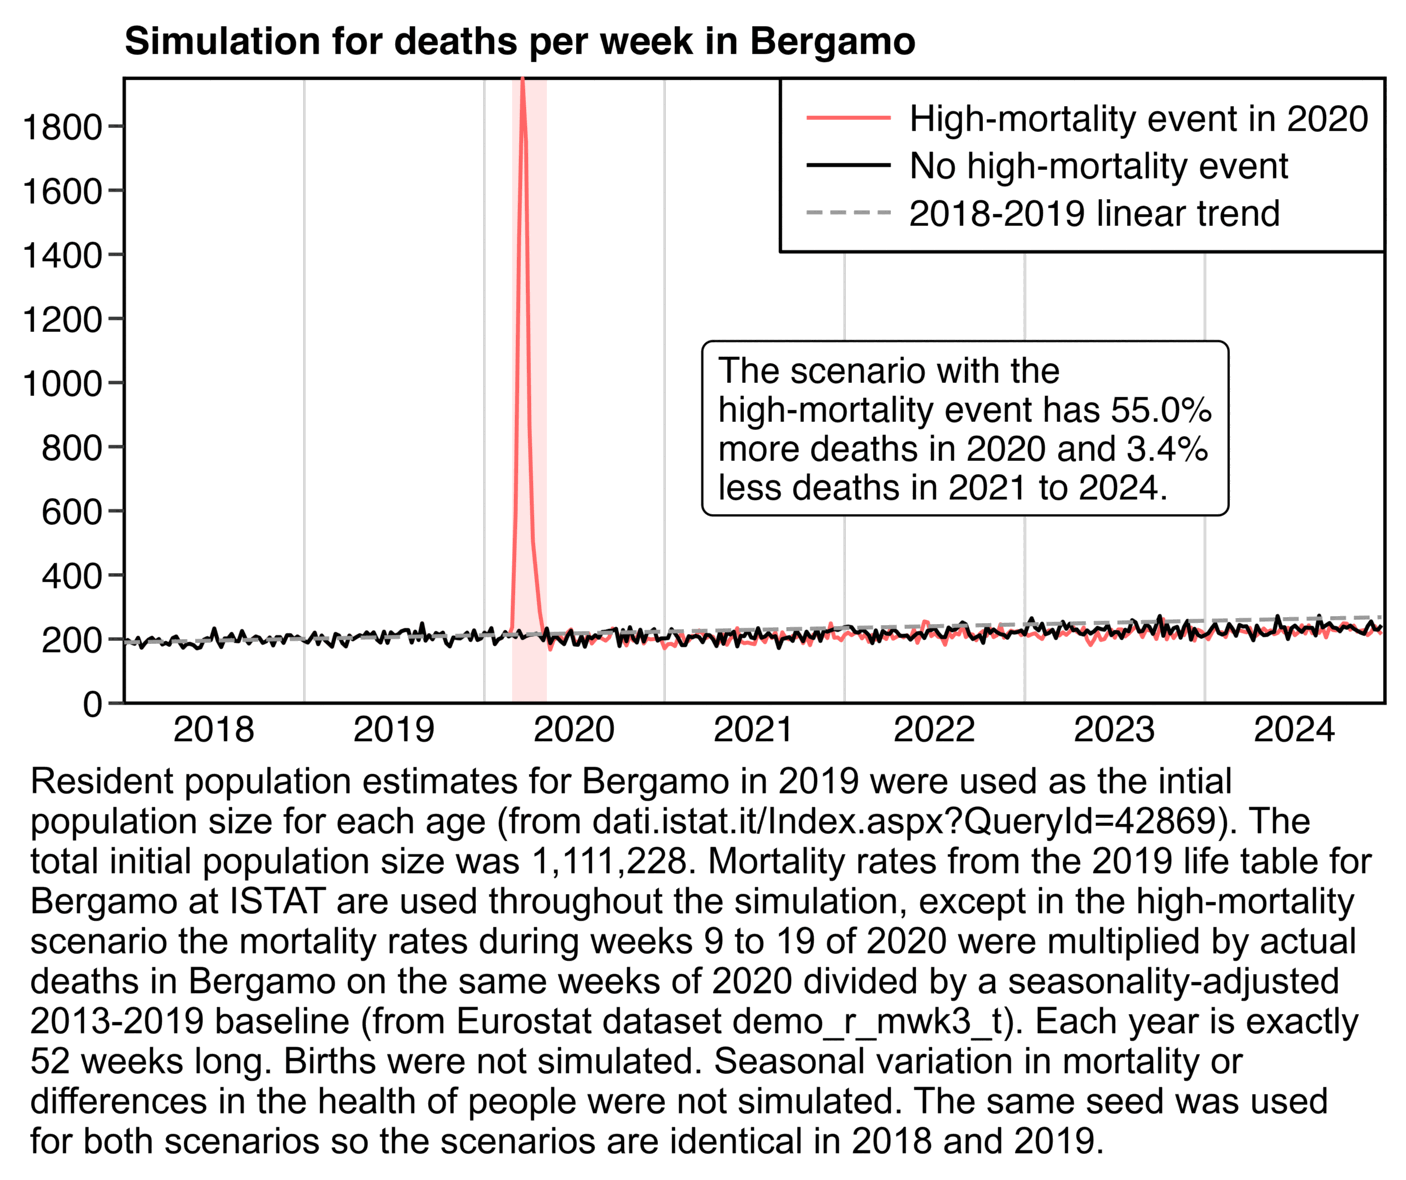
Next I made the simulation below using data from ISTAT and Eurostat:
http://dati.istat.it/Index.aspx?QueryId=42869&lang=en,
https://ec.europa.eu/eurostat/api/dissemination/sdmx/2.1/data/demo_r_mwk3_t?format=TSV.
At first I also tried simulating different people having different
levels of health, but I didn't find an accurate way to do it so I left
it out of the simulation. When I simply assigned a fixed health
multiplier to each person, the people with poor health tended to die at
the start of the simulation which artificially elevated deaths at the
start of the simulation compared to the end of the simulation. So I
should've also modeled the health status of people getting worse over
time so that over time new people would've gradually entered the verge
of death, but it seemed too difficult to model realistically. But
anyway, here in the red scenario where I simulated a spike in excess
deaths in spring 2020, I got only about 3.4% less deaths in 2021-2024
than in the black scenario without the spike: