Comments to no-virus-lite/no-pandemic/neo-Duesbergian theorists - sars2.net

Peter Duesberg said that HIV has been isolated and sequenced but that HIV is a harmless passenger virus which is not the cause of AIDS. I have coined the term "neo-Duesbergians" to refer to the Duesbergian camp of COVID theorists who claim that the SARS2 virus was not the cause of the deaths that were attributed COVID, even though the neo-Duesbergians either say that the SARS2 virus exists, or that it is not important if the virus exists or not, or that they don't know if the virus exists or not. I have also referred to the same group of people as the "no-pandemic" camp since one of their mantras is that there was no COVID pandemic, and I have referred to them as the "no-virus-lite" camp, because they hold many of the same views as the people who claim that viruses do not exist, and because a few luminaries of the camp like J.J. Couey and Mike Yeadon have said that they became enlightened about the lack of a pandemic after they looked into what the no-virus people were saying, and Couey has specifically said that the no-virus people are right about a lot of things but that he wanted to create a more nuanced version of their theory. I have also called the same group of people the Scooby Crew since many of them are followers of J.J. Couey, and I started to also call them PANDATArds after PANDA's chairman Nick Hudson became a champion of the no-pandemic theory.

People from the no-pandemic camp have suggested that the deaths attributed to COVID were caused by vaccines, by ventilators, by drugs like Remdesivir or midazolam, by rebranded influenza, by bacterial pneumonia, by a reduced prescription of antibiotics, by a release of synthetic cDNA clones (like J.J. Couey), by psychological stress caused by social isolation (like Denis Rancourt), by heat waves in the summer (like Rancourt), by opioid overdoses (like Housatonic), by nanoparticle bioweapons (like Sasha Latypova and Karen Kingston), by some kind of a release of toxins (like Latypova), or by an aerosol attack of bat vaccines which only contained the spike protein but not the full virus (like Kingston).

This HTML file consists of my comments to people who claim that the deaths attributed to COVID were not caused by a virus.

Contents

Reasons why SARS2 was a novel virus and not in widespread circulation before 2020

No complete genome published at GenBank before 2020 has over 90% nucleotide identity with Wuhan-Hu-1

A common cutoff for determining whether two viruses belong to the same species or not is whether the whole genome sequences of the viruses have over 90% nucleotide identity.

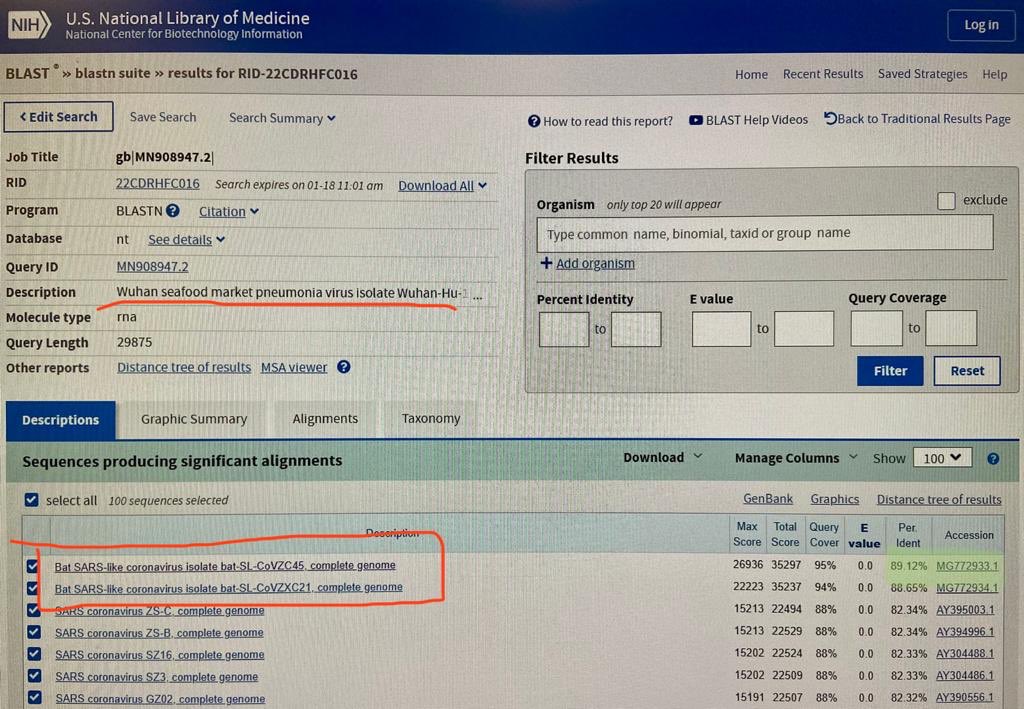
If in January 2020 you did a BLAST search for the genome of SARS2, the best match was the bat virus ZC45, which has about 88% identity with Wuhan-Hu-1 if you ignore positions where either sequence has a gap. For example in a tweet on January 18th 2020 UTC, Dinggang Wang posted the following photo of a BLAST search for the genome of SARS2: [https://web.archive.org/web/20200118155832/https://twitter.com/ding_gang/status/1218547052084441088]

There is no full genome sequence of a virus which was published at GenBank before 2020 and which has over 90% nucleotide identity with Wuhan-Hu-1 (unless there is some secret genome sequence which had been deleted before early 2020 and which was never discovered by COVID researchers). The RdRp sequence of RaTG13 was published at GenBank in 2016 but it is not a full genome. [https://www.ncbi.nlm.nih.gov/nuccore/983856042] The Malayan pangolin sequence MP789 has about 90.2% nucleotide identity with Wuhan-Hu-1 if you ignore positions where either sequence has a gap, and even though MP789 was already described in the Liu et al. paper which was published in October 2019, MP789 wasn't submitted to GenBank until 2020. So it doesn't count either.

The following code downloads sarbecoviruses with a publication date in 2019 or earlier from GenBank, and it then does a multiple sequence alignment of the viruses along with Wuhan-Hu-1, and it calculates the percentage identity of each virus to Wuhan-Hu-1 so that positions where either sequence has a gap are ignored. You can see that ZC45 ranks highest with about 88.11% identity (even though if you do a pairwise alignment of only ZC45 and Wuhan-Hu-1, they get about 88.15% identity):

$ brew install seqkit mafft
[...]
$ curl ftp://ftp.ncbi.nlm.nih.gov/entrez/entrezdirect/install-edirect.sh|sh
[...]
$ curl -s 'https://eutils.ncbi.nlm.nih.gov/entrez/eutils/efetch.fcgi?db=nuccore&rettype=fasta&id=MN908947.3'>sars2.fa
$ esearch -db nuccore -query '(viruses[filter] AND sarbecovirus) 0:2019[dp]'|efetch -format fasta>sarbe19.fa
$ seqkit seq -m 25000 sarbe19.fa|cat sars2.fa -|mafft --thread 4 --reorder ->sarbe19.aln
[...]
$ pid1()(seqkit fx2tab "$@"|awk -F\\t 'NR==1{split($2,a,"");l=length;next}{split($2,b,"");d=0;n=0;for(i=1;i<=l;i++)if(a[i]!="-"&&b[i]!="-"){n++;if(a[i]!=b[i])d++}print 100*(1-d/n),$1}')
$ pid1 sarbe19.aln|sort -rn|head
88.1114 MG772933.1 Bat SARS-like coronavirus isolate bat-SL-CoVZC45, complete genome
88.0757 MG772934.1 Bat SARS-like coronavirus isolate bat-SL-CoVZXC21, complete genome
80.5101 KF294457.1 Bat SARS-like coronavirus isolate Longquan-140 orf1ab polyprotein, spike glycoprotein, envelope protein, membrane protein, and nucleocapsid protein genes, complete cds
80.1549 AY395002.1 SARS coronavirus LC5, complete genome
80.1549 AY395001.1 SARS coronavirus LC4, complete genome
80.1549 AY395000.1 SARS coronavirus LC3, complete genome
80.1514 AY394999.1 SARS coronavirus LC2, complete genome
80.0401 EU371564.1 SARS coronavirus BJ182-12, complete genome
79.979 EU371563.1 SARS coronavirus BJ182-8, complete genome
79.979 EU371561.1 SARS coronavirus BJ182b, complete genome
$ seqkit grep -nrp 'ZC45.*complete' sarbe19.fa|cat sars2.fa -|mafft --quiet --thread 4 -|pid1
88.1459 MG772933.1 Bat SARS-like coronavirus isolate bat-SL-CoVZC45, complete genome

MERS-CoV was also called a novel coronavirus

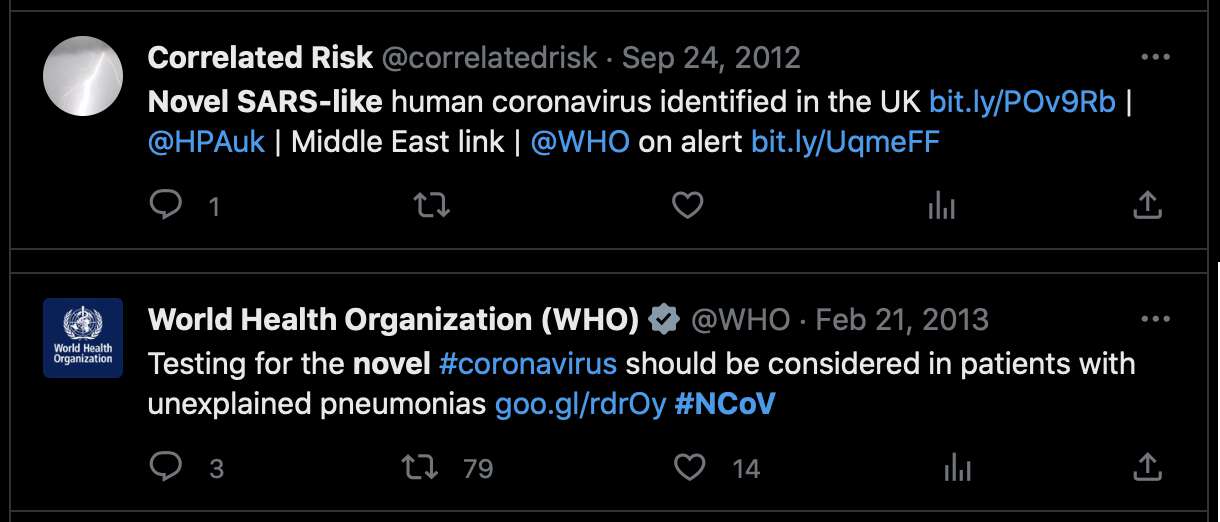
If SARS-CoV-2 was not a novel virus, then was MERS-CoV not novel either? For about half a year until MERS-CoV was named, it used to be called "novel coronavirus" or "nCoV" or even "novel SARS-like coronavirus": [https://x.com/search?q=%28ncov+or+%22novel+sars-like%22%29+until%3A2013-5-1&f=live]

Other merbecoviruses like HKU4 and HKU5 had been discovered before MERS-CoV, but MERS-CoV has only about 71% identity with HKU4 and HKU5. So the reason why MERS-CoV was called a novel virus was because it actually represented a newly-described species of virus.

The number of mutations in early SARS2 sequences supports a date of divergence in late 2019

If SARS2 would have been in widespread circulation long before 2020, then the genomes of SARS2 samples collected in early 2020 would be more diverse, except perhaps in the scenario where the earlier undocumented strains would've been replaced by the Wuhan strain, like how Omicron ended up replacing pre-Omicron strains.

But actually there's 54 SARS2 sequences that were submitted to GISAID in January 2020, but only 2 samples have more than 10 mutations from Wuhan-Hu-1, and even those are likely to be the result of sequencing or assembly errors:

$ curl https://sars2.net/f/gisaid2020.tsv.xz|xz -dc>gisaid2020.tsv
$ awk -F\\t '$3~"2020-01"&&$10=="Human"' gisaid2020.tsv|cut -f3-8,11-13|tr \\t \|
2020-01-11|2019-12-24|B|China|Hubei|Wuhan|3|A3778G,A8388G,T8987A|
2020-01-30|2019-12-26|B|China|Hubei|Wuhan|2|C6968A,T11764A|
2020-01-10|2019-12-30|B|China|Hubei|Wuhan|0||
2020-01-10|2019-12-30|B|China|Hubei|Wuhan|2|G20670A,G20679A|
2020-01-11|2019-12-30|B|China|Hubei|Wuhan|0||
2020-01-18|2019-12-30|B|China|Hubei|Wuhan|2|G21316A,A24325G|
2020-01-18|2019-12-30|B|China|Hubei|Wuhan|2|G7016A,A21137G|
2020-01-18|2019-12-30|B|China|Hubei|Wuhan|0||
2020-01-18|2019-12-30|B|China|Hubei|Wuhan|2|A8001C,C9534T|
2020-01-19|2019-12-30|B|China|Hubei|Wuhan|1|T21656A|
2020-01-21|2019-12-30|B|China|Hubei|Wuhan|0||
2020-01-21|2019-12-30|B|China|Hubei|Wuhan|1|T6996C|
2020-01-21|2019-12-30|B|China|Hubei|Wuhan|6|T104A,T111C,T112G,C119G,T120C,G124A|
2020-01-12|2019-12-31|B|China|||0||
2020-01-30|2019-12-31|Unassigned|China|Wuhan||25|C344T,T445A,G1167C,G2408T,C2881A,G4127T,A4426C,T6000A,C6593T,A6948G,C8320T,T10061C,T10062G,G10610T,G12311T,C12318G,G12332T,G12338C,G12345T,T12346G,G13445C,A14052T,T14073A,C23730T,T25535A|20618-20622,26170-26182
2020-01-11|2020-01-01|B|China|Hubei|Wuhan|2|C27493T,C28253T|
2020-01-21|2020-01-01|B|China|Hubei|Wuhan|1|G7866T|
2020-01-30|2020-01-01|B|China|Hubei|Wuhan|0||
2020-01-23|2020-01-02|B|China|Hubei|Wuhan|0||
2020-01-30|2020-01-05|A|China|Hubei|Wuhan|3|C16T,C8782T,T28144C|
2020-01-17|2020-01-08|B|Thailand|Nonthaburi||0||
2020-01-24|2020-01-10|A|China|Guangdong|Shenzhen|3|C8782T,T28144C,C29095T|
2020-01-24|2020-01-11|A|China|Guangdong|Shenzhen|5|C8782T,C9561T,T15607C,T28144C,C29095T|
2020-01-17|2020-01-13|B|Thailand|Nonthaburi||0||
2020-01-29|2020-01-13|A|China|Guangdong|Shenzhen|27|C1648T,T2169C,A3801C,A4644G,G4656C,G4728T,T4729A,T4739C,T5464C,A6308G,C6786G,T6834G,A6838G,T8091A,T8455C,T12597A,T15636A,C19269T,T20315A,G24947C,A25347G,A26108T,A26141T,G26755C,A26759T,T28144C,C29095T|
2020-01-29|2020-01-13|A|China|Guangdong|Shenzhen|3|C8782T,T28144C,C29095T|
2020-01-16|2020-01-14|Unassigned|Japan|Kanagawa||0||
2020-01-22|2020-01-14|A|China|Guangdong|Shenzhen|3|C8782T,T28144C,C29095T|
2020-01-22|2020-01-15|A|China|Guangdong|Shenzhen|3|C8782T,T28144C,C29095T|
2020-01-22|2020-01-15|B|China|Guangdong|Shenzhen|1|T23569C|
2020-01-22|2020-01-15|A|China|Guangdong|Shenzhen|3|C8782T,T28144C,C29095T|
2020-01-21|2020-01-16|B|China|Zhejiang||2|A31G,C583T|
2020-01-29|2020-01-16|B|China|Guangdong|Shenzhen|2|C27577T,C28854T|
2020-01-29|2020-01-16|B|China|Guangdong|Shenzhen|9|G709A,T6846C,A11707G,A19959C,A22622G,G22652T,T23569C,T25645C,C28716T|
2020-01-22|2020-01-17|B|China|Guangdong|Zhuhai|1|C21707T|
2020-01-21|2020-01-17|B|China|Zhejiang||0||
2020-01-22|2020-01-18|B|China|Guangdong|Zhuhai|1|C21707T|
2020-01-24|2020-01-19|A|USA|Washington|Snohomish County|3|C8782T,C18060T,T28144C|
2020-01-25|2020-01-21|B|USA|Illinois|Chicago|0||
2020-01-27|2020-01-22|B|USA|California|Orange County|2|C17000T,G26144T|
2020-01-28|2020-01-22|A|USA|Arizona|Phoenix County|4|C8782T,G11083T,T28144C,C29095T|
2020-01-29|2020-01-22|B|China|Guangdong|Zhuhai|1|C21707T|
2020-01-29|2020-01-22|B|China|Guangdong|Guangzhou|2|C15324T,C29303T|
2020-01-29|2020-01-22|B|China|Guangdong|Foshan|2|C28291T,C28854T|
2020-01-29|2020-01-22|B|China|Guangdong|Foshan|1|C17373T|
2020-01-27|2020-01-23|B|Taiwan|Kaohsiung||4|G16188T,A25964G,G26144T,A29877T|
2020-01-27|2020-01-23|A|USA|California|Los Angeles County|7|G1548A,C8782T,C24034T,T26729C,G28077C,T28144C,A28792T|
2020-01-29|2020-01-23|B|China|Guangdong||0||
2020-01-29|2020-01-23|B|France|Île-de-France|Paris|2|G22661T,G26144T|
2020-01-31|2020-01-25|B|Australia|Victoria|Clayton|3|T19065C,T22303G,G26144T|29750-29759
2020-01-31|2020-01-28|B.1|Germany|Bavaria|Munich|3|C241T,C3037T,A23403G|

In the output above, the first column shows the publication date, the second column shows the collection date, the seventh column shows the number of nucleotide changes from Wuhan-Hu-1, and the eighth column shows the list of nucleotide changes from Wuhan-Hu-1. There's two samples with more than 10 mutations from Wuhan-Hu-1. The other sample is EPI_ISL_406799 which has 25 mutations, but 22 of them are not found in any other sample submitted before April 2020, and there's also 8 inserted segments which are likely the result of sequencing errors, since there normally wouldn't be such a high ratio of inserts to spot mutations, and the length of most inserts is not even a multiple of 3 so the inserts would result in frameshifts. The other sample is EPI_ISL_406592 which has 27 mutations, but 21 of the mutations are not found in any other sample submitted before April 2020, so they may have been something like the result not using a MAPQ cutoff when doing variant calling, and many of the mutations appear at nearby positions (like 4728, 4729, and 4739; 6834 and 6838; and 26755 and 26759), so the mutations may have been the result of doing global alignment without adapter trimming or without trimming low-quality bases from the ends of reads.

Kumar et al. reconstructed an ancestor of known strains of SARS2, which they called proCoV2 and which has only 3 mutations relative to Wuhan-Hu-1, which are C8782T, C18060T, and T28144C. [https://academic.oup.com/mbe/article/38/8/3046/6257226] The identical set of three mutations is found in the WA1 sample, which is supposed to have come from the first known COVID patient in the US who has become known as the "Snohomish County man". Based on a linear regression for the number of mutations from proCoV2/WA1 in GISAID samples collected in 2020, the date of divergence between known strains of SARS-CoV-2 would be around early September 2019 (even though the trend in early 2020 doesn't actually seem to be linear, and in the plot below if you imagine drawing a curved regression line based on the distribution of points in early 2020, it would appear to cross the x-axis closer to the end of 2019):

Sequencing labs use a procedure to scan reads for pathogenic microorganisms like SARS1

In the WeChat article where Winjor Small Mountain Dog wrote about how he discovered the genome of SARS2 in December 2019, he wrote that their lab used an automatic procedure where they scanned sequencing reads for the presence of pathogenic microorganisms, so he found that one sample they sequenced matched SARS1: [https://www.researchgate.net/profile/Gilles-Demaneuf/publication/360313016_Sequencing_and_early_analysis_of_SARS-CoV-2_27_Dec_2019%5f%2d%5fThe_crushed_hopes_of_Little_Mountain_Dog_of_Vision_Medicals_China/links/626fa7afb1ad9f66c89a1d13/Sequencing-and-early-analysis-of-SARS-CoV-2-27-Dec-2019-The-crushed-hopes-of-Little-Mountain-Dog-of-Vision-Medicals-China.pdf]

However a similar procedure is also used in other labs around the world, so if SARS2 had been in widespread circulation in humans long before 2020, it would've also been detected by other sequencing labs. And the SARS1 epidemic is supposed to have died out in 2005, so it would be major news if a new virus similar to SARS1 was detected in humans.

Sarbecovirus reads are rare before 2020 at the NCBI's Sequence Read Archive

J.J. Couey has been saying that sarbecoviruses may have been endemic in humans before 2020, so the PCR tests for COVID were not necessarily picking up any novel virus in 2020, since the reason why the sarbecoviruses were not detected earlier may have been that they were not tested for earlier.

JC may came up with the theory because in some PCR protocols there is one primer set which is designed to match other sarbecoviruses in addition to SARS2, and in the Corman-Drosten protocol, there's actually three primer sets which are all designed to match SARS1 and some other sarbecoviruses in addition to SARS2, even though the third primer set has two different probes where the second probe is designed to only match SARS2.

However JC's theory is probably wrong, because even though the NCBI's Sequence Read Archive contains about 11 million of genetic sequencing runs that were published before 2020, and even though there's many metagenomic sequencing runs of human lung samples or respiratory samples, and there's many RNA-Seq runs that contain reads from all kinds of viruses, there's only a handful of runs that were published before 2020 and that match sarbecoviruses.

The sequencing runs at the SRA have been analyzed with STAT (Sequence Read Archive Taxonomic Analysis Tool), which counts how many reads have 32-base k-mer matches to different organisms in a taxonomical tree.

The SQL table which shows how many STAT hits each SRA run has is about 500 GB big, but you can run queries within the table on Google Cloud Platform. [https://www.ncbi.nlm.nih.gov/sra/docs/sra-bigquery/] I ran this query which selected runs with at least one SARS2 read that were published in February 2022 or earlier:

select * from `nih-sra-datastore.sra.metadata` as m, `nih-sra-datastore.sra_tax_analysis_tool.tax_analysis` as tax where m.acc=tax.acc and tax_id=2697049 and total_count>=1 and releasedate<"2020-03-01" order by releasedate

I saved the resulting JSON file with one object per line to Google Drive. For example this downloads the JSON file and displays runs from 2019 with at least 100 matching reads:

curl -Lso bigquerysars2.json 'https://drive.google.com/uc?export=download&id=1X_8oLCKQ8cgEs5zv5WKBGWVkm4BTJsYK'
jq -sr '.[]|[.acc,.sra_study,.total_count,.mbytes,.avgspotlen,.organism,(.releasedate|sub(" .*";"")),.assay_type,.center_name]|join("|")' bigquerysars2.json|awk -F\| '$3>=100&&$7~/2019/'

There were a total of 1,252 runs from before March 2020 that had at least 100 reads with a STAT hit for SARS2. The oldest runs were from 2011. I tried downloading the first 100,000 reads from all runs so that forward and reverse reads are interleaved. I then aligned the reads against a version of Wuhan-Hu-1 with the poly(A) tail removed:

brew install jq parallel sratoolkit seqkit bowtie samtools
vdb-config # configure sratoolkit to use fastq-dump
mkdir scan;jq -sr '.[]|[.acc,.total_count]|@tsv' bigquerysars2.json|awk '$2>=100'|cut -f1|parallel -j10 fastq-dump -X 100000 -O scan --gzip {}
curl 'https://eutils.ncbi.nlm.nih.gov/entrez/eutils/efetch.fcgi?db=nuccore&rettype=fasta&id=MN908947.3'>sars2.fa
seqkit subseq -r 1:-34 sars2.fa>sars2nopolya.fa
bowtie2-build sars2nopolya.fa{,}
for x in scan/*;do bowtie2 -p3 -x sars2nopolya.fa -U $x --no-unal|samtools sort -@2>${x%%.*}.bam;done
for x in scan/*.bam;do n=${x##*/};samtools view -c $x|sed $'s/$/\t'${n%.*}/;done|awk '$1>0'|awk -F\\t 'NR==FNR{a[$1]=$0;next}{print$1 FS a[$2]}' <(jq -sr '.[]|[.acc,.sra_study,..mbytes,,.organism,(.releasedate|sub(" .*";"")),.assay_type,.center_name]|@tsv' bigquerysars2.json) ->alncount
sort -t$'\t' -k8 alncount|tr \\t \|

The output shows that there was one or more aligned read in only 49 out of the 1,252 runs (the columns are the number of aligned reads, run ID, BioProject ID, size of read files in megabytes, host species, date published at SRA, assay type, and name of sequencing center):

1|SRR1194940|SRP040072|3489|Chlorocebus aethiops|2014-03-21|RNA-Seq|UMIGS
1|SRR1195026|SRP040072|3791|Chlorocebus aethiops|2014-03-21|RNA-Seq|UMIGS
1|SRR1195112|SRP040072|6919|Chlorocebus aethiops|2014-03-21|RNA-Seq|UMIGS
1|SRR1195366|SRP040072|3976|Chlorocebus aethiops|2014-03-21|RNA-Seq|UMIGS
1|SRR1195445|SRP040072|6372|Chlorocebus aethiops|2014-03-21|RNA-Seq|UMIGS
1|SRR1195446|SRP040072|6293|Chlorocebus aethiops|2014-03-21|RNA-Seq|UMIGS
1|SRR1195532|SRP040072|5222|Chlorocebus aethiops|2014-03-21|RNA-Seq|UMIGS
1|SRR1195711|SRP040072|3528|Chlorocebus aethiops|2014-03-21|RNA-Seq|UMIGS
1|SRR1195791|SRP040072|6046|Chlorocebus aethiops|2014-03-21|RNA-Seq|UMIGS
2|SRR1195276|SRP040072|3510|Chlorocebus aethiops|2014-03-21|RNA-Seq|UMIGS
2|SRR1195278|SRP040072|3623|Chlorocebus aethiops|2014-03-21|RNA-Seq|UMIGS
2|SRR1195365|SRP040072|3814|Chlorocebus aethiops|2014-03-21|RNA-Seq|UMIGS
2|SRR1195531|SRP040072|5307|Chlorocebus aethiops|2014-03-21|RNA-Seq|UMIGS
2|SRR1195542|SRP040072|5533|Chlorocebus aethiops|2014-03-21|RNA-Seq|UMIGS
2|SRR1195587|SRP040072|3382|Chlorocebus aethiops|2014-03-21|RNA-Seq|UMIGS
2|SRR1195588|SRP040072|3353|Chlorocebus aethiops|2014-03-21|RNA-Seq|UMIGS
2|SRR1195790|SRP040072|6143|Chlorocebus aethiops|2014-03-21|RNA-Seq|UMIGS
3|SRR1195710|SRP040072|3566|Chlorocebus aethiops|2014-03-21|RNA-Seq|UMIGS
3|SRR1195757|SRP040072|3502|Chlorocebus aethiops|2014-03-21|RNA-Seq|UMIGS
4|SRR1195712|SRP040072|3682|Chlorocebus aethiops|2014-03-21|RNA-Seq|UMIGS
5|SRR1195113|SRP040072|7213|Chlorocebus aethiops|2014-03-21|RNA-Seq|UMIGS
1|SRR1030053|SRP033021|7037|Mus musculus|2014-05-05|RNA-Seq|GEO
1|SRR1030054|SRP033021|8565|Mus musculus|2014-05-05|RNA-Seq|GEO
1|SRR1030105|SRP033021|5356|Mus musculus|2014-05-05|RNA-Seq|GEO
1|SRR1030132|SRP033021|5108|Mus musculus|2014-05-05|RNA-Seq|GEO
1|SRR1030137|SRP033021|4505|Mus musculus|2014-05-05|RNA-Seq|GEO
1|SRR1030172|SRP033021|6125|Mus musculus|2014-05-05|RNA-Seq|GEO
1|SRR1030219|SRP033021|7142|Mus musculus|2014-05-05|RNA-Seq|GEO
2|SRR1030130|SRP033021|6616|Mus musculus|2014-05-05|RNA-Seq|GEO
3|SRR1030216|SRP033021|8348|Mus musculus|2014-05-05|RNA-Seq|GEO
4|SRR1030217|SRP033021|5729|Mus musculus|2014-05-05|RNA-Seq|GEO
1|SRR1462429|SRP043602|2759|Mus musculus|2015-06-26|RNA-Seq|UNC AT CHAPEL HILL
1|SRR1462572|SRP043602|881|Mus musculus|2015-06-26|RNA-Seq|UNC AT CHAPEL HILL
2175|SRR2063948|SRP011912|1064|bat metagenome|2015-08-29|OTHER|INSTITUTE OF PATHOGEN BIOLOGY, CHINESE ACADEMY OF MEDICAL SCIENCES & PEKING UNION MEDICAL COLLEGE
1|SRR1873758|SRP056027|2759|Coronaviridae|2016-01-01|RNA-Seq|UNC CHAPEL HILL
1|SRR1910440|SRP056027|881|Coronaviridae|2016-01-01|RNA-Seq|UNC CHAPEL HILL
2|SRR10903401|SRP242226|69|Homo sapiens|2020-01-18|RNA-Seq|WUHAN UNIVERSITY
7|SRR10903402|SRP242226|99|Homo sapiens|2020-01-18|RNA-Seq|WUHAN UNIVERSITY
36|SRR10948550|SRP242169|126|Severe acute respiratory syndrome coronavirus 2|2020-01-26|RNA-Seq|HKU-SHENZHEN HOSPITAL
6741|SRR10948474|SRP242169|250|Severe acute respiratory syndrome coronavirus 2|2020-01-26|RNA-Seq|HKU-SHENZHEN HOSPITAL
59|SRR10902284|SRP242169|78|Severe acute respiratory syndrome coronavirus 2|2020-01-26|RNA-Seq|UNIVERSITY OF HONG KONG
131|SRR11140750|SRP250294|3|Severe acute respiratory syndrome coronavirus 2|2020-02-21|WGS|UNIVERSITY OF WISCONSIN - MADISON
25496|SRR11140751|SRP250294|20|Severe acute respiratory syndrome coronavirus 2|2020-02-21|WGS|UNIVERSITY OF WISCONSIN - MADISON
3|SRR11140746|SRP250294|74|Severe acute respiratory syndrome coronavirus 2|2020-02-21|WGS|UNIVERSITY OF WISCONSIN - MADISON
7|SRR11140744|SRP250294|103|Severe acute respiratory syndrome coronavirus 2|2020-02-21|WGS|UNIVERSITY OF WISCONSIN - MADISON
75563|SRR11140749|SRP250294|267|Severe acute respiratory syndrome coronavirus 2|2020-02-21|WGS|UNIVERSITY OF WISCONSIN - MADISON
75590|SRR11140745|SRP250294|229|Severe acute respiratory syndrome coronavirus 2|2020-02-21|WGS|UNIVERSITY OF WISCONSIN - MADISON
78311|SRR11140747|SRP250294|316|Severe acute respiratory syndrome coronavirus 2|2020-02-21|WGS|UNIVERSITY OF WISCONSIN - MADISON
8|SRR11140748|SRP250294|88|Severe acute respiratory syndrome coronavirus 2|2020-02-21|WGS|UNIVERSITY OF WISCONSIN - MADISON

In the output above, the only run published before 2020 with more than 10 aligned reads is SRR2063948, which is a sequencing run of a bat metagenome sample from 2015 which contained a virus similar to the SARS-like bat virus BtRs-BetaCoV/GX2013:

$ curl -s "https://trace.ncbi.nlm.nih.gov/Traces/sra-db-be/run_taxonomy?acc=SRR2063948&cluster_name=public">SRR2063948.stat
$ jq -r '[.[]|.tax_table[]|.parent]as$par|[.[]|.tax_table[]|select(.tax_id as$x|$par|index($x)|not)]|sort_by(-.total_count)[]|((.total_count|tostring)+";"+.org)' SRR2063948.stat|head
1001029;BtRs-BetaCoV/GX2013
43212;Mycoplasma molare ATCC 27746
24510;Sphingobacterium sp. IITKGP-BTPF85
20983;Arenimonas
8137;Klebsiella pneumoniae
6203;Aphid lethal paralysis virus
5673;Brevibacterium
2947;Cryptosporidium
2056;Bat SARS-like coronavirus
2025;Chryseobacterium

In the list of runs shown in the output above, the runs from 2014 where the host was Mus musculus were part of a study where mice were infected with SARS1 and influenza A. [https://www.ncbi.nlm.nih.gov/sra/?term=SRR1030105] And the runs from 2014 where the host was Chlorocebus aethiops were part of a study where monkeys were infected with MERS and SARS1. [https://www.ncbi.nlm.nih.gov/sra/?term=SRR1194940] And in the runs from 2015 that were submitted by the University of North Carolina at Chapel Hill, mice were infected with the SARS-like virus HKU3. [https://www.ncbi.nlm.nih.gov/sra/?term=SRR1910440]

There were a total of 3,315 runs which had between 10 and 99 reads with a STAT hit for SARS2, but the vast majority of runs with K-mer hits didn't get a single read that aligned against SARS2 or other sarbecoviruses. When I downloaded the first million reads from each run and I aligned the reads against a version of Wuhan-Hu-1 with the poly(A) tail removed, my results were kind of lame. I got 5,961 aligned reads for a run where they sequenced plankton from the genus Pseudo-nitzschia, but the longest aligned read was only 17 bases long, and I should've filtered the reads by length before aligning them. And I got 393 aligned reads for SRR2063922, which was a Chinese bat metagenome sample published in 2015, and when I aligned the reads against a FASTA file of sarbecoviruses, I got over 90% coverage for the bat sarbecoviruses JTMC15, LN2020C, and 16BO133, but Wuhan-Hu-1 only got a few aligned reads and even they had a high mismatch rate. And I got 1-5 aligned reads for 10 runs from a BioProject where mice were infected with SARS1 and influenza A. And I got 1 or 2 aligned reads for 3 runs from a BioProject where human cells were infected with MERS and SARS1. But that's it:

$ curl -Lso bigquerysars2.json 'https://drive.google.com/uc?export=download&id=1X_8oLCKQ8cgEs5zv5WKBGWVkm4BTJsYK'
$ jq -sr '.[]|[.acc,.total_count]|@tsv' bigquerysars2.json|awk '$2>=10&&$2<100'|cut -f1|parallel -j10 fastq-dump -O l/e/scan2 -X 1000000 --gzip {}
[...]
$ seqkit subseq -r 1:-34 sars2.fa>sars2nopolya.fa;bowtie2-build sars2nopolya.fa{,}
[...]
$ for x in l/e/scan2/*gz;do bowtie2 -p4 --no-unal -x sars2nopolya.fa -U $x|samtools sort -@3 ->${x%%.*}.bam;done
[...]
$ for x in l/e/scan2/*.bam;do n=${x##*/};samtools flagstat $x|sed 's/ .*//;s/$/'$'\t'${n%.*}/\;q;done|awk '$1>0'>scan2
$ esearch -db sra -query "$(cut -f2 scan2|sed '$!s/$/ OR /'|tr -d \\n)"|efetch -format runinfo>scan2.runinfo
$ awk -F\\t 'NR==FNR{a[$1]=$0;next}{print$1 FS a[$2]}' <(csvtk cut -f1,22,2,29,30,42 -T scan2.runinfo) scan2|tr \\t \|
5961|ERR2731256|PRJEB28137|2018-12-02 13:21:24|Pseudo-nitzschia multistriata|SAMEA4823046|Stazione Zoologica Anton Dohrn of Naples
2|SRR1030057|PRJNA227801|2014-05-05 16:16:05|Mus musculus|GSM1265482|GEO
2|SRR1030077|PRJNA227801|2014-05-05 16:16:05|Mus musculus|GSM1265497|GEO
1|SRR1030079|PRJNA227801|2014-05-05 16:16:05|Mus musculus|GSM1265498|GEO
1|SRR1030081|PRJNA227801|2014-05-05 16:16:05|Mus musculus|GSM1265499|GEO
1|SRR1030154|PRJNA227801|2014-05-05 16:16:05|Mus musculus|GSM1265541|GEO
1|SRR1030156|PRJNA227801|2014-05-05 16:16:05|Mus musculus|GSM1265543|GEO
5|SRR1030171|PRJNA227801|2014-05-05 16:16:05|Mus musculus|GSM1265557|GEO
1|SRR1030195|PRJNA227801|2014-05-05 16:16:05|Mus musculus|GSM1265574|GEO
1|SRR1030199|PRJNA227801|2014-05-05 16:16:05|Mus musculus|GSM1265576|GEO
1|SRR1030221|PRJNA227801|2014-05-05 16:16:05|Mus musculus|GSM1265590|GEO
1|SRR1193018|PRJNA233943|2014-03-21 01:43:14|Homo sapiens|VMERS_SARS-MRC5HighMOI-24hr-2|UMIGS
1|SRR1195619|PRJNA233943|2014-03-21 01:43:14|Homo sapiens|VMERS_SARS-MRC5lowMOI-48hr-2|UMIGS
2|SRR1195620|PRJNA233943|2014-03-21 01:43:14|Homo sapiens|VMERS_SARS-MRC5lowMOI-48hr-2|UMIGS
393|SRR2063922||2015-06-24 00:26:32|bat metagenome|130110_lane3|INSTITUTE OF PATHOGEN BIOLOGY, CHINESE ACADEMY OF MEDICAL SCIENCES & PEKING UNION MEDICAL COLLEGE

Earlier I also downloaded SRA runs published before 2020 which had k-mer matches for other sarbecoviruses and not just SARS2, but the only runs I found which actually contained sarbecoviruses were part of experiments where lab animals or cell lines were infected with viruses like SARS1, experiments where sequencers were tested with different synthetic viral fragments, sequencing projects of bat metagenomes or bat viromes, and so on. The only runs I found where a sarbecovirus may have come from an actual human patient were French influenza A samples from 2007-2012 which were contaminated with SARS1. [https://www.sciencedirect.com/science/article/pii/S2590053621001075] However the SARS1 reads in the samples matched the lab-created wtic and ExoN strains, so the samples may have been contaminated in the lab, or the reads may have been the product of index hopping. Or there may have actually been an outbreak of SARS1 in France which was caused by a lab leak.

The only SRA runs I have found that may have been sequenced before 2020 and that contain reads of SARS2 are the runs of Antarctic metagenomic samples that were analyzed by Csabai et al. The samples were sent for sequencing in December 2019 according to Jesse Bloom's communication with the Chinese authors who submitted the runs, but even the Antarctic runs were only published at the SRA in 2021, and it's not clear if they were sequenced in December 2019 or January 2020. [https://x.com/jbloom_lab/status/1491297779855278082, https://x.com/stevenemassey/status/1501922721847992322, https://assets.researchsquare.com/files/rs-1177047/v1_covered.pdf, https://github.com/jbloom/PRJNA692319_public]

Samples collected before February 21st 2020 in the Seattle Flu Study didn't test positive for SARS-CoV-2

In April 2020, Nextstrain's lead developer Trevor Bedford posted a Twitter thread where he wrote the following: [https://x.com/trvrb/status/1249414295042965504]

There is a lot of Twitter chatter surrounding a rumor that circulation of #COVID19 in California in fall 2019 has resulted in herd immunity. This is empirically not the case. COVID-19 was first introduced into the USA in Jan/Feb 2020.

We have a couple good sources of evidence here: (1) direct testing of @seattleflustudy samples collected in Jan and Feb 2020 and (2) phylogenetic evidence showing genetic relationships of sequenced viruses.

For (1), the @seattleflustudy has gone back and tested retrospective samples collected between Jan 1 and March 10 in our research assay. These samples were collected as part of our study of respiratory infections in the Seattle area.

All samples were from individuals suffering acute respiratory infection with a subset having influenza-like illness. Individuals with undiagnosed COVID-19 should be picked up with these symptom criteria.

We tested 3600 samples collected in Jan 2020 for COVID-19 status and found zero positives. We tested 3308 samples collected in Feb 2020 and found a first positive on Feb 21 with a total of 10 samples testing positive in Feb.

Additionally, we confirmed that these samples from acute respiratory infections from Oct 2019 through Feb 2020 contained a variety of different viruses including influenza, RSV, rhinovirus, metapneumovirus and seasonal coronavirus.

As you may know, seasonal coronaviruses are responsible for ~30% of common colds and are easily distinguished from #SARSCoV2 (the virus responsible for COVID-19) in molecular assays. There is no chance of confusion between these in our assay.

Early COVID cases were in people who had traveled to regions with COVID

Some people claim that PCR positives were found all over the world as soon as testing started, so they claim the tests were picking up a virus that had existed in the background for a long time and there was no spread of a novel virus.

But then why were early cases found in people who had traveled to a region with COVID? For example in the Netherlands, the first COVID case was reported on February 27th in a man who was said to have recently returned from Lombardy. [https://www.government.nl/latest/news/2020/02/27/man-diagnosed-with-coronavirus-covid-19-in-the-netherlands] By February 27th there were probably many PCR tests that had already been performed in the Netherlands, so if the virus had existed on the background before 2020, then why was it not found earlier? (However in the statistics published by the Dutch ministry of health, the data for the number of PCR tests performed each day only starts in June 2020, so I couldn't check how many tests were performed before February 27th. [https://data.rivm.nl/covid-19/])

The first known case in Germany is supposed to have been a Chinese woman from Bavaria, who worked for the company Webasto and who had traveled to Shanghai to meet with her parents who lived in the Wuhan region, and the next 5 cases in Germany were all in people from Bavaria who worked for Webasto (or at least that's the official story): [https://www.thelocal.de/20200205/coronavirus-in-bavaria-how-did-the-virus-spread]

In some Micronesian countries and jurisdictions, the first COVID case was only reported in 2022. Here I sorted locations at OWID by the date of the first reported case and I displayed the last 16 locations:

> download.file("https://covid.ourworldindata.org/data/owid-covid-data.csv","owid-covid-data.csv")
> t=read.csv("owid-covid-data.csv")
> t2=t[t$new_cases!=0,]
> t2=t2[!duplicated(t2$location),]
> t2=t2[order(t2$date),]
> t2[,c("location","date","population","new_cases")]|>na.omit()|>tail(16)|>print.data.frame(row.names=F)
            location       date population new_cases
    Marshall Islands 2020-10-29      41593         1
             Vanuatu 2020-11-11     326744         1
               Samoa 2020-12-02     222390         1
          Kyrgyzstan 2021-06-27    6630621      6331
               Palau 2021-08-22      18084         2
      American Samoa 2021-09-18      44295         1
               Tonga 2021-10-29     106867         1
            Kiribati 2022-01-18     131237        37
        Cook Islands 2022-02-14      17032         1
                Niue 2022-03-09       1952         1
               Nauru 2022-04-03      12691         2
Micronesia (country) 2022-04-24     114178         2
              Tuvalu 2022-05-22      11335         3
            Pitcairn 2022-07-20         47         4
        Saint Helena 2022-08-08       5401         1
             Tokelau 2022-12-13       1893         5

Wikipedia also says that the first COVID case was only reported in April 2022 in Nauru and December 2022 in Tokelau. [https://en.wikipedia.org/wiki/COVID-19_pandemic_in_Nauru, https://en.wikipedia.org/wiki/COVID-19_pandemic_in_Tokelau]

The first two reported cases in Nauru were in two people who had traveled on the same flight from Australia to Nauru. [https://www.rnz.co.nz/international/pacific-news/464521/covid-19-in-the-pacific] They were tested in quarantine because Nauru had required people who arrived to the island to remain 14 days in quarantine since March 2020. But if people who had arrived to Nauru had been tested for COVID since 2020, then why were there no positive tests earlier (or at least no cases reported by the WHO)?

In CDC's PCR testing data for Marshall Islands, there's 94 test results listed up to October 9th 2020 but they're all negative, and after that the number of tests was not updated until April 29th 2021 when there were 2,690 new negative tests and 8 new positive tests added. However the earliest test was reported on May 7th 2020, so there's at least 5 months after that when there were no positive tests reported: [https://healthdata.gov/dataset/COVID-19-Diagnostic-Laboratory-Testing-PCR-Testing/j8mb-icvb]

> t=read.csv("https://healthdata.gov/api/views/j8mb-icvb/rows.csv")
> with(subset(t,state_name=="Marshall Islands"),tapply(new_results_reported,list(overall_outcome,substring(date,1,7)),sum))|>na_replace(0)
         2020/05 2020/06 2020/07 2020/08 2020/09 2020/10 2020/11 2020/12 2021/01 2021/02 2021/03 2021/04 2021/05
Negative      29      33      10       9      11       2       0       0       0       0       0    2690     392
Positive      NA      NA      NA      NA      NA      NA      NA      NA      NA      NA      NA       8       0
         2021/06 2021/07 2021/08 2021/09 2021/10 2021/11 2021/12 2022/01 2022/02 2022/03 2022/04 2022/05 2022/06
Negative       1       0       0       1     158       1       1       1       3       0       0       0       0
Positive       0       0       0       0       0       0       0       1       0       0       0       0       0
         2022/07 2022/08 2022/09 2022/10 2022/11 2022/12 2023/01 2023/02 2023/03 2023/04 2023/05 2023/06 2023/07
Negative       0       0       2       0       2       1       3       0       0       0       0       0       2
Positive       0       0       0       0       0       1       0       0       0       0       0       0       0

Wikipedia says: "The virus was confirmed to have reached the Marshall Islands on 28 October 2020, but remained confined to quarantined arrivals (no domestic community spread) until August 2022. The first known community transmission cases of COVID-19 were confirmed in Majuro on August 8, 2022, ending the country's COVID-free status.[2]" [https://en.wikipedia.org/wiki/COVID-19_pandemic_in_the_Marshall_Islands] And Wikipedia says that the first two cases were detected in October 2020 when a group of about 300 Marshall Islanders who had stayed abroad were repatriated to the islands, and they included two members of the US Army garrison who tested positive for COVID.

People have tested old samples for the presence of SARS2

In a discussion about whether the virus may have been circulating before late 2019, Phillip Buckhaults replied: "when I validated my PCR test, I checked hundreds of old samples and they were all negative." [https://x.com/P_J_Buckhaults/status/1757095152420618516] But people in other labs have similarly done PCR tests for old samples, and if the samples would've been positive then the people could've also sequenced the samples, and it would've been huge news if they found earlier strains of SARS2 than the known strains.

Jessica Hockett

Isolation pods used to transport early COVID patients

Hockett has implied that isolation pods like this were used to transport COVID patients as a form of theater to make the public audience more afraid of COVID: [https://x.com/EWoodhouse7/status/1691897517292556293]

However in the photo above that Hockett posted on Twitter, the patient who was being transported inside the isolation pod was the first reported case of COVID in Nebraska, and she had recently returned to United States from England. [https://dhhs.ne.gov/Pages/Updates-on-Nebraska%E2%80%99s-First-Case-of-Coronavirus-Disease-2019.aspx] So it made sense for the medical staff to use extra precautions because otherwise they may have been responsible for seeding the COVID pandemic in Nebraska.

In the photo above, the patient in the isolation pod was being transported to the University of Nebraska Medical Center. On the website of the hospital, I found a series of video tutorials where nurses are taught how to assemble and use an isolation pod unit. [https://app1.unmc.edu/nursing/heroes/elc_br_isotran.cfm] So if the hospital had invested resources in buying an isolation pod and training their staff on how to use it, and the pod was currently not in use because they did not yet have other COVID patients, then it made sense for them to try it out when they had their first COVID patient.

Hockett also wrote: "Give us an example of another 'highly infectious microbe' that would warrant patient transport in an *isolation pod* like the one apparently deemed necessary for the Nebraska woman in March 2020". [https://x.com/EWoodhouse7/status/1692282439790412208] However Wikipedia says: "Isolation devices were developed in the 1970s for the aerial evacuation of patients with Lassa fever. In 2015, Human Stretcher Transit Isolator (HSTI) pods were used for the aerial evacuation of health workers during the Ebola virus epidemic in Guinea.[3]" [https://en.wikipedia.org/wiki/Isolation_pod]

I found this photo of an Ebola patient being transported inside an isolation pod: [https://www.israel21c.org/ebola-cant-escape-israeli-mobile-isolation-units/]

I also found a blog post by a healthcare worker who said that their hospital started using isolation pods in helicopters and planes that were used to transport COVID patients, because earlier several crew members of their transport aircraft had caught COVID, so some of their helicopters or planes had to be grounded until the crew members could recover: [https://ctlin.blog/2020/12/30/transporting-patients-in-the-covid-bag-guest-post-gary-breen-md/]

The Problem

How are intubated and ventilated Covid-19 patients transported? As a hospitalist located at Yampa Valley Medical Center in Steamboat Springs, I have had to intubate and initial mechanical ventilation on a number of patients infected with Covid-19.

Initially, following the onset of this pandemic, these critically ill patients were being transported via rotor or fixed wing aircraft to our larger UCHealth facilities on the Front Range for optimal care by flight crews donning PPE which included N95 masks, goggles or face shields, gowns and gloves.

Despite this protective gear, many of the flight crews contracted Covid, which resulted in some emergency transport services becoming grounded until crews could recover. A better, safer option for transporting these patients was needed.

The ISO-POD

Originally developed to transport patients infected with the Ebola virus, The ISO-POD is negative-pressure patient isolation and transport system which allows us to safely transport critically ill Covid-19 patients, while simultaneously providing protection to our emergency personnel. The device has a port which allows for ventilator tubing, IV lines, and monitoring lines to pass, as well as 12 gloved iris openings to allow the flight crew staff access to the patient from head to toe.

Claim that the 2009 swine flu strain was not detected before 2009 because of a lack of testing

Hockett has suggested that the 2009 pandemic strain of H1N1 may have been circulating in humans before 2009 but it was simply not been detected earlier because PCR tests only targeted other strains of H1N1. [https://www.woodhouse76.com/p/setting-the-stage-for-flus-disappearing]

However you can try going to the NCBI's influenza virus database. [https://www.ncbi.nlm.nih.gov/genomes/FLU/Database/nph-select.cgi] Set sequence type to nucleotide, host to human, segment to HA, and subtype to H1N1. Then click "Full-length only", click "Add query", click "Customize FASTA defline" and set the format to >{accession} {strain};{country};{year};{month};{day};{host}, and click "Download results". Then run this code:

$ brew install seqkit mafft
[...]
$ seqkit fx2tab Downloads/FASTA.fa|awk -F\; '$3<2009||/CY040888/'|seqkit tab2fx|mafft --thread 4 ->flu.fa
[...]
$ curl -s https://pastebin.com/raw/pDwYNf1r>pid.cpp;g++ pid.cpp -O3 -o pid
$ ./pid<flu.fa>flu.pid
$ awk -F\\t 'NR==1{for(i=2;i<=NF;i++)if($i~/CY040888/)break;next}{print$i,$1}' flu.pid|sort -rn|head
100.0000 CY040888 A/Mexico/47N/2009;Mexico;2009;04;25;Human
99.1770 OQ535143 A/USA/34717/1935;USA;1935;11;;Human
93.7684 FJ986621 A/Ohio/02/2007;USA;2007;08;17;Human
93.7684 FJ986620 A/Ohio/01/2007;USA;2007;08;17;Human
91.9459 U53163 A/Wisconsin/4755/1994;USA;1994;;;Human
91.9459 U53162 A/Wisconsin/4754/1994;USA;1994;;;Human
91.9459 L24362 A/Maryland/12/1991;USA;1991;;;Human
91.9459 CY039909 A/Maryland/12/1991;USA;1991;;;Human
91.8871 CY024925 A/Ohio/3559/1988;USA;1988;;;Human
90.7701 DQ889689 A/Iowa/CEID23/2005;USA;2005;;;Human

There's a total of 1,688 sequences with a collection date before 2009, which are listed in the output above so that the sequences are sorted by their distance to an early 2009 swine flu sample from Mexico. Apart from a single sample that's probably mislabeled because its collection year is listed as 1935, the closest neighbor of the Mexican sample has only about 94% identity in the HA segment. (The HA protein is the equivalent of the spike protein in coronaviruses, so it evolves faster than other proteins because it's exposed to the immune system, but even though most current human strains of H1N1 developed out of the 2009 swine flu strain, the HA protein of human H1N1 samples from 2023 is still about 95% identical to the 2009 strain.)

So at least in the NCBI's influenza virus database, apart from the single sample with a collection year in 1935 that is probably mislabeled, there's no human sequences from before 2009 that are anywhere close to the 2009 swine flu strain.

And actually even the closest swine sequences have only about 95% identity in the HA segment, which makes me suspect that some gain-of-function work was involved in getting the 2009 swine flu strain to readapt to a human host. And the reason why I use the word "readapt" is that if you look at the pre-2009 swine sequences of H1N1 that are the most similar to the 2009 strain, they evolved out of a strain of H1N1 that was fairly close to the Spanish flu in the 1930s when it's first found in NCBI's influenza virus database, so the 2009 swine flu strain might basically be a descendant of the Spanish flu which jumped from humans to pigs and back to humans:

Claim that a PCR positivity rate above 60% in New York City is anomalous

Hockett posted this tweet: [https://x.com/EWoodhouse7/status/1681083398700539904]

However the number of tests that were done in spring 2020 was fairly low, so they probably weren't testing that many asymptomatic people who didn't actually have COVID:

There was a shortage of tests in spring 2020, so on March 25th (in both UTC and local time) there was an announcement posted on Twitter that hospitals in New York City had stopped testing patients who do not require hospitalization: "Two Queens hospitals are COVID-19 testing sites: NYC Health + Hospitals/Elmhurst & NYC Health + Hospitals/Queens (also serving as drive-thru testing site). NYC Health + Hospitals are no longer testing patients who do not require hospitalization. This is due to an increase in the number of Coronavirus cases in the city and the dwindling number of tests and supplies for medical staff." [https://x.com/SenJoeAddabbo/status/1242856965157634054]

Usually PCR positivity rates are reported for the whole country and not for individual cities like New York City, so it's rare to find positivity rates of 70% in the whole country if the whole country doesn't get COVID at the same time. However according to OWID's data, the PCR positivity rate has sometimes climbed above 60% in some countries like Bolivia, Mongolia, and Taiwan (even though for example around half of the population of Mongolia is concentrated in Ulaanbaatar, and around half of the rest of the population still lives a nomadic lifestyle, so maybe they weren't testing people who lived in yurts at the steppe, and most of the sedentary population of Mongolia lives in a single city):

And additionally if you look at WHO's influenza testing data for a single country like Germany in the screenshot below, the percentage of positive PCR tests for influenza viruses has often reached over 60% or even over 70% during the peak of the flu season (but in individual cities or regions within a country, you'd of course get even higher peaks in the percentage of positive tests): [https://app.powerbi.com/view?r=eyJrIjoiZTkyODcyOTEtZjA5YS00ZmI0LWFkZGUtODIxNGI5OTE3YjM0IiwidCI6ImY2MTBjMGI3LWJkMjQtNGIzOS04MTBiLTNkYzI4MGFmYjU5MCIsImMiOjh9]

Low number of occupied beds and ER visits in Elmhurst Hospital in Queens

The Elmhurst Hospital in Queens was characterized as the epicenter of the COVID outbreak in New York City, but Hockett has pointed out that in spring 2020 Elmhurst had a low number of ICU visits and a low number of occupied beds: [https://x.com/EWoodhouse7/status/1689833208362209280, https://x.com/EWoodhouse7/status/1643336428942655488]

However a New York Times article published on March 25th said: "Elmhurst, a 545-bed public hospital in Queens, has begun transferring patients not suffering from coronavirus to other hospitals as it moves toward becoming dedicated entirely to the outbreak." [https://www.nytimes.com/2020/03/25/nyregion/nyc-coronavirus-hospitals.html]

According to a New York Times article published in May 2020, elective surgeries had also been canceled during the COVID peak: [https://www.nytimes.com/2020/05/20/nyregion/hospitals-coronavirus-cases-decline.html; read with https://github.com/iamadamdev/bypass-paywalls-chrome]

Hospitals are eager to restart elective surgery, a needed service that is also a major revenue generator.

At Elmhurst one recent day, staff members told hospital leaders that they were reviewing surgeries that had been delayed since March. They said they had a list of patients who should be operated on this month. That included cancer and neurosurgery patients who, in a tiered system released by Medicare in April, fell into categories marked "do not postpone."

But preparing to resume the procedures is challenging because spaces reserved for surgery patients - post-anesthesia units, surgical I.C.U.s. and even operating rooms - were repurposed around the city to treat those who were critically ill with the virus. On Tuesday, Elmhurst still had 35 critically ill Covid patients, more than the total I.C.U. capacity it maintained before the pandemic.

Even if those areas can be freed up, medical institutions have to create a safe pathway for patients to avoid infection as they enter hospitals, move to operating rooms, undergo monitoring afterward and then recover or receive intensive care.

Hockett posted this plot which showed that the number of non-COVID ED visits was much lower than usual in Bergamo during spring 2020, which might also explain why ED visits were depressed during the COVID peak in NYC (but in Hockett's plots for NYC you can't see visits for COVID disaggregated from non-COVID visits): [https://x.com/Wood_House76/status/1712892165603365135]

Line of people waiting outside Elmhurst in Colleen Smith's video

On March 25th 2020, the New York Times published an article titled "13 Deaths in a Day: An 'Apocalyptic' Coronavirus Surge at an N.Y.C. Hospital". [https://www.nytimes.com/2020/03/25/nyregion/nyc-coronavirus-hospitals.html] The article featured a video from Elmhurst Hospital that was shot by Colleen Smith, who was described as an emergency room doctor at Elmhurst. Smith's video showed that there was a long line of patients outside the hospital, and the article by NYT also said: "The line of people waiting outside of Elmhurst to be tested for the coronavirus forms as early as 6 a.m., and some stay there until 5 p.m. Many are told to go home without being tested."

On March 29th 2020 UTC, someone posted a viral YouTube video titled "What Elmhurst Hospital looks like when the news cameras aren't rolling! #filmyourhospital Part 1/3". [https://www.youtube.com/watch?v=K0z8NhxNTaU] The video showed that there was no longer a line of people waiting to get tested, which many conspiratards interpreted to mean that the line was staged for Colleen Smith's video. Many conspiracy theorists thought that the people outside the hospital were COVID patients who had to wait outside the hospital because the hospital was so full, and they didn't realize that the people outside the hospital were waiting to get tested for COVID in the tents that had been set up outside the hospital.

It doesn't seem like the line outside Elmhurst was only staged for Colleen Smith's video, because I found tweets from several different days by random people who posted photos of the line outside Elmhurst. [https://x.com/search?q=until%3A2020-3-25%20elmhurst%20line&f=live] The earliest tweet I found about the line was from March 20th (in both UTC and local time), when someone tweeted: "This is the line for Covid-19 tests at Elmhurst Hospital in Queens this morning. Police monitoring, car with lights flashing". [https://x.com/jdavidgoodman/status/1241011394717368325] On March 23rd, someone tweeted an image of the line and wrote: "line to be tested at elmhurst hospital since 7am it goes all the way down the block.." [https://x.com/kingzeek_/status/1242072579977940999]

However on March 25th (in both UTC and local time), which was the same day when the NYT article about Colleen Smith's video was published, a senator from New York tweeted: "Two Queens hospitals are COVID-19 testing sites: NYC Health + Hospitals/Elmhurst & NYC Health + Hospitals/Queens (also serving as drive-thru testing site). NYC Health + Hospitals are no longer testing patients who do not require hospitalization. This is due to an increase in the number of Coronavirus cases in the city and the dwindling number of tests and supplies for medical staff." [https://x.com/SenJoeAddabbo/status/1242856965157634054] So that might explain why the line went away.

On March 30th (in both UTC and local time), someone tweeted that there were now less than 10 people standing in line outside Elmhurst. [https://x.com/ciaobelladg/status/1244693218031276034] So if the video that showed no queue was shot on March 29th, maybe the person who shot the video would've witnessed a small queue building up again if they waited until the next day.

Some people were saying that the people who stood in line in Colleen Smith's video were crisis actors because they were all facing away from the camera (which is something that crisis actors have been accused of doing on various occasions). But maybe the people were just facing forwards because they were standing in a line, or maybe the people standing in line were filmed from the back for privacy reasons. And there's also a video that was posted on Twitter by someone who was standing in the line themselves waiting to get tested, but even though they turned around during the video to film both people before them and after them, basically none of the faces of the people were visible in the video, and there appeared to be one or two people who turned their face away when they noticed that they were being filmed. [https://x.com/ruthiwest/status/1244434997513203712]

Elmhurst is located in Queens, but if you look at the daily number of tests performed in Queens County, it remained fairly flat around 2,000-3,000 from March 21st until April 21st, so maybe the reason why there wasn't a bigger increase in the number of tests performed was that there was actually a shortage of tests. [https://health.data.ny.gov/Health/New-York-State-Statewide-COVID-19-Testing/xdss-u53e]

An article published on March 20th local time said: "The city has begun expanded, appointment-only COVID-19 testing at two Queens hospitals, NYC Health + Hospitals/Elmhurst (formerly Elmhurst Hospital Center) and NYC Health + Hospitals/Queens (formerly Queens General Hospital) in Jamaica with cases passing the 1,400 mark in the borough as of Friday morning. [...] The testing at both Queens hospitals will be inside tents that are similar to the ones used during the H1N1 outbreak in 2009. Patients with appointments will receive an expedited consultation with a primary care physician to capture their medical history before their sample is collected for testing." [https://qns.com/2020/03/city-begins-covid-19-testing-at-two-queens-hospitals/] So it might explain why the first photos of the queue outside Elmhurst I found on Twitter were from March 20th. And if the patients who went to get tested at the tent had to discuss their medical history with a primary care physician, it might explain why the testing took so long that people had to wait for hours to get tested.

I also found article about the testing tent outside Elmhurst which was published on March 19th local time, and an update to the article dated March 20th said that "the city announced that the testing tent is now open". [https://queenseagle.com/all/elmhurst-hospital-covid19-testing]

On April 25th, Governor Cuomo announced that testing capacity had been increased so that more people were now eligible for testing and that people were able to get tested at more than 5,000 pharmacies: [https://qns.com/2020/04/new-york-covid-19-testing-eligibility-expands-5000-pharmacies-to-collect-samples/]

As New York state continues increasing its testing capacity, more New Yorkers will be eligible to get a COVID-19 test - and be able to take them at their local pharmacy, Governor Andrew Cuomo said on Saturday.

During his daily briefing, the governor said that the state's 300 labs have ramped up testing to the point where more collection sites are need to obtain additional samples. To that end, Cuomo has signed an executive order authorizing more than 5,000 independent pharmacists to serve as collection sites.

Additionally, the state is relaxing testing criteria, which was limited to patients seriously ill from coronavirus or those who were exposed to COVID-19 and are at high risk of becoming infected. Now, the state will permit first responders, health care workers and various essential workers to take a COVID-19 test.

Hockett wrote that she knew that people were waiting outside Elmhurst to get tested in the tents: "It was people lined up for testing they were doing outside under tents. It gave the impression that Elmhurst was being overrun, and also scared people who may have needed medical care for other reasons into staying home." [https://x.com/EWoodhouse7/status/1645279433471737856] However she still tweeted the video below which showed that there was no line outside Elmhurst but she didn't explain why the line had become empty: [https://x.com/EWoodhouse7/status/1643690320897474560]

Deaths in NYC hospitals shifted two weeks too early in Parish et al. paper

Hockett published a Substack post about how in a paper by Parish et al. from 2021 titled "Early Intubation and Increased Coronavirus Disease 2019 Mortality: A Propensity Score–Matched Retrospective Cohort Study", the peak in COVID deaths in NYC hospitals seemed to occur two weeks earlier than in other sources: [https://www.woodhouse76.com/p/covid-death-discrepancy-for-nyc-public]

Hockett used data from Supplementary Table 2 of the paper which is titled "Number of new COVID-19 cases per week over course of the pandemic from March 1st, 2020 to December 1st, 2020, and the associated rates of intubation and mortality, for all cases (n = 8247) and for cases without DNI orders (n = 7597)." The week numbers in the table are expressed as weeks after March 1st 2020, ranging from 1 to 39:

However the authors of the paper may have made a mistake in converting the week numbers to week numbers relative to March 1st, because March 1st fell on a Sunday so it has a different week number depending on whether you're using a system of week numbers where the week starts on Monday or Sunday, and it could for example be that at some step of their code they used ISO 8601 week numbers where the week begins on Monday.

The authors of the paper wrote that they used R, but in R the as.Date function doesn't support converting ISO 8601 week numbers to dates, because the function only supports the %U and %W week number formats but not the %V format, and it's a pain in the ass to write code yourself for converting ISO 8601 week numbers, so in the past I have erroneously converted data that used ISO 8601 week numbers using the incorrect week number scheme, and it's an easy mistake to make:

> as.Date("2020 9 0","%Y %U %w") # get first day of week 9 in Sunday-based system
[1] "2020-03-01"
> as.Date("2020 9 1","%Y %W %u") # get first day of week 9 in Monday-based system
[1] "2020-03-02"
> isoweek=\(year,week,weekday=1){d=as.Date(paste0(year,"-1-4"));d-(as.integer(format(d,"%w"))+6)%%7-1+7*(week-1)+weekday}
> isoweek(2020,9) # get first day of week 9 in ISO 8601
[1] "2020-02-24"
> as.Date("2020 9 1","%Y %V %w") # `as.Date` doesn't support `%V` (ISO 8601 week number) so this returns the month and day of the current date (2023-09-08)
[1] "2020-09-08"

December 1st 2020 fell on a Tuesday, so it was the third day of the week in a Sunday-based system. The week number of December 1st 2020 is 40 bigger than the week number of March 1st in the %V (ISO 8601) and %W (Monday-based) systems but it's 39 bigger in the %U (Sunday-based) system:

$ brew install coreutils
[...]
$ gdate -d2020-3-1 '+%V %U %W %A'
09 09 08 Sunday
$ gdate -d2020-12-1 '+%V %U %W %A'
49 48 48 Tuesday

In Supplementary Table 2, the last week included in the data is week 39 which is only 38 bigger than the number of the first week, which would appear to indicate that the partial week that contains December 1st was omitted from the table.

However on the other hand on week 39 in Supplementary Table 2, the number of new COVID cases was only 73 even though it was 116 on week 38 and it had been increasing steadily for 4 weeks before then, so week 39 might also refer to the incomplete week that consists of November 29th, November 30th, and December 1st. According to the dataset for the daily number of COVID deaths by county that was published on the GitHub account of the New York Times, the daily number of new COVID cases in New York City was increasing at a fairly constant pace in late November and early December, so if the last week of data included in Supplementary Table 2 would be a complete week, it probably shouldn't have a much smaller number of cases than the second-last week (unless for example a large number of cases were omitted on the last week because of a registration delay):

$ wget -q https://raw.githubusercontent.com/nytimes/covid-19-data/master/us-counties-2020.csv
$ awk -F, 'NR==1{print"date new_cases new_deaths"}$2=="New York City"&&$1>="2020-10-31"&&$1<="2020-12-10"{print$1,$5-x,$6-y;x=$5;y=$6}' us-counties-2020.csv|sed 2d|column -t
date        new_cases  new_deaths
2020-11-01  950        12
2020-11-02  640        4
2020-11-03  798        4
2020-11-04  795        13
2020-11-05  1072       13
2020-11-06  1202       7
2020-11-07  1165       6
2020-11-08  1393       14
2020-11-09  1161       11
2020-11-10  1207       2
2020-11-11  1732       9
2020-11-12  1663       3
2020-11-13  1826       9
2020-11-14  1800       10
2020-11-15  1452       6
2020-11-16  1293       12
2020-11-17  1940       10
2020-11-18  1735       3
2020-11-19  1839       18
2020-11-20  2030       21
2020-11-21  1948       14
2020-11-22  1925       4
2020-11-23  1787       12
2020-11-24  1725       2
2020-11-25  1918       10
2020-11-26  2336       11
2020-11-27  2561       14
2020-11-28  2098       5
2020-11-29  2303       8
2020-11-30  2501       6
2020-12-01  2577       13
2020-12-02  3200       10
2020-12-03  3305       8
2020-12-04  3600       18
2020-12-05  3227       23
2020-12-06  3135       19
2020-12-07  3842       22
2020-12-08  3145       29
2020-12-09  4079       -5
2020-12-10  3449       10

However if week 39 is the week that contains December 1st, then week 1 would be the week that starts on March 8th if the week starts on Sunday or on March 9th if the week starts on Monday. Which would explain why the deaths would be shifted by a single week. But I don't know why the deaths would be shifted by two weeks though.

Another reason why the week numbers in the Parish et al. paper may have been off by one could be that in the %U strftime format where the week begins on Sunday, the first week of the year is week zero, so for example date -d2020-1-1 +%U prints 00, but for example CDC WONDER uses a week number scheme where the week begins on Sunday but the first week of the year is week 1. (I noticed it when I got the wrong result when I tried to use the %U format to convert week numbers from CDC WONDER to dates.)

Claim that the spike in deaths in NYC in spring 2020 was so sharp that it could not have been caused by a virus

Hockett has been saying that the increase in deaths in NYC in spring 2020 was too sudden to be caused by the spread of a novel virus, or that a similar sharp spike in deaths was not seen elsewhere: [https://x.com/EWoodhouse7/status/1664603889037967363]

However according to OWID's data, for example in Macao the excess mortality went from 11% in November 2022 to 266% the next month, 256% the next month, and 1% the next month. And in Hong Kong, the excess mortality went from -1% in January 2022 to 33% the month, 169% the month, 33% the next month, and 3% the next month. Both Macao and Hong Kong had almost no excess deaths or COVID deaths before 2022.

Many other countries have had similar short-lived spikes in excess mortality that peaked at around 150% or higher, and usually the spikes in excess mortality coincided with a spike in PCR positivity rate (R code):

Out of countries with weekly excess mortality data at OWID, the highest increase in excess mortality compared to the previous week was on the week ending on April 5th 2020 in Ecuador, when the excess mortality percent increased by about 228 percentage points compared to the previous week:

> download.file("https://covid.ourworldindata.org/data/owid-covid-data.csv","owid-covid-data.csv")
> t=read.csv("owid-covid-data.csv")
> t2=t[,c("excess_mortality","location","date")]
> t2=na.omit(t2)
> t2$diff=unlist(tapply(t2$excess_mortality,t2$location,\(x)diff(c(NA,x))))
> t2$datediff=unlist(tapply(t2$date,t2$location,\(x)as.numeric(diff(c(NA,as.Date(x,origin="1970-1-1"))))))
> t2=t2[unlist(tapply(t2$diff,t2$location,\(x)seq_along(x)==which.max(x))),]
> t2=t2[order(-t2$diff),]
> t3=t2[t2$datediff==7,]
> print.data.frame(t3[1:10,c(4,2,3,5)],row.names=F)
   diff      location       date datediff
 224.59       Ecuador 2020-04-05        7
 161.28       Mayotte 2021-02-14        7
 148.15    Guadeloupe 2021-08-22        7
  95.87     Guatemala 2022-04-24        7
  83.24         Spain 2020-03-29        7
  81.70 French Guiana 2020-11-22        7
  78.46    Martinique 2021-08-08        7
  65.64          Iran 2022-04-03        7
  61.41       Iceland 2020-09-06        7
  54.68         Malta 2021-10-03        7

However in data for individual regions or individual cities within Ecuador, there would be even sharper weekly increases in excess mortality.

Claim that Bergamo was the only location which had higher weekly excess mortality than NYC

Hockett wrote that "no one except Bergamo reached had NYC's weekly increase" (in excess mortality over the corresponding week of the previous year). [https://www.woodhouse76.com/p/me-and-jj-couey/comments] I asked her if she has statistics for every city and region of Ecuador, because according to the data from the World Mortality Database that is used by OWID, Ecuador had almost 400% excess mortality on the week ending April 5th, so individual cities in Ecuador necessarily had even higher excess mortality since some cities are going to be above the nationwide average and some cities are going to be below the nationwide average. And I asked her if she has weekly data for French Polynesia or Macao, because OWID has only monthly data for French Polynesia and Macao but they both had almost 300% excess mortality during an entire month, so their weekly peaks in excess mortality had to be even higher since some weeks are going to above the monthly average and some weeks are going to be below the monthly average. Here you can see the countries and jurisdictions with the highest weekly or monthly excess mortality at OWID (where there's generally monthly data for the jurisdictions where the date in the last column is on the last day of the month):

$ wget -q https://covid.ourworldindata.org/data/owid-covid-data.csv
$ csvtk -T cut -f excess_mortality,location,date owid-covid-data.csv|sed 1d|LC_ALL=C sort -rnk1,1|awk -F\\t '$1>=150&&!a[$2]++'|column -ts$'\t'
386.92  Ecuador           2020-04-05
343.02  Guadeloupe        2021-08-22
276.24  French Polynesia  2021-08-31
265.97  Macao             2022-12-31
245.44  Bolivia           2020-07-31
219.44  Mayotte           2021-02-28
210.79  Peru              2021-04-18
199.18  Martinique        2021-08-22
194.86  Cuba              2021-08-31
192.4   Azerbaijan        2020-12-31
182.28  Nicaragua         2021-09-30
178.61  Armenia           2020-11-30
169.72  South Africa      2021-01-17
169.26  Mexico            2021-01-24
168.61  Hong Kong         2022-03-31
158.99  Iran              2021-08-29
157.23  Gibraltar         2021-01-31
156.63  Spain             2020-04-05
154.96  Paraguay          2021-05-31

In WHO's dataset for monthly excess mortality, out of March, April, and May 2020, the monthly excess mortality was the highest in Ecuador in April (about 222%) followed by Nicaragua in May (about 170%): [https://www.who.int/data/sets/global-excess-deaths-associated-with-covid-19-modelled-estimates]

$ awk -F\\t '$3==2020&&$4>=3&&$4<=5{print$3 FS$4 FS sprintf("%.1f",100*$8/$6)FS$1}' WHO_COVID_Excess_Deaths_EstimatesByCountry.tsv|sort -rnk3|awk -F\\t '$3>=50&&!a[$4]++'|column -ts$'\t'
2020  4  221.9  Ecuador
2020  5  170.1  Nicaragua
2020  3  138.1  San Marino
2020  4  131.2  Andorra
2020  5  127.9  Kuwait
2020  5  127.5  Peru
2020  5  119.8  United Arab Emirates
2020  5  94.1   Tajikistan
2020  4  87.0   The United Kingdom
2020  4  79.2   Spain
2020  4  66.5   Belgium
2020  5  57.7   Mexico
2020  3  53.4   Italy

In a paper which looked at data from 90 municipalities in the Indian state of Gujarat, they wrote that "We estimated a 678% increase [95% CI: 649%, 707%] in deaths in the last week of available data, in April 2021, in the municipalities studied." [https://journals.plos.org/globalpublichealth/article?id=10.1371/journal.pgph.0000824] And you'll probably find cities in Gujarat which had much higher weekly excess mortality than the statewide average.

However according to a dataset for weekly excess mortality published by the CDC, the peak weekly excess mortality in New York City was only about 643%, or a bit lower than the figure of 678% given for the 90 municipalities of Gujarat: [https://www.cdc.gov/nchs/nvss/vsrr/covid19/excess_deaths.htm]

$ (sed -u 1q Excess_Deaths_Associated_with_COVID-19.csv;grep 'New York City.*Unweighted.*All causes' Excess_Deaths_Associated_with_COVID-19.csv|sort -t, -rnk7|head)|cut -d, -f1,3,6,9|column -ts,
Week Ending Date  Observed Number  Average Expected Count  Percent Excess Estimate
2020-04-11        7862             1059                    642.588682353813
2020-04-04        6293             1067                    489.892190593692
2020-04-18        5899             1047                    463.409261054495
2020-04-25        4048             1037                    290.272494941929
2020-05-02        2846             1026                    177.317377275328
2020-03-28        2805             1080                    159.697177632861
2020-05-09        2072             1019                    103.297212358833
2022-01-15        2051             1148                    78.6484124993446
2022-01-22        1796             1149                    56.2942932001266
2022-01-08        1733             1141                    51.8696423172053

A paper about excess deaths in Italy said: "Some provinces showed staggering increases, with the percentage excess in Bergamo reaching 858.7% (95% eCI: 771.9 to 969.5%) in the week of 18–24 March (see Supplementary Data, available as Supplementary data at IJE online)." [https://academic.oup.com/ije/article/49/6/1909/5923437] So there might also be some cities in Ecuador or Gujarat which would surpass Bergamo.

The plot below shows modeled daily excess deaths in Ecuador. [https://www.ijidonline.com/action/showPdf?pii=S1201-9712%2820%2932567-4] The peak daily number of excess deaths from all causes was about 900, and if you estimate the total daily deaths visually for the period between three days before and three days after the peak, it would be around 665+860+825+915+750+775+685 = 5475. However the peak is on April 4th which was a Saturday, so the number of excess deaths would be much lower both for the week that ended on Sunday April 5th and the week that ended on Sunday April 12th (which demonstrates a problem with looking at weekly mortality data to determine which countries had the highest peak in excess mortality):

Based on the pre-pandemic trend, Ecuador would've had about 4.93 deaths per 1,000 inhabitants in 2020 and the population of Ecuador would've been about 17.6 million in 2020, so if there would've been no seasonal variation in the weekly number of deaths, the number of deaths per week would've been about 4.93*17600/(365.24/7) or about 1,663. So 5,475 deaths would be equivalent to about 330% excess deaths. However the percentage of excess deaths would be lower both on the week ending April 5th and on the week ending April 12th (even though OWID actually reports 387% excess mortality for Ecuador on the week ending April 5th).

From the plot below which is from another paper about excess deaths in Ecuador, you can see that the total excess mortality in 2020 was about 234% in the province of Santa Elena and about 190% in the province of Guayas, so some cities within those provinces may have had higher weekly excess mortality than Bergamo: [https://gh.bmj.com/content/6/9/e006446]

A paper about excess deaths in Italy said: "In the first 6 months of 2020, an 11.1% excess mortality was observed in Italy, and an almost 50% excess in Lombardy, the most affected region." [https://www.ncbi.nlm.nih.gov/pmc/articles/PMC7809978/] Bergamo is only the fourth-largest city of Lombardy, and other cities in Lombardy had lower excess deaths than Bergamo.

From the plot below you can see that the Italian province of Cremona had almost as high excess mortality as the province of Bergamo, so the maximum weekly excess mortality was probably also higher in Cremona or one of its municipalities than in NYC: [https://x.com/PienaarJm/status/1703687083577975179]

Claim that New York City had an anomalously high number of deaths in younger age groups in spring 2020

Hockett says that in spring 2020 in NYC, there was an unexpectedly high number of COVID deaths in younger adults or in people under the age of 55. [https://pandauncut.substack.com/i/138487782/unexpectedly-high-mortality-in-younger-adults]

The CDC has published a dataset which shows the monthly number of COVID deaths by state and age group. [https://data.cdc.gov/NCHS/Provisional-COVID-19-Deaths-by-Sex-and-Age/9bhg-hcku] However like at CDC Wonder, the number of deaths in the dataset is hidden for rows with 1-9 deaths, so is not possible to calculate the monthly percentage of deaths in younger age groups correctly for states with a low number of COVID deaths. But during each month from March 2020 until January 2023, New York City had a sufficient number of COVID deaths that it is possible to calculate the percentage of COVID deaths in ages 0-54 out of all COVID deaths. The percentage was was about 14% in March 2020 and about 10% in April 2020, but the percentage wasn't even the highest in spring 2020 because it was about 16% in August 2020 and about 19% in August 2021:

> t=read.csv("https://data.cdc.gov/api/views/9bhg-hcku/rows.csv")
> t2=t[t$Group=="By Month"&t$Sex=="All Sexes"&t$State=="New York City",]
> t2$yearmonth=sprintf("%s-%02d",t2$Year,t2$Month)
> age1=t2|>subset(Age.Group%in%c("55-64 years","65-74 years","75-84 years","85 years and over"))|>with(tapply(COVID.19.Deaths,yearmonth,sum))
> age2=t2|>subset(Age.Group=="All Ages")|>with(tapply(COVID.19.Deaths,yearmonth,sum))
> options(width=100)
> round(100*(1-age1/age2),1)
2020-01 2020-02 2020-03 2020-04 2020-05 2020-06 2020-07 2020-08 2020-09 2020-10 2020-11 2020-12
    NaN     NaN    14.4     9.6     9.6    14.0    14.0    15.7    12.1     8.1     9.5     5.8
2021-01 2021-02 2021-03 2021-04 2021-05 2021-06 2021-07 2021-08 2021-09 2021-10 2021-11 2021-12
    7.6     6.7     9.8    10.4    10.1    11.9    14.3    19.2    18.2    17.2     9.7    10.4
2022-01 2022-02 2022-03 2022-04 2022-05 2022-06 2022-07 2022-08 2022-09 2022-10 2022-11 2022-12
    7.9     6.0     6.8     4.2    10.4     5.6     6.2     7.6     6.6     3.8     6.3     5.3
2023-01 2023-02 2023-03 2023-04 2023-05 2023-06 2023-07 2023-08 2023-09
    6.7      NA      NA      NA      NA      NA      NA      NA      NA

The heatmap below shows that in March 2020, there was a total of 16 states which had a sufficient number of COVID deaths that I was able to calculate the percentage of COVID deaths in ages 0-54 out of all COVID deaths. The percentage was about 14% in New York City, but it was higher in 4 out of the 16 states with data available: about 15% in Louisiana and Texas, about 17% in Illinois, and about 19% in Michigan. And in summer 2021, the percentage of COVID deaths in ages 0-54 reached above 30% in some southern states (R code):

Hockett also posted the tweet below which showed the number of COVID deaths in ages 35-54 in NYC, and she asked "Why did New York City hospitals see more COVID-19 deaths among younger adults than anyplace else in the world?" [https://x.com/Wood_House76/status/1701623517207273775]

Hockett's plot showed that the peak in COVID deaths among ages 35-54 was on the week ending April 11th, when there was around 400-500% excess mortality. But in a paper which looked at the number of excess deaths in 90 municipalities in the Indian state of Gujarati, there was a week in April 2021 when there was about 900% weekly excess mortality in the age group 40-64 and about 400% excess mortality in the age group 20-39: [https://www.ncbi.nlm.nih.gov/pmc/articles/PMC10021770/]

The population of the state of Gujarat is about 60 million, so even in absolute terms, the peak weekly number of excess deaths among younger adults was probably higher in Gujarat than in New York City.

In the tweet below Hockett indicated that it was somehow anomalous that the peak weekly excess mortality in NYC was about 569% in ages 20-69 and about 694% in ages 70 and over, since she would've expected older age groups to have much higher excess mortality: [https://x.com/EWoodhouse7/status/1702380430131937449]

However the excess mortality caused by COVID isn't necessarily the highest in the oldest age groups. For example according to the plot below, in Ecuador there was higher excess mortality in the age group 60-69 than in age groups 70-79 or 80 and above, and the 60-69 age group accounts for a large percentage of all deaths in people between the ages of 0 and 69: [https://gh.bmj.com/content/6/9/e006446, figure S3]

Mutations of GISAID samples from New York City in March 2020

Among a set of 719,680 GISAID entries with a collection date in 2020 or earlier, there's a total of 562 samples where the value of the city field is New York City and the collection date is in March 2020 (but it doesn't include all samples from NYC, since in some samples the city field is set to one of the counties of NYC or it's empty):

$ curl https://sars2.net/f/gisaid2020.tsv.xz|xz -dc>gisaid2020.tsv
$ awk -F\\t '$8=="New York City"&&$4~"2020-03"' gisaid2020.tsv|wc -l
562

Here's the most common sets of mutations among the 562 samples, where the second field shows how many times the same set of mutations is found in total among the 719,680 entries with a collection date in 2020 or earlier:

$ awk -F\\t '$8=="New York City"&&$4~"2020-03"{a[$5" "$12]++}END{for(i in a)print a[i],i}' gisaid2020.tsv|sort -rn|head|tr \  \\t|awk -F\\t 'NR==FNR{a[$12]++;next}{print$1,a[$3],$2,$3}' gisaid2020.tsv -|column -t
133  5419  B.1      C241T,C1059T,C3037T,C14408T,A23403G,G25563T
35   248   B.1      C241T,C1059T,C3037T,C11916T,C14408T,C18998T,A23403G,G25563T,G29540A
19   456   B.1      C241T,C3037T,C14408T,C18877T,A23403G,G25563T
14   33    B.1      C241T,C1059T,C3037T,C4113T,C11916T,C14408T,C18998T,A23403G,G25563T,G29540A
8    9     B.1      C241T,C1059T,C3037T,A8031G,C8890T,C11916T,C14408T,C18998T,A23403G,G25563T,G29540A
7    2790  B.1      C241T,C3037T,C14408T,A23403G
6    89    B.1.319  C241T,C1059T,C3037T,C10851T,C14408T,A23403G,G25563T
6    24    B.1      C241T,C1059T,C14408T,A23403G,G25563T
5    21    B.1.332  C241T,C1059T,C1917T,C3037T,C14408T,G20005A,A23403G,G25563T
5    17    B.1.302  C241T,C1059T,C3037T,C14408T,A23403G,G25563T,G28077T

The output above shows that the set of mutations C241T,C3037T,C14408T,A23403G is found in a total of almost 3,000 sequences from 2020 even though it's found in only 7 sequences from March 2020 where the city field is New York City. The four mutations consist of D614G and the mutations that are usually found together with D614G, and the PANGO clade which includes the four mutations is B.1, but most strains which circulated in New York City in March 2020 had already acquired additional mutations in addition to the four basic mutations of B.1. The four B.1 mutations are found in all ten mutations sets shown above, with the exception of C3037T which is missing from one set.

The set of mutations on the 5th place above appears to be almost exclusive to New York City, because it appears a total of 9 times among the GISAID samples but 8 of the samples are from New York City and the 9th one is from New Jersey. The mutation set has the same 9 mutations as the mutation set on the second place, but it has the additional mutations A8031G and C8890T. There's only a total of 10 samples on GISAID with both of the mutations and a collection date in 2020, and all samples are from New York or New Jersey, and the oldest sample has a collection date on March 15th, and the newest sample which has three extra mutations also has the latest collection date:

$ tab()(awk '{if(NF>m)m=NF;for(i=1;i<=NF;i++){a[NR][i]=$i;l=length($i);if(l>b[i])b[i]=l}}END{for(h in a){for(i=1;i<=m;i++)printf(i==m?"%s\n":"%-"(b[i]+n)"s",a[h][i])}}' "${1+FS=$1}" "n=${2-1}")
$ grep 'A8031G.*C8890T' gisaid2020.tsv|cut -f2,4-8,12|tab \\t
hCoV-19/USA/NY-NYCPHL-000306/2020 2020-03-15 B.1 USA New York   New York City C241T,C1059T,C3037T,A8031G,C8890T,C11916T,C14408T,C18998T,A23403G,G25563T,G29540A
hCoV-19/USA/NY-NYCPHL-000308/2020 2020-03-15 B.1 USA New York   New York City C241T,C1059T,C3037T,A8031G,C8890T,C11916T,C14408T,C18998T,A23403G,G25563T,G29540A
hCoV-19/USA/NY-NYCPHL-000692/2020 2020-03-15 B.1 USA New York   New York City C241T,C1059T,C3037T,A8031G,C8890T,C11916T,C14408T,C18998T,A23403G,G25563T,G29540A
hCoV-19/USA/NY-NYCPHL-000693/2020 2020-03-15 B.1 USA New York   New York City C241T,C1059T,C3037T,A8031G,C8890T,C11916T,C14408T,C18998T,A23403G,G25563T,G29540A
hCoV-19/USA/NJ-QDX-124/2020       2020-03-16 B.1 USA New Jersey               C241T,C1059T,C3037T,A8031G,C8890T,C11916T,C14408T,C18998T,A23403G,G25563T,G29540A
hCoV-19/USA/NY-NYCPHL-000057/2020 2020-03-17 B.1 USA New York   New York City C241T,C1059T,C3037T,A8031G,C8890T,C11916T,C14408T,C18998T,A23403G,G25563T,G29540A
hCoV-19/USA/NY-NYCPHL-000672/2020 2020-03-18 B.1 USA New York   New York City C241T,C1059T,C3037T,A8031G,C8890T,C11916T,C14408T,C18998T,A23403G,G25563T,G29540A
hCoV-19/USA/NY-NYCPHL-000837/2020 2020-03-24 B.1 USA New York   New York City C241T,C1059T,C3037T,A8031G,C8890T,C11916T,C14408T,C18998T,A23403G,G25563T,G29540A
hCoV-19/USA/NY-NYCPHL-000105/2020 2020-03-26 B.1 USA New York   New York City C241T,C1059T,C3037T,A8031G,C8890T,C11916T,C14408T,C18998T,A23403G,G25563T,G29540A
hCoV-19/USA/NY-NYCPHL-000561/2020 2020-03-27 B.1 USA New York   New York City C241T,C1059T,C3037T,A8031G,C8890T,C11916T,C14408T,C18998T,T22367A,A23403G,G25563T,C29205T,C29284T,G29540A

Hockett says that viral spread has not been proven, but if the virus doesn't spread from one person to another, then how are they able to fabricate these local clusters of mutations which appear in a small geographic area and soon die out? If they were able to achieve the outbreak in NYC by "spraying clones" like J.J. Couey says, then did their spray bottle contain an ever-changing mixture of variants so that it simulated the natural emergence of new mutations? So if they had different spray bottles for different cities, then did they insert A8031G and C8890T to their spray bottle for New York City around mid-March, and in late March they also added T22367A, C29205T, and C29284T?

Out of the ten most common sets of mutations in the samples from New York City from March 2020, this set was on the second place: C241T,C1059T,C3037T,C11916T,C14408T,C18998T,A23403G,G25563T,G29540A. Out of a total of 248 samples with the mutation set, the earliest samples are from New York City, but a bit later there's also samples from Ontario and Quebec (which are both about 500 km away from NYC) and from Israel (which has a large number of people traveling to and from New York City):

$ awk -F\\t '$12=="C241T,C1059T,C3037T,C11916T,C14408T,C18998T,A23403G,G25563T,G29540A"' gisaid2020.tsv|cut -f6,7|sort|uniq -c|sort -rn|column -ts$'\t'
    130 USA             New York
     34 Canada          Quebec
     31 USA             Connecticut
      9 Canada          Ontario
      8 USA             Maryland
      6 USA             New Jersey
      5 USA             California
      2 USA             Utah
      2 USA             Pennsylvania
      2 USA             Florida
      2 Israel          Tel Aviv District
      2 Israel          Jerusalem District
      1 United Kingdom  England
      1 USA             Texas
      1 USA             Massachusetts
      1 USA             Delaware
      1 USA             Arizona
      1 Qatar           Doha
      1 Jamaica
      1 Israel          Maalot-Tarshicha
      1 Israel          Kfar Saba
      1 Israel          Gani Tikva
      1 Israel
      1 Ghana           Greater Accra
      1 France          Provence-Alpes-Cote d'Azur
      1 Australia       Victoria
      1 Argentina       Buenos Aires

In the output of my code which showed the most common mutation sets in New York City in March 2020, the mutation set on the fourth spot is only found in USA and Quebec, but the earliest sample from Quebec has a collection date 11 days later than the earliest sample from NYC. It appears to contradict Rancourt's claim that the virus did not spread from USA to Canada, especially since the collection date of the sample from Quebec is only three days after the US-Canada border was closed on March 21st:

$ awk -F\\t 'NR==1||$12=="C241T,C1059T,C3037T,C4113T,C11916T,C14408T,C18998T,A23403G,G25563T,G29540A"' gisaid2020.tsv|cut -f2,4,6-8|csvtk -t pretty|sed 2d
isolate                                         collection_date   country   region       city
hCoV-19/USA/NY-NYCPHL-000676/2020               2020-03-13        USA       New York     New York City
hCoV-19/USA/NY-NYCPHL-000677/2020               2020-03-13        USA       New York     New York City
hCoV-19/USA/NY-QDX-2714/2020                    2020-03-14        USA       New York
hCoV-19/USA/NY-QDX-2731/2020                    2020-03-14        USA       New York
hCoV-19/USA/NY-WCM-0563-1-P/2020                2020-03-15        USA       New York
hCoV-19/USA/NY-MSK-2652/2020                    2020-03-16        USA       New York
hCoV-19/USA/NY-NYCPHL-000730/2020               2020-03-16        USA       New York     New York City
hCoV-19/USA/NY-NYCPHL-000731/2020               2020-03-17        USA       New York     New York City
hCoV-19/USA/NY-NYUMC46/2020                     2020-03-18        USA       New York     Brooklyn
hCoV-19/USA/NY-NYUMC66/2020                     2020-03-18        USA       New York     Manhattan
hCoV-19/USA/NY-NYUMC82/2020                     2020-03-18        USA       New York     Brooklyn
hCoV-19/USA/NY-NYCPHL-000539/2020               2020-03-19        USA       New York     New York City
hCoV-19/USA/NY-NYCPHL-000744/2020               2020-03-19        USA       New York     New York City
hCoV-19/USA/NY-PV09141/2020                     2020-03-20        USA       New York     Brooklyn
hCoV-19/USA/NY-NYUMC724/2020                    2020-03-20        USA       New York     Brooklyn
hCoV-19/USA/NY-NYCPHL-000778/2020               2020-03-20        USA       New York     New York City
hCoV-19/USA/NY-PV09023/2020                     2020-03-21        USA       New York     Brooklyn
hCoV-19/USA/NY-NYCPHL-000514/2020               2020-03-22        USA       New York     New York City
hCoV-19/USA/NY-NYCPHL-000828/2020               2020-03-24        USA       New York     New York City
hCoV-19/USA/NY-NYCPHL-000829/2020               2020-03-24        USA       New York     New York City
hCoV-19/Canada/QC-JUS-V5260206/2020             2020-03-24        Canada    Quebec
hCoV-19/USA/NY-NYCPHL-000854/2020               2020-03-25        USA       New York     New York City
hCoV-19/USA/NY-NYCPHL-000856/2020               2020-03-26        USA       New York     New York City
hCoV-19/USA/NY-NYCPHL-000838/2020               2020-03-29        USA       New York     New York City
hCoV-19/USA/NY-NYCPHL-000418/2020               2020-03-30        USA       New York     New York City
hCoV-19/Canada/QC-JUS-V6020365/2020             2020-03-31        Canada    Quebec
hCoV-19/USA/NY-NYCPHL-000446/2020               2020-04-01        USA       New York     New York City
hCoV-19/USA/NY-NYCPHL-000843/2020               2020-04-01        USA       New York     New York City
hCoV-19/USA/NY-MSHSPSP-PV11103/2020             2020-04-01        USA       New York     Manhattan
hCoV-19/USA/NY-NYU-VC-022/2020                  2020-04-08        USA       New York
hCoV-19/USA/NY-MSHSPSP-PV14671/2020             2020-04-08        USA       New York     Queens
hCoV-19/USA/VA-DCLS-0279/2020                   2020-04-22        USA       Virginia
hCoV-19/USA/NJ-NYGC-NJ-BioR-582-Ampliseq/2020   2020-09-23        USA       New Jersey

Claim that the spike in excess deaths in NYC was anomalous because it only lasted about 6 weeks

Hockett posted this tweet: [https://x.com/EWoodhouse7/status/1706149132778209654]

However in Macao the excess mortality also went from about 11% in November 2022 to about 266% in December 2022, about 258% in January 2023, and about 3% in February 2023:

$ wget -q https://covid.ourworldindata.org/data/owid-covid-data.csv
$ sed '1n;/Macao/!d' owid-covid-data.csv|csvtk -T cut -f date,excess_mortality|awk -F\\t \$2|csvtk -t pretty
date         excess_mortality
----------   ----------------
2021-02-28   2.93
2021-03-31   -5.48
2021-04-30   0.48
2021-05-31   -2.43
2021-06-30   4.81
2021-07-31   -9.32
2021-08-31   5.07
2021-09-30   1.89
2021-10-31   10.05
2021-11-30   0.28
2021-12-31   9.32
2022-01-31   -8.24
2022-02-28   0.16
2022-03-31   7.87
2022-04-30   10.94
2022-05-31   7.58
2022-06-30   21.08
2022-07-31   2.76
2022-08-31   3.86
2022-09-30   -8.38
2022-10-31   4.8
2022-11-30   10.51
2022-12-31   265.97
2023-01-31   258.08
2023-02-28   2.68
2023-03-31   0.39

In March 2023, OWID switched to using data for COVID deaths and cases from the WHO instead of Johns Hopkins University. [https://github.com/owid/covid-19-data/issues/2784] WHO includes Macao as part of China but Johns Hopkins doesn't, so you can see the daily number of COVID deaths in Macao from the old version of OWID's data. [https://covid.ourworldindata.org/data/owid-covid-data-old.csv] During the wave of deaths in winter 2022-2023, the first COVID death was on December 17th, the last death was on February 3rd, and the penultimate death was on January 26th. So all COVID deaths except the final death took place within a 41-day period. Similar data is visible at Worldometers, even though it also includes one death on December 14th: [https://www.worldometers.info/coronavirus/country/china-macao-sar/]

And also in Ecuador in spring 2020, the first week with a clear increase in excess mortality was the week ending March 22nd, but about 6 or 7 weeks later the spike in deaths had already passed (even though the deaths did not return to the baseline until later in 2020).

The curve for the first wave of H1N1 deaths in Thailand also has similar shape as the curve for COVID deaths in NYC, where it goes from zero to maximum in about 6 weeks and then it takes about twice as many weeks to fall back close to zero: [https://www.researchgate.net/figure/The-3-waves-of-the-2009-H1N1-influenza-pandemic-in-Thailand-based-on-national-Thai_fig1_273153319]

Claim that a geographic expansion of early COVID cases in NYC represented an expansion of testing

Hockett tweeted the video shown below from a paper by Reichberg et al. titled "Rapid Emergence of SARS-CoV-2 in the Greater New York Metropolitan Area: Geolocation, Demographics, Positivity Rates, and Hospitalization for 46 793 Persons Tested by Northwell Health". The video showed that early COVID cases in New York mostly appeared around NYC but later the cases spread to the eastern part of Long Island and north of NYC, but Hockett said that it was because of an expansion of testing and not an expansion of the virus: [https://x.com/EWoodhouse7/status/1687453210665996288]

However if you look at the daily PCR positivity rate in different counties of New York State, it reached above 50% for three consecutive days first in Queens, then in Kings and Bronx, then in Nassau (which is the county of Long Island that is between NYC and Suffolk), then in Suffolk (which is the county of Long Island that is east of Nassau), and then in Rockland (which is north of NYC):

Hockett also mentioned that Reichberg et al. wrote: "Our data reveal that SARS-CoV-2 incidence emerged rapidly and almost simultaneously across a broad demographic population in the region. These findings support the premise that SARS-CoV-2 infection was widely distributed prior to virus testing availability." [https://pubmed.ncbi.nlm.nih.gov/32640030/] However from my heatmap above, you can see that on the first days of March there were days with 0% positive PCR tests in many counties of NYC, and the PCR positivity rate in NYC didn't reach the peak until the last days of March or the first days of April.

For example in Bronx there's a total of 29 tests listed between March 1st and March 7th but zero of them are positive, and on March 10th there's 47 tests listed but zero of them are positive: [https://health.data.ny.gov/Health/New-York-State-Statewide-COVID-19-Testing-Archived/xdss-u53e]

$ curl -s 'https://health.data.ny.gov/api/views/xdss-u53e/rows.csv'>New_York_State_Statewide_COVID-19_Testing.csv
$ (sed -u 1q;grep Bronx|tac|head -n16)<New_York_State_Statewide_COVID-19_Testing.csv|cut -d, -f1,2,3,5
Test Date,County,New Positives,Total Number of Tests Performed
03/01/2020,Bronx,0,0
03/02/2020,Bronx,0,0
03/03/2020,Bronx,0,1
03/04/2020,Bronx,0,0
03/05/2020,Bronx,0,5
03/06/2020,Bronx,0,6
03/07/2020,Bronx,0,17
03/08/2020,Bronx,1,16
03/09/2020,Bronx,4,31
03/10/2020,Bronx,0,47
03/11/2020,Bronx,2,31
03/12/2020,Bronx,3,36
03/13/2020,Bronx,10,99
03/14/2020,Bronx,8,80
03/15/2020,Bronx,29,116
03/16/2020,Bronx,29,151

So if there was no novel virus and the PCR tests were simply picking up some virus which had existed in the background before 2020, then why was the percentage of positive PCR tests so low during the first days of March 2020? And why did the virus disappear after May 2020 so that the PCR positivity rate fell back to about 10% or less?

Here you can also see an animation of how the area of counties with a high PCR positivity rate gradually expanded from NYC to the counties north of NYC and to Suffolk County (R code):

Hockett also posted the tweet below, but according to my heatmap above, the percentage of positive PCR tests first reached above 50% on March 24th in Kings County but on March 28th in New York County. Kings County is the county of Brooklyn and New York County is the county of Manhattan:

Other US counties with high excess deaths per capita in 2020

You can use CDC WONDER to get weekly all-cause deaths by county from 2018 up to present. [https://wonder.cdc.gov/mcd-icd10-provisional.html] Click the "I Agree" button, and in section 1, set "Group Results By" to "Residence County" and set "And By" to "MMWR Week" (MMWR is Morbidity and Mortality Weekly Report). In section 2, set the residence state to a single state or up to about 5 states, because otherwise there's an error that the number of rows returned is too high. And in section 8, check "Export Results" and click "Send".

However one serious limitation of CDC WONDER is that for privacy reasons it suppresses the count of deaths for counties with 1-9 deaths. [https://wonder.cdc.gov/wonder/help/mcd-provisional.html] And in order for a county to have 10 or more deaths each week, its population needs to be around 50-100 thousand or higher.

Among the counties where the population was 100,000 or higher and the number of deaths was 10 or more each week in 2018-2020, I wasn't able to find any county where the maximum weekly percentage of excess deaths in 2020 was higher than in the counties of New York City. Even though it's interesting that the total percentage of excess deaths in 2020 was the highest in Imperial County of California and not in any county of New York State or New Jersey:

In order to see the weekly number of deaths in smaller counties, you can look at the dataset for COVID deaths by county which was published by the New York Times. [https://github.com/nytimes/covid-19-data/blob/master/us-counties-2020.csv] On the week ending April 12th when NYC had the highest number of COVID deaths, the number of COVID deaths per capita was almost as high in Mitchell County in Georgia. And later in August 2020 or December 2020, some small counties in southern states had higher COVID deaths per capita than NYC in spring 2020 (R code):

In order to get data for smaller counties from CDC WONDER, I looked at monthly data instead of weekly data, and now when I sorted counties by the average percentage of excess deaths in 2020, the highest-ranking county of New York City was Bronx which only came on 10th place. The highest monthly excess mortality in 2020 was 550% in Queens, but there was also about 393% excess mortality in July 2020 in Macon, Tennessee, and there was about 380% excess mortality in December 2020 in Ray, Missouri. However there's something weird going on, because for example in Ray, Missouri, there was also 774% excess mortality in December 2021:

It could be that some small county had high excess deaths in 2020 if they had a new old folks home open in 2020 and they had a lot of old people moving in from other counties. Because in the plot above, I was not looking at age-standardized mortality or even CMR but simply the excess number of deaths. Some counties might also have increased deaths if they have merged with other counties so their population has increased, or if a lot of new people have moved in to the county for some other reason. So it might be better to look at CMR, but CDC WONDER doesn't seem to return population numbers for weekly or monthly data but only for yearly data.

When I compared 2020 and 2021 population numbers in yearly data from CDC WONDER, the highest increase in population was only about 33% though:

> t=readLines("Provisional Mortality Statistics, 2018 through Last Week.txt")
> t=paste(t[1:(which(t=="\"---\"")[1]-1)],collapse="\n")
> t=read.table(sep="\t",text=t,header=T)
> t1=t[t$Year==2020,c("Residence.County","Population")]
> t2=t[t$Year==2021,c("Residence.County","Population")]
> me=merge(t1,t2,by=1)
> me$ratio=me[,3]/me[,2]
> me[order(-me$ratio),][1:6,]|>`colnames<-`(c("county","pop2020","pop2021","ratio"))|>print.data.frame(row.names=F)
                  county pop2020 pop2021    ratio
      Madison County, ID   40318   53881 1.336401
      Trinity County, CA   12216   16060 1.314669
    Nantucket County, MA   11376   14491 1.273822
        Dukes County, MA   17461   21097 1.208235
       Concho County, TX    2827    3341 1.181818
 North Slope Borough, AK    9294   10972 1.180547

Distribution of monthly excess deaths by county in the United States

Jessica Hockett has been saying that the deaths attributed to COVID were not caused by a virus, because for example Chicago had much lower excess mortality than NYC or Bergamo, so she has been asking why the virus would behave in such a different way in different cities:

However if there's some kind of a long-tail distribution for the monthly number of COVID deaths per capita by city, then at the tail of the distribution you'd expect to find outlier cities that had a very high number of COVID deaths during a single month.

You can download data for monthly number of deaths by county from CDC WONDER: https://wonder.cdc.gov/mcd-icd10-provisional.html. Click the "I Agree" button, in section 1 set "Group Results By" to "Residence County" and set "And By" to "Month". In section 2, select the first 30 states from the list of residence states, because otherwise there's an error that the number of rows returned is too high. In section 8, check "Export Results", increase the timeout to 15 minutes, and click "Send". And then repeat the procedure for the rest of the states.

Then if you calculate the excess percent of deaths for each US county during each month of 2020, it will end up having a long-tail distribution like this, where there's a handful of months when some county had over 300% excess mortality:

Now I haven't ruled out the possibility that the number of deaths in NYC was artificially inflated, but in the plot above if you only look at the part of the plot with under 200% excess deaths and you ignore rest of the plot, the distribution looks like there would be at least a couple of counties that had over 300% excess deaths during some month of 2020.

In the plot below, I took excess mortality percentages for each country at OWID from 2020 to 2023, I interpolated it to daily data and calculated monthly averages of the daily data, and I counted the number of occurrences for each percentage value rounded to an integer. So then as expected, I got a similar distribution as for the data from CDC WONDER (even though the maximum percentage was lower because I looked at country-level data instead of county-level data and I looked at monthly and not weekly data):

GIF map of monthly excess mortality by US county in 2020

Hockett tweeted that there was "no sudden spread of a deadly novel coronavirus" but that there was a "sudden spread of testing, accompanied by iatrogenic measures and policies". [https://x.com/Wood_House76/status/1711722691802058798]

But if there was no viral spread, then why are there clusters of neighboring US counties that had high excess mortality during 1-3 adjacent months in 2020? Were neighboring counties told to adopt the "iatrogenic measures and policies" for one or two months and then drop them later? For example from the GIF file below you can see that in July 2020, there were three neighboring counties in the southernmost point of Texas which all had around 250-300% excess mortality, so were those counties told to implement some kind of special iatrogenic protocols which were not given to counties in other parts of Texas?

I made the plot above using the usmap R package: stat.html#Make_a_GIF_map_for_monthly_excess_mortality_by_U_S_county.

The three counties at the southernmost point of Texas were Hidalgo, Cameron, and Starr, which according to my calculation were the three counties with the highest excess mortality in Texas in July 2020 (but in order to calculate the trend for excess mortality correctly, I had to exclude small counties which had less than 10 deaths during any month in 2018-2020, since CDC WONDER hides the number of deaths during months with less than 10 deaths):

> t=do.call(rbind,Sys.glob("d/cd/wondermonth2/*")|>lapply(\(x){t=readLines(x);t=paste(t[1:(which(t=="\"---\"")[1]-1)],collapse="\n");read.table(sep="\t",text=t,header=T)}))
> t$fips=t$Residence.County.Code
> t$date=as.Date(paste0(t$Month.Code,"/1"),"%Y/%m/%d")
> t$prediction=t$date<as.Date("2020-1-1")
> t=t[t$date<=as.Date("2020-12-1"),]
> ta=table(t$fips)
> t=t[t$fips%in%names(ta[ta==max(ta)]),]
> t$model=split(t,factor(t$fips,unique(t$fips)))|>lapply(\(x){model=predict(lm(Deaths~date,x[x$prediction,]),x);month=substring(x$date,6,7);model+tapply((x$Deaths-model)[x$prediction],month[x$prediction],mean)[month]})|>unlist()
> t$excess=100*(t$Deaths-t$model)/t$model
> t2=t[t$date=="2020-7-1"&grepl("TX",t$Residence.County),]
> t2[order(-t2$excess),][1:10,c("Residence.County","excess","Deaths","model")]|>print.data.frame(row.names=F)
        Residence.County    excess Deaths     model
      Hidalgo County, TX 285.67934   1532 397.22118
      Cameron County, TX 251.26650    870 247.67520
        Starr County, TX 240.70846    131  38.44930
      Wharton County, TX 234.66304     72  21.51418
    Val Verde County, TX 223.01943    103  31.88663
       Lavaca County, TX 155.66330     39  15.25444
     Maverick County, TX 139.60695     91  37.97886
 San Patricio County, TX 119.30560     98  44.68650
         Webb County, TX 118.87597    254 116.04746
       Nueces County, TX  97.96305    500 252.57239

Substack comment by someone from Brooklyn about deaths in New York City

In the comment section of a Substack article where Hockett questioned the number of deaths in New York City in spring 2020, someone from Brooklyn wrote the following: [https://pandauncut.substack.com/p/does-new-york-city-2020-make-any/comments]

What I have to add to to your scholarly work is the experience of having been on the ground here in Brooklyn. I must say that tragically I do not believe the numbers are wrong for NYC. I lived through an extremely traumatic spring that year - I was 9 months pregnant and continuously in terrible fear, as so many friends, relatives, neighbors, and friends-of-friends and friends-of-relatives, etc were on our prayer lists, many of them hospitalized, on a respirator, etc. I cannot begin to describe what it was like! I can send you my prayer list if you would like to see it. There were dozens of people on it. Many of them did not make it. And some of them were young!! My husband lost his friend from our synagogue, who lived in our neighborhood. He was around 50. We lost a dear family friend, also 50. We lost one of our Rabbis. He wasn't very old. We lost my husband's aunt. We lost a venerated community member, a Holocaust survivor we knew, author of "The Youngest Partisan." There are SO many more. It wasn't just in NYC, actually, but also nearby religious Jewish communities, such as Monsey NY and Lakewood NJ. I was told that a total of ONE THOUSAND Orthodox Jews on the East Coast died in the one month between Purim and Passover 2020. A Jewish magazine (Mishpacha) published their bios, and the community is close-knit, so I know they have to be real people. Maimonides Hospital, which I'm glad you mentioned, became known as a death trap. We heard about an Orthodox Jewish man who walked in on his own two feet, on the Sabbath, wearing his Sabbath clothing, and within hours was in a body bag. HOW did this happen? I don't know! I heard there were protests outside the hospital because the community realized that people were being murdered.

There was a refrigerated truck parked outside Maimonides to hold the bodies. I don't think it was just for show, because I heard that the Jewish funeral homes had to deal with a massive amount of deaths. And I know that was true. We kept on hearing about one death in the religious community after another, nonstop. They were real people. We heard their names. A massive amount of families had to sit shiva when Passover ended. And an organization I spoke to later on was helping the hundreds of new orphans.

It was so horrible that when I finally dared to emerge into the world (probably in May), I was kind of surprised to see community members walking around in Borough Park - wow, there were survivors!

Obituary of a 33-year-old who died of COVID at home in NYC

Hockett tweeted an obituary which said that "Kyra Michelle Swartz, age 33, died unexpectedly on April 5, 2020, at her home in New York City from COVID-19", and Hockett was questioning if the 33-year-old actually died of COVID. [https://x.com/search?q=wood_house76%20hypocrisy_in&f=live, https://www.legacy.com/us/obituaries/timesunion-albany/name/kyra-swartz-obituary?id=5047999] Someone replied to the tweet: "Went to elementary, middle, and high school with her. Family friends as well. My dad did road biking with her parents." Then Hockett replied: "Then you should want the truth about her death - and about what actually happened in NYC in those weeks. New York City is a global outlier with young deaths attributed to COVID in this period." And the Twitter user replied: "The story you posted is very similar to what everyone heard. She lived alone, tested positive, was told to go back to her apartment alone, and then I think after a couple days her parents couldn’t reach her. And she was found dead." And then Hockett replied: "Tested positive where? You're saying she went to ED or outpatient facility and was tested?" And the other user replied: "I remember hearing something of that. But this was all second and third hand. I can probably get you in touch with friends or family of hers. I was not a close friend." And then Hockett replied: "You sound pretty 'sus' to me :)". But then as evidence that he knew the woman who died of COVID, the Twitter user posted her yearbook photo and a screenshot which showed that he had 28 mutual friends with her on Facebook. However after Hockett didn't post any further replies, he replied: "I thought I provided solid evidence that I was telling the truth. Not sure why you stopped replying. I would have thought you would want this type of info."

COVID deaths in Guam

In a reply to one of Hockett's tweets, someone asked if there was a pandemic at Guam: [https://twitter.com/TheBrettDarken/status/1747419041336098955]

According to the sources I looked up, Guam had a population of 168,801 and a yearly death rate of about 7.34 per thousand, which results in a weekly number of about 24 deaths. However according to OWID, the weekly number of COVID deaths in Guam peaked at 17 on the week ending September 12th 2021. The periods with high COVID deaths also had a high PCR positivity rate:

A report about COVID at Guam said: "Though overall vaccination coverage in Guam is high with 93.5% of the eligible population (age ≥5) vaccinated as of 1/22/2022, among individuals who died of COVID-19 in Guam in 2021 with known vaccination status, over 80% were not fully vaccinated." [https://dphss.guam.gov/wp-content/uploads/2022/02/Guam_covid19_DOA_2021_Report_2_1_2022_FINAL.pdf] According to Table 1 of the report, there were 132 deaths in people with a known vaccination status but 102 of the people were unvaccinated, which is about 77%:

Large number of positive PCR tests in NYC in late 2020

Hockett pointed out that there was a large number of positive PCR tests in NYC in late 2020 even though excess mortality remained low: [https://twitter.com/Wood_House76/status/1750299283616579776]

However there was a much larger number of tests being performed in late 2020 than in spring 2020, so the percentage of positive PCR tests wasn't that high in late 2020. And excess mortality also began to rise in November 2020 before the jabs were rolled out:

My plot above also shows that in June 2021 when the moving average for excess mortality was negative, the moving average of the PCR positivity rate fell below 1%. If PCR tests have a huge rate of false positives like some people claim, then why are there periods when there's less than 1% positive tests in entire states or entire countries? And how are the health authorities able to rig the tests so that periods of low PCR positivity coincide with periods of low excess mortality?

An article about a COVID-19 infection survey done by the ONS said: "We know the specificity of our test must be very close to 100% as the low number of positive tests in our study over the summer of 2020 means that specificity would be very high even if all positives were false. For example, in the six-week period from 31 July to 10 September 2020, 159 of the 208,730 total samples tested positive. Even if all these positives were false, specificity would still be above 99.9%." [https://www.ons.gov.uk/peoplepopulationandcommunity/healthandsocialcare/conditionsanddiseases/methodologies/covid19infectionsurveypilotmethodsandfurtherinformation#test-sensitivity-and-specificity]

Claim that Snohomish County Man transmitted the virus to no-one

Hockett wrote: [https://wherearethenumbers.substack.com/p/the-puzzle-of-australias-respiratory/comment/51045574]

I've seen no evidence that the CDC or anyone else that demonstrates that SARS-CoV-2 transmits from person to person.

Snohomish Man transmitted to no one.

However the Snohomish County Man may have actually been the progenitor of lineage nu which is found in over 3000 submissions at GISAID. In the WA1 sequence which is supposed to be the sample from the Snohomish County Man, there are 3 mutations from the Wuhan-Hu-1 reference genome, but all three mutations are ancestral in the sense that they are shared with RaTG13 and BANAL-52. WA1 is identical to the proCoV-2 sequence which Kumar et al. constructed as the hypothetical ancestor of known strains of SARS2. Kumar et al. named one sublineage of proCoV2 lineage nu, which has two additional mutations from proCoV2/WA1: nu1 (A17858G) and nu2 (C17747T).

On GISAID most of the earliest samples which contain both mutations are from the King or Snohomish counties of Washington State (which are neighboring counties in the Seattle metropolitan area):

$ grep A17858G gisaid2020.tsv|grep C17747T|cut -f4,6-8,11-12|head -n30|csvtk -t pretty -s\  |sed 2d
2020-02-21 USA    Washington    King County           4 C8782T,C17747T,A17858G,T28144C
2020-02-21 USA    Washington    King County           5 C8782T,C17747T,A17858G,C18060T,T28144C
2020-02-21 USA    Florida                             6 A1T,C8782T,C17747T,A17858G,C18060T,T28144C
2020-02-22 USA    Washington    King County           3 C17747T,A17858G,T28144C
2020-02-22 USA    Washington    King County           5 C8782T,C17747T,A17858G,C18060T,T28144C
2020-02-24 USA    Washington    Snohomish County      4 C5784T,C17747T,A17858G,T28144C
2020-02-24 USA    Washington    Snohomish             6 C5784T,C8782T,C17747T,A17858G,C18060T,T28144C
2020-02-24 USA    Washington    Snohomish County      6 C5784T,C8782T,C17747T,A17858G,C18060T,T28144C
2020-02-24 USA    Washington                          6 C5784T,C8782T,C17747T,A17858G,C18060T,T28144C
2020-02-24 USA    Washington    King County           7 C1878T,C8782T,C17747T,A17858G,C18060T,T21835C,T28144C
2020-02-24 USA    Washington    Snohomish County      6 C5784T,C8782T,C17747T,A17858G,C18060T,T28144C
2020-02-25 USA    Maryland                            6 C8782T,C17747T,A17858G,C18060T,A24694T,T28144C
2020-02-25 USA    Washington    King County           7 C1878T,C8782T,C17747T,A17858G,C18060T,T21835C,T28144C
2020-02-26 USA    Washington    King County           6 A4494G,C8782T,C17747T,A17858G,C18060T,T28144C
2020-02-26 USA    Washington                          6 C5784T,C8782T,C17747T,A17858G,C18060T,T28144C
2020-02-27 USA    Washington                          5 C8782T,C17747T,A17858G,C18060T,T28144C
2020-02-27 Panama Panama Center Amelia Denis de Icaza 6 C8782T,C17747T,A17858G,C18060T,A24694T,T28144C
2020-02-27 USA    California                          7 C5184T,C8782T,C17747T,A17858G,T21278C,T28144C,C29253T
2020-02-28 USA    Washington    King County           5 C8782T,C17747T,A17858G,C18060T,T28144C
2020-02-28 USA    Washington                          8 C8782T,C17747T,A17858G,C18060T,T28144C,T29867A,G29868A,C29870A
2020-02-28 USA    California    Sonoma County         7 C5184T,C8782T,C17747T,A17858G,C18060T,T28144C,C29253T
2020-02-28 USA    Washington                          5 C8782T,C17747T,A17858G,C18060T,T28144C
2020-02-28 USA    Washington    King County           5 C1326T,C17304T,C17747T,A17858G,T28144C
2020-02-28 USA    Washington    Snohomish County      5 C8782T,C17747T,A17858G,C18060T,T28144C
2020-02-28 USA    Washington    King County           6 C5784T,C8782T,C17747T,A17858G,C18060T,T28144C
2020-02-28 USA    Washington                          5 C8782T,C17747T,A17858G,C18060T,T28144C
2020-02-28 USA    Washington    Snohomish County      6 C8782T,C14805T,C17747T,A17858G,C18060T,T28144C

The Snohomish County Man may have also been the progenitor of the A.1 strain. WA1 is the 15th earliest lineage A submission on GISAID and the earliest lineage A submission outside China:

$ awk -F\\t '$5~/^A/&&!$19' gisaid2020.tsv|cut -f 2,4,5-8,10,11|head -n30|csvtk -t pretty -s\  |sed 2d
hCoV-19/Wuhan/IME-WH01/2019          2019-12-30 A   China     Hubei      Wuhan            Human       3
hCoV-19/env/Wuhan/IVDC-HBA20/2020    2020-01-01 A.5 China     Hubei      Wuhan            Environment 4
hCoV-19/Wuhan/WH04/2020              2020-01-05 A   China     Hubei      Wuhan            Human       3
hCoV-19/Guangdong/HKU-SZ-002/2020    2020-01-10 A   China     Guangdong  Shenzhen         Human       3
hCoV-19/Shenzhen/HKU-SZ-005/2020     2020-01-11 A   China     Guangdong  Shenzhen         Human       5
hCoV-19/Guangdong/SZTH-002/2020      2020-01-13 A   China     Guangdong  Shenzhen         Human       3
hCoV-19/Guangdong/20SF012/2020       2020-01-14 A   China     Guangdong  Shenzhen         Human       3
hCoV-19/Guangdong/20SF013/2020       2020-01-15 A   China     Guangdong  Shenzhen         Human       3
hCoV-19/Guangdong/20SF025/2020       2020-01-15 A   China     Guangdong  Shenzhen         Human       3
hCoV-19/Sichuan/IVDC-CD-001/2020     2020-01-15 A   China     Sichuan    Chengdu          Human       6
hCoV-19/Yunnan/01/2020               2020-01-17 A   China     Yunnan                      Human       5
hCoV-19/Yunnan/IVDC-YN-003/2020      2020-01-17 A   China     Yunnan     Kunming          Human       3
hCoV-19/Wuhan/HBCDC-HB-03/2020       2020-01-18 A   China     Hubei      Wuhan            Human       2
hCoV-19/USA/WA-UCB-0000001/2020      2020-01-19 A   USA       Washington                  Human       4
hCoV-19/USA/WA-UCB-0000002/2020      2020-01-19 A   USA       Washington                  Human       3
hCoV-19/USA/WA-FDA-002/2020          2020-01-19 A   USA       Washington                  Human       4
hCoV-19/USA/WA-FDA-001/2020          2020-01-19 A   USA       Washington                  Human       3
hCoV-19/USA/un-Yale-5643/2020        2020-01-19 A   USA                                   Human       3
hCoV-19/USA/WA-CDC-02982586-001/2020 2020-01-19 A   USA       Washington Snohomish County Human       3
hCoV-19/USA/WA-NIH-WA1/2020          2020-01-19 A   USA       Washington                  Human       3
hCoV-19/Guangdong/20SF123/2020       2020-01-20 A   China     Guangdong  Zhanjiang        Human       3
hCoV-19/Chongqing/YC01/2020          2020-01-21 A   China     Chongqing  Yongchuan        Human       5
hCoV-19/Fujian/8/2020                2020-01-21 A   China     Fujian                      Human       3
hCoV-19/Guangdong/20SF115/2020       2020-01-21 A   China     Guangdong  Guangzhou        Human       6
hCoV-19/Guangdong/20SF117/2020       2020-01-21 A   China     Guangdong  Shenzhen         Human       3
hCoV-19/Guangdong/20SF118/2020       2020-01-21 A   China     Guangdong  Shenzhen         Human       3
hCoV-19/USA/WA-SBC-0000001/2020      2020-01-22 A   USA       Washington Snohomish        Human       3
hCoV-19/HongKong/HKU-230516-001/2020 2020-01-22 A   Hong Kong                             Human       7
hCoV-19/USA/AZ-CDC-02993465-001/2020 2020-01-22 A   USA       Arizona    Phoenix County   Human       4
hCoV-19/HongKong/VM20001061-2/2020   2020-01-22 A   Hong Kong                             Human       7

The 13 earliest A.1 samples on GISAID are all from Snohomish or King County, apart from one sample from Florida and possibly one sample where the state is listed as Washington but the county is missing:

$ awk -F\\t '$5=="A.1"' gisaid2020.tsv|cut -f 4,5-8,11,12|head -n30|csvtk -t pretty -s\  |sed 2d
2020-02-21 A.1 USA    Washington    King County           4 C8782T,C17747T,A17858G,T28144C
2020-02-21 A.1 USA    Washington    King County           5 C8782T,C17747T,A17858G,C18060T,T28144C
2020-02-21 A.1 USA    Florida                             6 A1T,C8782T,C17747T,A17858G,C18060T,T28144C
2020-02-22 A.1 USA    Washington    King County           3 C17747T,A17858G,T28144C
2020-02-22 A.1 USA    Washington    King County           5 C8782T,C17747T,A17858G,C18060T,T28144C
2020-02-24 A.1 USA    Washington    Snohomish County      4 C5784T,C17747T,A17858G,T28144C
2020-02-24 A.1 USA    Washington    Snohomish             6 C5784T,C8782T,C17747T,A17858G,C18060T,T28144C
2020-02-24 A.1 USA    Washington    Snohomish County      6 C5784T,C8782T,C17747T,A17858G,C18060T,T28144C
2020-02-24 A.1 USA    Washington                          6 C5784T,C8782T,C17747T,A17858G,C18060T,T28144C
2020-02-24 A.1 USA    Washington    King County           7 C1878T,C8782T,C17747T,A17858G,C18060T,T21835C,T28144C
2020-02-24 A.1 USA    Washington    Snohomish County      6 C5784T,C8782T,C17747T,A17858G,C18060T,T28144C
2020-02-25 A.1 USA    Maryland                            6 C8782T,C17747T,A17858G,C18060T,A24694T,T28144C
2020-02-25 A.1 USA    Washington    King County           3 C1878T,T21835C,T28144C
2020-02-25 A.1 USA    Washington    King County           7 C1878T,C8782T,C17747T,A17858G,C18060T,T21835C,T28144C
2020-02-26 A.1 USA    Washington    King County           6 A4494G,C8782T,C17747T,A17858G,C18060T,T28144C
2020-02-26 A.1 USA    Washington                          6 C5784T,C8782T,C17747T,A17858G,C18060T,T28144C
2020-02-27 A.1 USA    Washington                          5 C8782T,C17747T,A17858G,C18060T,T28144C
2020-02-27 A.1 Panama Panama Center Amelia Denis de Icaza 6 C8782T,C17747T,A17858G,C18060T,A24694T,T28144C
2020-02-27 A.1 USA    California                          7 C5184T,C8782T,C17747T,A17858G,T21278C,T28144C,C29253T
2020-02-28 A.1 USA    Washington    King County           5 C8782T,C17747T,A17858G,C18060T,T28144C
2020-02-28 A.1 USA    Washington                          8 C8782T,C17747T,A17858G,C18060T,T28144C,T29867A,G29868A,C29870A
2020-02-28 A.1 USA    California    Sonoma County         7 C5184T,C8782T,C17747T,A17858G,C18060T,T28144C,C29253T
2020-02-28 A.1 USA    Washington                          5 C8782T,C17747T,A17858G,C18060T,T28144C
2020-02-28 A.1 USA    Washington    King County           5 C1326T,C17304T,C17747T,A17858G,T28144C
2020-02-28 A.1 USA    Washington    Snohomish County      5 C8782T,C17747T,A17858G,C18060T,T28144C
2020-02-28 A.1 USA    Washington    King County           5 G768T,C8782T,C17747T,G22661T,T28144C
2020-02-28 A.1 USA    Washington    King County           6 C5784T,C8782T,C17747T,A17858G,C18060T,T28144C

However it could of course be that there were multiple transmissions of proCoV2/WA1 to Washington State, so Snohomish County Man is not necessarily the progenitor of the substrains of lineage A in Washington State. But the possibility remains that he may have even seeded hundreds of thousands of COVID infections in the United States.

Pierre Kory's video response to Hockett

Pierre Kory was the head of an ICU department at the Beth Israel Hospital in Manhattan in spring 2020. I recommend listening to these videos where he answered questions by Hockett: https://www.woodhouse76.com/p/pierre-kory-responds-to-my-questions.

Denis Rancourt

Claim that sudden surges in all-cause mortality in spring 2020 occurred only in the "northern-hemisphere western world"

Rancourt wrote: "Hot spots of sudden surges in all-cause mortality occurred only in specific locations in the Northern-hemisphere Western World, which were synchronous with the March 11, 2020 declaration of a pandemic." [https://denisrancourt.substack.com/p/there-was-no-pandemic/]

However according to WHO's excess mortality data, there were also several Latin American and Asian countries that had over 50% excess mortality during March, April, or May 2020. Here only the month with the highest excess mortality percent is listed for each country:

> t=read.csv("https://pastebin.com/raw/PVTHyL8V")
> t2=t[t$year==2020&t$month>=3&t$month<=5,]
> t2$excess=100*t2$excess.mean/t2$expected.mean
> t2=t2[order(-t2$excess),]
> t2=t2[!duplicated(t2$country),]
> t2=t2[t2$excess>=50,]
> d=data.frame(round(t2$excess),t2$country,month.name[t2$month],t2$type)
> apply(d,2,\(x)format(x,width=max(nchar(x))))|>apply(1,paste,collapse=" ")|>writeLines()
222 Ecuador              April reported
170 Nicaragua            May   reported
138 San Marino           March reported
131 Andorra              April reported
128 Kuwait               May   reported
128 Peru                 May   reported
120 United Arab Emirates May   reported
 94 Tajikistan           May   reported
 87 The United Kingdom   April reported
 79 Spain                April reported
 66 Belgium              April reported
 58 Mexico               May   reported
 53 Italy                March reported

I used WHO's dataset of monthly excess mortality in 2020 and 2021, which uses reported data for developed countries but modeled data for some developing countries. [https://www.who.int/data/sets/global-excess-deaths-associated-with-covid-19-modelled-estimates] WHO's dataset also includes countries that are missing excess mortality data at OWID, like India and China and sub-Saharan African countries.

Here's a heatmap of the same dataset published by the WHO, where you can see that for example in Nicaragua the excess mortality jumped up from about 2% in April 2020 to about 170% in May 2020:

Comparison of Canada and United States

Rancourt wrote: "It is extremely unlikely that a virulent and contagious viral respiratory pathogen that would have caused the exceedingly large COVID-era excess mortality in the USA, could not have crossed the border into Canada, the world's longest international land border (8,890 km) between two major trading partners; where both countries are normally (pre-COVID-era) continuously subject to seasonal (winter) viral respiratory disease epidemics having virtually identical mortality characteristics." [https://denisrancourt.ca/entries.php?id=107&name=2021_10_25_nature_of_the_covid_era_public_health_disaster_in_the_usa_from_all_cause_mortality_and_socio_geo_economic_and_climatic_data]

However Canada had about 24% excess mortality in April 2020, and the major spikes in excess mortality in Canada occurred at roughly the same time as in the United States (R code):

In a set of GISAID submission with a collection date in 2020, 1006 out of 1031 B.1.577 samples have the country listed as USA. However there's a sublineage of B.1.577 which is first found in Oregon and Washington State but which is a few days later found in British Columbia:

$ curl -Ls sars2.net/f/gisaid2020.tsv.xz|xz -dc>gisaid2020.tsv
$ awk -F\\t '$5=="B.1.577"' gisaid2020.tsv|cut -f6|sort|uniq -c|sort
      1 Chile
      1 Mexico
     23 Canada
   1006 USA
$ awk -F\\t 'NR==1||$12=="C241T,C1059T,T1482A,C3037T,C3045T,C7834T,C10030T,C10319T,A11782G,C14408T,C16694T,T17407C,C21057T,A23403G,A25105G,G25234A,G25563T,C27964T,C28892T"' gisaid2020.tsv|cut -f2,4,6-8|csvtk -t pretty|sed 2d
isolate                              collection_date   country   region             city
hCoV-19/USA/OR-OHSU-3241/2020        2020-10-07        USA       Oregon             Clackamas County
hCoV-19/USA/WA-PHL-028819/2020       2020-10-09        USA       Washington         Snohomish County
hCoV-19/USA/TX-HMH-MCoV-14600/2020   2020-10-10        USA       Texas              Houston
hCoV-19/USA/OR-OHSU-3359/2020        2020-10-12        USA       Oregon             Multnomah County
hCoV-19/Canada/BC-BCCDC-5720/2020    2020-10-14        Canada    British Columbia
hCoV-19/USA/OR-OSPHL00979/2020       2020-10-16        USA       Oregon             Marion County
hCoV-19/USA/CA-CDPH-MC1198157/2020   2020-10-17        USA       California         San Luis Obispo County
hCoV-19/USA/WA-S5365/2020            2020-10-23        USA       Washington         Snohomish County
hCoV-19/USA/OR-OHSU-4259/2020        2020-10-30        USA       Oregon             Multnomah County
hCoV-19/USA/CA-OHSU-4227/2020        2020-11-04        USA       California         Los Angeles County
hCoV-19/USA/OR-PROV-593/2020         2020-11-06        USA       Oregon
hCoV-19/USA/OR-PROV-597/2020         2020-11-07        USA       Oregon
hCoV-19/USA/TX-HMH-MCoV-17990/2020   2020-11-16        USA       Texas              Houston
hCoV-19/USA/ME-HETL-J13136/2020      2020-12-07        USA       Maine
hCoV-19/USA/WA-UW-45114/2020         2020-12-08        USA       Washington

The last line of output below shows a 22-mutation sublineage of B.1.577, which is found in 14 submissions at GISAID but all of them are from British Columbia, and the lines above it show its potential ancestor lineages which are found exclusively in the USA:

$ awk -F\\t 'NR==FNR{a[$0];next}!$19{n=0;split($12,b,",");for(i in b){if(b[i]in a)n++;else next}print n FS$0}' <(tr , \\n<<<C241T,C1059T,T1482A,C3037T,C7834T,C10030T,C10319T,A11782G,C13356T,A14010G,C14408T,C16694T,T17407C,C17746T,G21624A,A23403G,A25105G,G25234A,C25521T,G25563T,C27964T,C28892T) gisaid2020.tsv|awk '!a[$1]++'|cut -f1,5-8,13|sort -n|awk -F\\t 'NR==FNR{a[$12]++;next}{print$0 FS a[$6]}' gisaid2020.tsv -|(printf 'mutations from Wuhan-Hu-1\tcollection date\tlineage\tcountry\tregion\tmutation set\tnumber of samples with same mutation set\n';cat)|tr \\t \|
mutations from Wuhan-Hu-1|collection date|lineage|country|region|mutation set|number of samples with same mutation set
0|2019-12-30|B|China|Hubei||2069
1|2020-02-25|Unassigned|Sweden||A23403G|691
2|2020-02-05|B|China|Guangzhou|C241T,A23403G|33
3|2020-01-24|B.1|China|Sichuan|C241T,C3037T,A23403G|44
4|2020-02-03|B.1|United Kingdom|England|C241T,C3037T,C14408T,A23403G|2790
5|2020-02-26|B.1|France|Bretagne|C241T,C3037T,C14408T,A23403G,G25563T|321
6|2020-02-13|B.1|France|Ile-de-France|C241T,C1059T,C3037T,C14408T,A23403G,G25563T|5419
7|2020-03-02|B.1|USA|Michigan|C241T,C1059T,C3037T,C14408T,A23403G,G25563T,C27964T|450
8|2020-03-13|B.1.595|USA|Minnesota|C241T,C1059T,C3037T,C10319T,C14408T,A23403G,G25563T,C27964T|135
9|2020-03-14|B.1.595|USA|Minnesota|C241T,C1059T,C3037T,C10319T,C14408T,C16694T,A23403G,G25563T,C27964T|3
14|2020-07-07|B.1.577|USA|Colorado|C241T,C1059T,C3037T,C7834T,C10030T,C10319T,C14408T,C16694T,T17407C,A23403G,A25105G,G25563T,C27964T,C28892T|5
17|2020-12-01|B.1.577|USA|Wyoming|C241T,C1059T,C3037T,C10030T,C10319T,A11782G,A14010G,C14408T,C16694T,T17407C,A23403G,A25105G,G25234A,C25521T,G25563T,C27964T,C28892T|1
22|2020-12-23|B.1.577|Canada|British Columbia|C241T,C1059T,T1482A,C3037T,C7834T,C10030T,C10319T,A11782G,C13356T,A14010G,C14408T,C16694T,T17407C,C17746T,G21624A,A23403G,A25105G,G25234A,C25521T,G25563T,C27964T,C28892T|14

In the code above I selected samples whose mutation set is a subset of the 22-mutation set that is found in British Columbia, and I displayed the earliest sample for each number of mutations from Wuhan-Hu-1. The samples displayed do not represent the actual chain of variants which led to the 22-mutation strain, and actually there's multiple possible chains which may have led to the strain, even though in each chain the ancestors with over 7 mutations are found exclusively in the USA.

In March 2020 there were also sublineages of B.1 which were first found in New York but which were later found in Quebec or Ontario: #Mutations_of_GISAID_samples_from_New_York_City_in_March_2020.

Kumar et al. reconstructed a hypothetical ancestor of known strains of SARS2, which they named proCoV2. [https://www.ncbi.nlm.nih.gov/pmc/articles/PMC7523107/] It is identical to the WA1 sample which is supposed to have been collected from the first known COVID case in the US, who has become known as the Snohomish County Man.

Kumar et al. named one sublineage WA1/proCoV2 lineage nu, which includes the nu1 mutation A17858G and the nu2 mutation C17747T. The oldest lineage nu samples on GISAID are all from Washington State.

When I searched for lineage nu samples from Canada that had the highest number of mutations from Wuhan-Hu-1, I found one sample which has the 3 WA1 mutations, 2 additional lineage nu mutations, and 6 other mutations from Wuhan-Hu-1. It is only found in a single sample in Manitoba, but its ancestors with 6 or more mutations from Wuhan-Hu are found exclusively in the United States (so it looks like another instance of the virus spreading from the United States to Canada):

$ grep A17858G gisaid2020.tsv|grep C17747T|grep Canada|sort -t$'\t' -rnk11|sed -n 4p|cut -f12|tr , \\n|awk -F\\t 'NR==FNR{a[$0];next}!$19{n=0;split($12,b,",");for(i in b){if(b[i]in a)n++;else next}print n FS$0}' - gisaid2020.tsv|cut -f1,5-8,13|sort -n|awk -F\\t 'NR==FNR{a[$12]++;next}{print$0 FS a[$6]}' gisaid2020.tsv -|cut -f1,4,5,6|awk '{++a[$0]}END{for(i in a)print a[i]"\t"i}'|sort -nk2|tail -n16|csvtk -t pretty|sed 2d
5    5    USA      Idaho         C8782T,C17747T,A17858G,C18060T,T28144C
5    5    USA      Illinois      C8782T,C17747T,A17858G,C18060T,T28144C
5    5    USA      Nebraska      C8782T,C17747T,A17858G,C18060T,T28144C
5    5    USA      Wisconsin     C8782T,C17747T,A17858G,C18060T,T28144C
59   5    USA      California    C8782T,C17747T,A17858G,C18060T,T28144C
6    5    Canada   Quebec        C8782T,C17747T,A17858G,C18060T,T28144C
8    5    USA      Connecticut   C8782T,C17747T,A17858G,C18060T,T28144C
8    5    USA      Vermont       C8782T,C17747T,A17858G,C18060T,T28144C
9    5    USA      New York      C8782T,C17747T,A17858G,C18060T,T28144C
9    5    USA      Texas         C8782T,C17747T,A17858G,C18060T,T28144C
3    6    USA      Minnesota     C1238T,C8782T,A17858G,C18060T,T28144C,T28924C
1    7    USA      Minnesota     C1238T,C8782T,C17747T,A17858G,C18060T,T28144C,T28924C
6    7    USA      Washington    C1238T,C8782T,C17747T,A17858G,C18060T,T28144C,T28924C
1    10   USA      California    C1238T,C3593T,C4683T,C8782T,C17747T,A17858G,C18060T,A27200G,T28144C,T28924C
2    10   USA      Washington    C1238T,C3593T,C4683T,C8782T,C17747T,A17858G,C18060T,A27200G,T28144C,T28924C
1    11   Canada   Manitoba      C1238T,C3593T,C4683T,C8782T,C17747T,A17858G,C18060T,A27200G,T28144C,T28924C,C29670T

In the output above the first column shows how many times the GISAID submissions include each combination of country, region, and mutation set. The second column shows the number of mutations from Wuhan-Hu-1, which is 3 higher than the number of mutations from WA1/proCoV2.

Canadian B.1.279 strain on GISAID

After the lockdown was put in place, there emerged strains which were restricted to a single country, like for example B.1.279 which is found almost exclusively in Canada (at least in my subset of GISAID submissions with a collection date in 2020):

$ grep B.1.279 gisaid2020.tsv|cut -f6,7|sort|uniq -c|sort -n|column -ts$'\t'
      1 Brazil  Parana
      1 Canada  Prince Edward Island
      1 USA     Colorado
      2 Canada  Manitoba
      2 Canada  Newfoundland and Labrador
      2 Canada  Ontario
      3 Canada  Nova Scotia
      3 USA     California
      4 Canada  Saskatchewan
    474 Canada  British Columbia
   1489 Canada  Alberta

There's two samples from Nova Scotia that have collection dates in November and December 2020, and that have a total of 19 mutations from Wuhan-Hu-1. There's a couple of missing links between those samples and their closest ancestor on GISAID, because the closest ancestor has only 14 mutations from Wuhan-Hu-1, but it is found in 103 samples which are all from Alberta. And the closest ancestor of that strain in turn has 12 mutations from Wuhan-Hu-1, and it is found in 323 samples which are all from Alberta or Saskachewan. (So there's again a missing link for a sample with 13 mutations which is not found at GISAID, but the way how you can trace the evolution of these strains one mutation at a time is an indication of how stable the virus is contrary to what Couey claims.) Next there's 4 different sets of mutations which are all ancestral to the two samples from Nova Scotia but which have different mutations in common with it, but all four strains are only found in Alberta. And finally there is one set of 10 mutations which is found in 22 samples but they are all from Alberta. The following code shows all samples whose set of mutations is a subset of the samples from Nova Scotia and that have at least 10 mutations from Wuhan-Hu-1.

In the output below, the first column shows the number of samples with the same combination mutation set, country, and region. The second column shows the number of mutations from Wuhan-Hu-1:

$ awk -F\\t 'NR==FNR{a[$0];next}!$19{n=0;split($12,b,",");for(i in b){if(b[i]in a)n++;else next}print n FS$0}' <(tr , \\n<<<C241T,C1913T,C2416T,G2528A,C3037T,A3405G,C7039T,C11074T,C11494T,C12525T,C14408T,C16806T,G18651T,C19862T,G20014T,A23403G,G25234T,G25563T,A25718G) gisaid2020.tsv|cut -f1,5-8,13|sort -n|awk -F\\t 'NR==FNR{a[$12]++;next}{print$0 FS a[$6]}' gisaid2020.tsv -|cut -f1,4,5,6|awk '{++a[$0]}END{for(i in a)print a[i]"\t"i}'|sort -nk2|awk '$2>=10'|csvtk -t pretty|sed 2d
22    10   Canada   Alberta        C241T,C1913T,C2416T,G2528A,C3037T,C12525T,C14408T,A23403G,G25563T,A25718G
1     11   Canada   Alberta        C241T,C1913T,C2416T,G2528A,C3037T,C11074T,C12525T,C14408T,A23403G,G25563T,A25718G
1     11   Canada   Alberta        C241T,C1913T,C2416T,G2528A,C3037T,C12525T,C16806T,G20014T,A23403G,G25563T,A25718G
2     11   Canada   Alberta        C241T,C1913T,C2416T,G2528A,C3037T,C12525T,C14408T,G20014T,A23403G,G25563T,A25718G
5     11   Canada   Alberta        C241T,C1913T,C2416T,G2528A,C3037T,C12525T,C14408T,C16806T,A23403G,G25563T,A25718G
3     12   Canada   Saskatchewan   C241T,C1913T,C2416T,G2528A,C3037T,C12525T,C14408T,C16806T,G20014T,A23403G,G25563T,A25718G
320   12   Canada   Alberta        C241T,C1913T,C2416T,G2528A,C3037T,C12525T,C14408T,C16806T,G20014T,A23403G,G25563T,A25718G
103   14   Canada   Alberta        C241T,C1913T,C2416T,G2528A,C3037T,C11494T,C12525T,C14408T,C16806T,G20014T,A23403G,G25234T,G25563T,A25718G
2     19   Canada   Nova Scotia    C241T,C1913T,C2416T,G2528A,C3037T,A3405G,C7039T,C11074T,C11494T,C12525T,C14408T,C16806T,G18651T,C19862T,G20014T,A23403G,G25234T,G25563T,A25718G

There is also another branch of B.1.279 which is found mostly in British Columbia and not Alberta. The code below shows that there's sample from the branch which has 30 mutations, but its ancestors are found exclusively in Canada, and the ancestors with 20 or more mutations are only found in British Columbia:

$ awk -F\\t 'NR==FNR{a[$0];next}!$19{n=0;split($12,b,",");for(i in b){if(b[i]in a)n++;else next}print n FS$0}' <(tr , \\n<<<C241T,G695A,C1909T,C1913T,C1997T,C2416T,G2528A,C3037T,A3405G,C6255T,C7039T,A10323G,C11494T,C12525T,C14177T,C14408T,C16806T,G18651T,G20014T,C20133T,T20310C,C21614T,A23403G,G25234T,G25563T,A25718G,A26059G,G27358T,G28907A,C29733T) gisaid2020.tsv|cut -f1,5-8,13|sort -n|awk -F\\t 'NR==FNR{a[$12]++;next}{print$0 FS a[$6]}' gisaid2020.tsv -|cut -f1,4,5,6|awk '{++a[$0]}END{for(i in a)print a[i]"\t"i}'|sort -nk2|awk '$2>7'|csvtk -t pretty|sed 2d
1     9    Canada   British Columbia   C241T,C2416T,G2528A,C3037T,A3405G,A10323G,C14408T,A23403G,G25563T
22    10   Canada   Alberta            C241T,C1913T,C2416T,G2528A,C3037T,C12525T,C14408T,A23403G,G25563T,A25718G
1     11   Canada   Alberta            C241T,C1913T,C2416T,G2528A,C3037T,A10323G,C12525T,C14408T,A23403G,G25563T,A25718G
1     11   Canada   Alberta            C241T,C1913T,C2416T,G2528A,C3037T,C12525T,C16806T,G20014T,A23403G,G25563T,A25718G
2     11   Canada   Alberta            C241T,C1913T,C2416T,G2528A,C3037T,C12525T,C14408T,G20014T,A23403G,G25563T,A25718G
5     11   Canada   Alberta            C241T,C1913T,C2416T,G2528A,C3037T,C12525T,C14408T,C16806T,A23403G,G25563T,A25718G
3     12   Canada   Saskatchewan       C241T,C1913T,C2416T,G2528A,C3037T,C12525T,C14408T,C16806T,G20014T,A23403G,G25563T,A25718G
320   12   Canada   Alberta            C241T,C1913T,C2416T,G2528A,C3037T,C12525T,C14408T,C16806T,G20014T,A23403G,G25563T,A25718G
103   14   Canada   Alberta            C241T,C1913T,C2416T,G2528A,C3037T,C11494T,C12525T,C14408T,C16806T,G20014T,A23403G,G25234T,G25563T,A25718G
1     20   Canada   British Columbia   C241T,C1913T,C2416T,G2528A,C3037T,A3405G,C7039T,A10323G,C11494T,C14408T,C16806T,G18651T,G20014T,C21614T,A23403G,G25234T,G25563T,A25718G,A26059G,C29733T
3     20   Canada   British Columbia   C241T,C1913T,C2416T,G2528A,C3037T,A3405G,C7039T,A10323G,C11494T,C12525T,C14408T,C16806T,G18651T,G20014T,C21614T,A23403G,G25234T,G25563T,A25718G,A26059G
38    21   Canada   British Columbia   C241T,C1913T,C2416T,G2528A,C3037T,A3405G,C7039T,A10323G,C11494T,C12525T,C14408T,C16806T,G18651T,G20014T,C21614T,A23403G,G25234T,G25563T,A25718G,A26059G,C29733T
1     24   Canada   British Columbia   C241T,C1913T,C1997T,C2416T,G2528A,C3037T,A3405G,C6255T,C7039T,A10323G,C11494T,C12525T,C14177T,C14408T,C16806T,G18651T,G20014T,C21614T,A23403G,G25234T,G25563T,A25718G,A26059G,G28907A
28    24   Canada   British Columbia   C241T,C1913T,C1997T,C2416T,G2528A,C3037T,A3405G,C6255T,C7039T,A10323G,C11494T,C12525T,C14408T,C16806T,G18651T,G20014T,C21614T,A23403G,G25234T,G25563T,A25718G,A26059G,G28907A,C29733T
8     25   Canada   British Columbia   C241T,C1913T,C1997T,C2416T,G2528A,C3037T,A3405G,C6255T,C7039T,A10323G,C11494T,C12525T,C14177T,C14408T,C16806T,G18651T,G20014T,C21614T,A23403G,G25234T,G25563T,A25718G,A26059G,G28907A,C29733T
7     26   Canada   British Columbia   C241T,C1909T,C1913T,C1997T,C2416T,G2528A,C3037T,A3405G,C6255T,C7039T,A10323G,C11494T,C12525T,C14177T,C14408T,C16806T,G18651T,G20014T,C21614T,A23403G,G25234T,G25563T,A25718G,A26059G,G28907A,C29733T
1     27   Canada   British Columbia   C241T,G695A,C1909T,C1913T,C1997T,C2416T,G2528A,C3037T,A3405G,C6255T,C7039T,A10323G,C11494T,C12525T,C14177T,C14408T,C16806T,G18651T,G20014T,C21614T,A23403G,G25234T,G25563T,A25718G,A26059G,G28907A,C29733T
1     28   Canada   British Columbia   C241T,G695A,C1909T,C1913T,C1997T,C2416T,G2528A,C3037T,A3405G,C6255T,C7039T,A10323G,C11494T,C12525T,C14177T,C14408T,C16806T,G18651T,G20014T,C21614T,A23403G,G25234T,G25563T,A25718G,A26059G,G27358T,G28907A,C29733T
1     30   Canada   British Columbia   C241T,G695A,C1909T,C1913T,C1997T,C2416T,G2528A,C3037T,A3405G,C6255T,C7039T,A10323G,C11494T,C12525T,C14177T,C14408T,C16806T,G18651T,G20014T,C20133T,T20310C,C21614T,A23403G,G25234T,G25563T,A25718G,A26059G,G27358T,G28907A,C29733T

Excess deaths in southern US states in summer 2020

Rancourt wrote: "This is a remarkable map, which shows that the above-SB deaths in the summer of 2020 were concentrated in the Southern states of Arizona, Texas, Louisiana, Mississippi, Alabama, Florida and South Carolina. These results can be understood in terms of climatic, socio-economic and population health effects, as shown below. The results (Figure 16) are inconsistent with the theoretical concept of a viral respiratory disease pandemic." [https://denisrancourt.ca/entries.php?id=107&name=2021_10_25_nature_of_the_covid_era_public_health_disaster_in_the_usa_from_all_cause_mortality_and_socio_geo_economic_and_climatic_data]

However in the southern states which had spikes in excess mortality during the summer, there were also spikes in the PCR positivity rate during the summer (and often the spikes in PCR positivity rate during the summer preceded the spikes in excess deaths by about a week or two, as is typical) (R code):

Mexico also had one peak in excess mortality in July 2020 and another in August 2021, but both coincided with a peak in PCR positivity rate. And in Guatemala which is the first Central American country south after Mexico, the two biggest spikes in excess mortality were in summer 2020 and summer 2021. Mexico also had big spikes in excess deaths around January 2021 and January 2022, so it has a similar 4-hump pattern in excess deaths as southern US states (R code):

Comparison of different states and territories of Australia

Around January 2022 when there was a spike in all-cause mortality in Australia, Rancourt blamed it on the vaccines, even though the spike coincided with a spike in PCR positivity rate. And all over the world even in countries which did not roll out a new vaccine dose around January-February 2022, there were similar spikes in excess deaths and PCR positivity rate when Omicron appeared.

From the plot below which shows data for 8 different regions of Australia, you can see that the peak in the number of new vaccines given occurred around the same time in January 2022 in each region.

However unlike other regions of Australia, Western Australia had close to 0% PCR positivity rate throughout January 2022, but Western Australia also had low excess mortality in January 2022, and excess deaths and PCR positivity rate only peaked a couple of months later.

In most states and territories of Australia, the PCR positivity rate remained close to zero until January 2022 or late December 2021 when Omicron appeared, and there was no clear increase in excess mortality until Omicron either. However in Victoria where there was a small bump in PCR positivity rate around August 2020, it coincided with a spike in excess mortality. And later in October 2021, there was another small increase in PCR positivity in Victoria which also coincided with a small increase in excess mortality.

In New South Wales the daily number of new vaccines peaked in August 2021, but it coincided with a dip in excess mortality where the moving average of excess mortality remained negative for about 2 months.

Around August 2022, most regions had a large dip in excess mortality which coincided with a large dip in PCR positivity rate.

(I used data from these sources in the plots above: https://www.abs.gov.au/statistics/health/causes-death/provisional-mortality-statistics/latest-release, https://www.covid19data.com.au/vaccines, https://www.covid19data.com.au/testing. R code: https://pastebin.com/raw/PrpGNdq9.)

The plot above shows that the percentage of positive tests exceeds 100% for Tasmania during some days, which might be because a note at the Australian COVID-19 Data website said: "Units of testing for COVID-19 in Australia have been inconsistently reported. At different times and in different jurisdictions units may refer to 'people tested' or 'tests conducted'." [https://www.covid19data.com.au/testing]

In all eight states and territories that were included in the datasets I used, excess mortality had a much higher correlation coefficient with PCR positivity rate than with the daily number of new vaccines (when I used 15-day moving averages for each variable and I ignored days where either compared variable was missing data):

State or territory Correlation between excess
mortality and PCR
positivity rate
Correlation between
excess mortality and
daily new vaccines
New South Wales 0.76 -0.27
Victoria 0.78 -0.03
Queensland 0.70 -0.34
South Australia 0.69 -0.11
Western Australia 0.64 -0.32
Tasmania 0.53 -0.13
Northern Territory 0.47 -0.06
Australian Capital Territory 0.65 -0.38

Australia also had low seroprevalence until 2022: [https://raw.githubusercontent.com/serotracker/sars-cov-2-data/main/serotracker_dataset.csv]

The plot below also shows that in New Zealand the third vaccine dose was rolled out around January to February 2022 like in Australia, but there wasn't a clear increase in excess deaths until March 2022. So did the vaccines take longer to start killing people in New Zealand than in Australia?

In January and February 2022 New Zealand also had low wastewater prevalence:

Spike in deaths in Ireland in December 2022

In Ireland there was a spike in all-cause mortality around December 2022 which Rancourt blamed on the boosters: [https://twitter.com/denisrancourt/status/1748194468405113125]

However my plot below shows that the spike in deaths in December 2022 coincided with a spike in PCR positivity rate, but there was no sharp increase in the number of vaccine doses given in December 2022: [https://data.gov.ie/dataset/covid-19-laboratory-testing-time-series1]

USMortality

Excess mortality in Luxembourg

USMortality says that there was no novel virus because there was no clear increase in excess mortality in Luxembourg: [https://x.com/USMortality/status/1669746702058946560]

However the data for Luxembourg has so much noise that it helps to compare to it larger neighboring countries or to look at a moving average of weekly data instead of raw weekly data. And if you compare a 15-day moving averages of excess mortality in Luxembourg, Netherlands, and Belgium, you can see that there were at least five spikes in excess mortality which occurred around the same time in all three Benelux countries, which were around March 2020, August 2020, November 2020, November 2021, and December 2022:

USMortality also posted a plot which showed that Luxembourg appeared had higher yearly excess mortality in 2003 than in 2020. [https://x.com/USMortality/status/1705418325382336565] But it might partially be because according to the World Mortality Database, Luxembourg had 368 deaths in August 2003 but only 290 deaths in August 2004, and a report published by the EU said: "In total, more than 80,000 additional deaths were recorded in 2003 in the twelve countries concerned by excess mortality compared to the 1998-2002 period. Whereas 70,000 of these additional deaths occurred during the summer, still over 7,000 occurred afterwards. Nearly 45,000 additional deaths were recorded in August alone, as well as more than 11,000 in June, more than 10,000 in July and nearly 5,000 in September. The mortality crisis of early August extended over the two weeks between August 3rd and 16th. 15,000 additional deaths were recorded in the first week and nearly 24,000 in the second. The excess mortality in this second week reached the exceptional value of 96.5% in France and over 40% in Portugal, Italy, Spain and Luxembourg." [https://www.mortality.watch/explorer/?c=LUX&t=deaths&ct=monthly&df=2000+Jan&dt=2005+Oct&v=2, https://ec.europa.eu/health/ph_projects/2005/action1/docs/action1_2005_a2_15_en.pdf]

Luxembourg clearly has excess deaths associated with COVID that are visible on a weekly or monthly scale, because the spikes in excess deaths coincide with spikes in COVID deaths, number of patients hospitalized for COVID, and PCR positivity rate:

Claim that Sweden had almost no excess mortality in 2020

USMortality has posted a bunch of plots like this which show that Sweden had almost no excess mortality from October 2019 to September 2020: [https://x.com/USMortality/status/1697407334962934234]

However Sweden had negative excess ASMR in the last quarter of 2019 and the first quarter of 2020, so it makes it look like there were not that many COVID deaths in 2020 if you use Q4 to Q3 years. And Sweden had high excess mortality in the fourth quarter of 2020, so if you include the last quarter of 2020 under 2021, then it makes it look like more people died of vaccines in 2021 and less people died of COVID in 2020: [https://www.mortality.watch/explorer/?c=SWE&t=asmr_excess&ct=monthly&df=2018+Jan&v=2]

Sweden may have also had negative excess mortality in summer 2020 depending on which method you use to calculate excess mortality:

In summer 2020 Sweden also had a low PCR positivity rate and a low number of COVID deaths and not just all-cause mortality. And the spikes in excess deaths in Sweden have coincided with spikes in PCR positivity rate and wastewater prevalence:

Excess deaths in Taiwan

USMortality was wondering why Taiwan still had high excess mortality in 2023: [https://x.com/USMortality/status/1702387726220238990]

However Taiwan was basically free of COVID until April or May 2022, so they essentially only entered their second year of COVID in the second quarter of 2023. The first big spike in excess deaths coincided with the first big increase in PCR positivity rate but it came about a year after the jabs were rolled out:

Here you can see that apart from a minor wave of COVID deaths around May-August 2021 and two deaths in March 2020, Taiwan had zero reported COVID deaths until April 2022: [https://www.worldometers.info/coronavirus/country/taiwan/#graph-deaths-daily]

Wikipedia says that the outbreak in summer 2021 may have started among the crew members of an airline company: "However, an outbreak among Taiwanese crew members of the state-owned China Airlines in late April 2021 led to a sharp surge in cases, mainly in the Greater Taipei area, from mid May. In response, the closure of all schools in the area from kindergarten to high schools was mandated for two weeks, and national borders were closed for at least a month to those without a residence permit, among other measures.[26]" [https://en.wikipedia.org/wiki/COVID-19_pandemic_in_Taiwan] When I searched for GISAID submissions from Taiwan from May-August 2021, 154 out of 176 submissions were classified under B.1.1.7, and the region of almost all submissions was either Hsinchu or not listed, so it indicates that the outbreak was localized and mostly consisted of a single strain. [https://cov-spectrum.org/explore/Taiwan/AllSamples/from%3D2021-04-06%26to%3D2021-07-16/variants]

Claim that the neighboring countries of Italy were completely spared by COVID in spring 2020

Italy shares a land border with seven countries if San Marino and the Holy See are included. USMortality posted the tweet below where he picked Croatia which does not share a land border with Italy, Austria which did actually have an increase in excess mortality in spring 2020, and Slovenia which is the only one of the seven countries which didn't have a clear spike in excess mortality in spring 2020 (apart from possibly the Holy See, which according to WHO's data had zero COVID deaths even though 12 out of a total of 29 COVID cases were in spring 2020). And then USMortality used the statistics as evidence that the excess deaths were not caused by a virus: [https://x.com/USMortality/status/1703498835794771975]

However USMortality omitted France, Switzerland, Monaco, and San Marino, which all had a clear increase in excess mortality in spring 2020:

Excess deaths in Germany before the pandemic

In the tweet below, USMortality's point was that because Germany had fluctuation in excess deaths before the COVID pandemic, it means that the fluctuation in deaths during the pandemic was not necessarily caused by a virus either:

According to the data for Germany at Mortality Watch which starts in 2012, from 2012 until December 2020, the highest weekly excess mortality was on the week ending March 11th 2018 (regardless of whether you look at excess deaths, excess CMR, or excess ASMR). [https://www.mortality.watch/explorer/?c=DEU&t=deaths_excess&ct=weekly&df=2011+W35&p=1&v=2]

Earlier I was wondering why EUROMOMO showed that many Western European countries had high excess mortality in early 2018. The excess deaths were particularly high in Germany, so I tried googling for "excess mortality spring 2018" translated to German, and I found an article which said in German that "The exceptionally strong flu wave of 2017/18 is estimated to have cost the lives of around 25,100 people in Germany. This is the highest number of deaths in the past 30 years, as the President of the Robert Koch Institute (RKI), Lothar Wieler, explained today with a view to his own current evaluations." [https://www.aerzteblatt.de/nachrichten/106375/Grippewelle-war-toedlichste-in-30-Jahren]

Then when I looked at WHO's influenza testing data for Germany in 2018, I found that the percentage of positive PCR tests and the number of positive PCR tests both peaked on the week ending March 4th, which was a week before the peak in weekly excess deaths in Germany (which matches how the PCR positivity rate for COVID has often also peaked one or two weeks before COVID deaths): [https://app.powerbi.com/view?r=eyJrIjoiZTkyODcyOTEtZjA5YS00ZmI0LWFkZGUtODIxNGI5OTE3YjM0IiwidCI6ImY2MTBjMGI3LWJkMjQtNGIzOS04MTBiLTNkYzI4MGFmYjU5MCIsImMiOjh9]

Excess deaths in South Korea in 2022

The standard modus operandi of USMortality is that he posts a plot which only displays excess mortality and no other variables, and then he blames the vaccines if there was higher excess mortality after the vaccine rollout than before it (regardless of whether the spikes in excess mortality coincided with spikes in COVID deaths or PCR positivity, or if the excess deaths happened at a time when a small number of new vaccines were given, or if the excess mortality didn't increase until long after the vaccine rollout). He employed the same trick in this tweet about how South Korea had low excess mortality until 2022:

However South Korea is another country like Australia where the first big spike in COVID deaths happened long after the vaccines were rolled out, and actually it coincided with a low point in the daily number of new vaccines given, so it's difficult to blame it on the vaccines. But like in the case of Taiwan, Hong Kong, and Australia, the first big spike in excess deaths in South Korea coincided with the first big increase in PCR positivity rate:

Plot for excess mortality in Australia which used a 52-week moving average

USMortality posted this plot which made it seem like Australia had a steady increase in excess mortality which started in the first half of 2021 soon after the vaccines were rolled out to the general population: [https://x.com/USMortality/status/1716467659657953528]

However his plot used a 52-week moving average (where the window for the moving average extended 51 weeks backwards, and not 26 weeks backwards and 25 weeks forwards or vice versa). His plot gives the impression that there was a stable increase in excess mortality starting from mid-2021, but it could partially be because there was negative excess mortality in 2020, so in 2021 as the window for the moving average began to move past the period with negative excess mortality, the value of the moving average began to increase.

From the plot below you can see that there was actually negative excess mortality in mid-2021 when there was a peak in the number of new vaccines given. And there wasn't a clear increase in excess mortality until January 2022 when Australia got Omicron and when there was also the first big increase in PCR positivity rate:

Mixing up statistical significance and prediction intervals in respiratory illness data for Germany

USMortality posted the plot below where he took data for the weekly incidence of acute respiratory illness in Germany, then he predicted the future incidence based on data from 2011 to early 2020, and then he plotted the actual incidence in 2020-2023 overlaid with the 99.9% prediction interval for his modeled incidence, and he claimed that there was no statistically significant increase in the ARI incidence because it mostly remained below the upper end of the 99.9% prediction interval (except the incidence did actually reach above the prediction interval in December 2022): [https://x.com/USMortality/status/1720237905577447549]

However I don't think statistical significance can be calculated from the prediction interval, and USMortality didn't mention anything about p-values in his Twitter thread.

USMortality normally uses a 95% prediction interval in his plots, but in the plot above he may have chosen a 99.9% prediction interval if there were too many observations that reached above the PI when he used a 95% or 99% PI. So he might have just as well chosen a 99.999% PI and then said that there was no statistically significant increase in the ARI incidence if the incidence remained below the PI.

When I asked Bing AI if statistical significance can be calculated from prediction intervals, it replied:

Prediction intervals are a type of confidence interval used in regression analysis to predict the value of a new observation based on your existing model. They are a range of values that predicts the value of a new observation, based on your existing model. Prediction intervals are often confused with confidence intervals, but they are not quite the same thing. Confidence intervals are a range of values associated with a population parameter, while prediction intervals are where you expect a future value to fall.

Statistical significance, on the other hand, is a measure of whether an observed effect or relationship is real or just due to chance. It is usually measured using a p-value, which is the probability of observing a test statistic as extreme as the one computed from the sample data, assuming the null hypothesis is true.

Therefore, prediction intervals and statistical significance are two different concepts and cannot be measured using the same method.

In December 2022 when USMortality's plot shows that the line for ARI incidence reached above the 99.9% prediction interval, Germany also had the highest weekly excess mortality at OWID since the beginning of 2020:

The plot above shows that there wasn't a very high number of COVID deaths in December 2022 so maybe the spike in deaths wasn't caused by COVID, but the ratio of influenza-like illness to acute respiratory illness was higher than normally, so the spike in ARI cases may have been caused by influenza viruses. In December 2022, Germany also had a spike in the percentage of positive influenza tests, and almost all positive specimens were the H3 subtype of influenza A: [https://app.powerbi.com/view?r=eyJrIjoiZTkyODcyOTEtZjA5YS00ZmI0LWFkZGUtODIxNGI5OTE3YjM0IiwidCI6ImY2MTBjMGI3LWJkMjQtNGIzOS04MTBiLTNkYzI4MGFmYjU5MCIsImMiOjh9]

USMortality's tweet said that "there was never a stat. sign. increase in clinical illness", so I asked him how he quantified if there was a statistically significant increase or not. He answered "increase above any previous high". But after I pointed out that the peak in ARI incidence in December 2022 was higher than any previous peak since the data started in 2011, he started to say again that the statistical significance was shown by the prediction interval and not by whether there had been an increase above any previous high. But the concept of statistical significance already has an established definition, so he can't just make up his own definitions of what statistical significance means, and he cannot keep switching his definition depending on which definition suits his needs.

I also asked this question from Google Gemini: "Can statistical significance be determined from whether the observations reach above the 95% prediction interval or not?" It answered:

No, determining statistical significance solely based on whether observations fall within a 95% prediction interval is not correct. Here's why:

  1. Different purposes: Statistical significance tests the null hypothesis, which is the statement that there is no effect, while a prediction interval estimates the range within which future individual observations are likely to fall. These serve different purposes.

  2. Coverage probability: A 95% prediction interval means there's a 95% chance a single future observation will fall within the interval, and a 5% chance it won't. Observing an observation outside the interval doesn't necessarily mean statistical significance from randomness.

  3. One-sided vs. two-sided: Statistical significance tests are typically two-sided, meaning they assess deviations from the expected outcome in either direction (higher or lower). Prediction intervals, however, are generally one-sided, focusing on the range of possible future values.

Therefore, while observing an observation outside a 95% prediction interval might be unexpected, it doesn't directly translate to statistically significant evidence against the null hypothesis. Determining statistical significance requires appropriate statistical tests, not just prediction intervals.

Twitter thread about excess mortality in 20 most vaccinated high-HDI countries

USMortality selected countries and jurisdictions with HDI above 0.8, then he selected the 20 countries with the highest percentage of vaccinated people at OWID, and he found that the median excess mortality in the countries was 4.5% in 2020, 9.9% in 2021, and 11.2% in 2022, which he said meant that "median all-cause excess mortality in the 20 most vaccinated highly developed countries increased by +149% after vaccination rollout". [https://x.com/USMortality/status/1721410802857730423] He didn't explain how he derived the figure of 149%, but it might come from the difference between the excess mortality in 2022 and 2020 ((11.2-4.5)/4.5). And I guess a 149% increase sounds more impressive than an increase of 6.7 percentage points.

One problem with USMortality's analysis is that even in countries like Italy and Spain that had a high number of COVID deaths in spring 2020, the average excess mortality for 2020 still includes January and February 2020. And for example Costa Rica had almost no COVID deaths until July 2020, so about half of Costa Rica's average excess mortality in 2020 consists of the period before they got COVID.

USMortality's analysis also included several countries and jurisdictions which were barely hit by COVID until 2022 or 2021, like Australia, New Zealand, Hong Kong, South Korea, Singapore, and Malaysia. According to OWID, 11 out of 20 countries and jurisdictions in his analysis didn't reach 100 COVID deaths per million until 2021 or 2022:

> t=read.csv("https://covid.ourworldindata.org/data/owid-covid-data.csv")
> t2=t[t$iso_code%in%strsplit("ARE,QAT,PRT,HKG,CHL,SGP,ARG,CAN,CRI,URY,ESP,MUS,KOR,ITA,AUS,JPN,BHR,NZL,MYS,IRL",",")[[1]],]
> options(width=90)
> split(t2,t2$location)|>sapply(\(x)x$date[which(x$total_deaths_per_million>=100)[1]])|>sort()
               Italy                Spain              Ireland             Portugal
        "2020-03-24"         "2020-03-29"         "2020-04-14"         "2020-05-03"
              Canada                Chile            Argentina              Bahrain
        "2020-05-07"         "2020-06-08"         "2020-07-06"         "2020-08-04"
          Costa Rica              Uruguay United Arab Emirates                Qatar
        "2020-09-10"         "2021-01-23"         "2021-02-10"         "2021-03-18"
               Japan             Malaysia            Mauritius            Singapore
        "2021-05-24"         "2021-06-07"         "2021-10-16"         "2021-11-13"
         South Korea            Australia          New Zealand
        "2021-12-25"         "2022-01-08"         "2022-04-14"

Hong Kong is missing from the code block above because OWID's data for COVID deaths comes from WHO which includes Hong Kong under China. But in JHU's dataset where Hong Kong is not included under China, Hong Kong had only 213 COVID deaths at the beginning of February 2022 until the number of deaths exploded to about 8,000 by the end of March 2022. In Hong Kong the excess mortality, PCR positivity rate, and COVID deaths all remained flat from 2020 until February 2022. According to OWID, Hong Kong had about 170% excess mortality in March 2022 even though about 85% of the population of Hong Kong was already vaccinated in March 2022. However according to the table below, about 70% of COVID deaths in Hong Kong in 2022 were in unvaccinated people (and I don't think the large number of deaths in unvaccinated people can be explained by misclassification of people as unvaccinated for 2 or 3 weeks after their first jab, since not that many people received their first vaccine dose in 2022): [https://www.chp.gov.hk/files/pdf/local_situation_covid19_en.pdf]

Another problem with USMortality's analysis is that he used ASMR data for 9 countries and CMR data for 11 countries, and he used the average mortality in 2017-2019 as the baseline instead of the linear trend. However most developed countries have an increasing trend in CMR, so if you use the average CMR in 2017-2019 as the baseline instead of the linear trend in 2017-2019, then it's going to exaggerate the excess CMR in 2021-2022 relative to 2020. But on the other hand most developed countries have a decreasing trend in ASMR, so if you use the average ASMR in 2017-2019 as the baseline instead of linear trend in 2017-2019, then it's going to downplay the excess ASMR in 2021-2022 relative to 2020.

For example from the plots for New Zealand below, you can see that the excess ASMR in 2021 is negative if you use the average ASMR in 2017-2019 as the baseline, but it's positive if you use a baseline based on linear regression of data from 2017-2019 (even though in this case the slope of the baseline looks a bit too steep, so it would probably be better to extend the fitting period to 2015-2019): [https://next.mortality.watch/explorer/?c=NZL&ct=yearly&df=2013&dt=2022&bf=2017&bt=2019&bm=linear_regression&pi=0&v=2]

And also when I used a linear regression of data from 2017-2019 as the baseline, Italy got 18.1% ASMR in 2020 and 21.3% in 2022, so there was an increase of about 18%. But when I used the 2017-2019 average as the baseline, Italy got 11.3% excess ASMR in 2020 and 7.5% in 2022, so there was a decrease of about 34%. [https://next.mortality.watch/explorer/?c=PRT&c=ESP&c=ITA&ct=yearly&df=2013&dt=2022&bf=2017&bt=2019&bm=linear_regression&pi=0&p=1&v=2]

Excess mortality in Philippines

USMortality posted this plot which showed that Philippines had much higher excess mortality in 2021 than 2020:

However many East Asian and Southeast Asian countries had a low number of COVID deaths until 2021 or 2022, and Philippines is one of them. And in Philippines the curve for excess mortality also follows the curve for PCR positivity rate as usual:

Table for excess mortality by age group in Germany

USMortality posted these tweets: [https://x.com/USMortality/status/1740283802168250674]

In the table most age groups have negative excess mortality on most years before 2020. But it's because the plot used the average mortality rate in the five previous years as the baseline, and Germany has a decreasing trend in the CMR of most individual age groups even though the CMR of the total population has an increasing trend: [https://next.mortality.watch/explorer/?c=DEU&t=cmr&ct=yearly&cs=matrix&ag=0-9&ag=10-19&ag=20-29&ag=30-39&ag=40-49&ag=50-59&ag=60-69&ag=70-79&ag=80%2B&bm=mean&v=2]

And also if you look at the quarterly excess ASMR percent for Germany at Mortality Watch, it was about -7% in the first quarter of 2020, about 0% in the next two quarters, and about 12% in the fourth quarter. So the period of high excess mortality had already started in late 2020 before the vaccinations. But the total excess mortality in 2020 also includes the months before COVID, when there was negative excess mortality in many Western European countries including Germany.

Germany also had low excess mortality in summer 2020 when PCR positivity rate was also low. But there was a spike in excess mortality in late 2020 which coincided with a spike in PCR positivity:

Claim that wastewater surveillance is useless because of a thread at the Virological forum

USMortality posted this tweet: [https://x.com/USMortality/status/1740822247823290674]

However he should've read the thread he quoted beyond the abstract, because it didn't say that wastewater surveillance cannot be used to measure the amount of viral RNA present in a sample, but that wastewater samples cannot be used to do whole-genome assembly of individual strains because reads from different people are mixed together: [https://virological.org/t/wastewater-samples-cannot-be-used-for-genome-assembly/921]

Regarding the recent paper by Fielding-Miller et al. (1), the authors seem to confuse:

1.) the general concept of SARS-CoV-2 (SC2) genome assembly with

2.) what is possible with wastewater amplicon sequencing and

3.) SC2 whole genome sequencing (WGS) from clinical isolate/sample amplicon sequencing.

This is not the first time I have seen researchers confuse these points, so it bears drawing explicit lines to define the scope of wastewater sequencing surveillance analyses with how it is implemented. Number 3 can be used to assemble full-length SC2 genome assemblies. Number 2 can at best be used to estimate the proportion of sequence heterogeneity in pooled environmental specimens. Assemblies would require confirmation of 2 with 3.

One CANNOT assemble genomes from a typical wastewater sample except under highly controlled conditions. A major reason is because genetic material from multiple strains and persons are mixed or pooled together. Reads generated are also much shorter than the lengths of SC2 genomes. This leads to loss of physical linkage (phasing) information in diluted samples and/or samples with low percent reference coverage. This is solved by using isolates with higher sequencing depth (often with lower ct), percent reference coverage, and samples from individuals, not pools. Samples can degrade prior to collection and/or during transit, leading to noise or shorter fragments, preventing long-read sequencing from being a de facto solution to phasing. Wastewater samples in absence of viral isolation, subculturing, and isolate sequencing with measurable SC2 signal (ct lower than 30) would at best look like a box of mixed puzzle pieces, but pieces from different puzzles.

Experiment which shows transmission of a lab-created virus

USMortality posted this tweet: [https://twitter.com/USMortality/status/1747890867191636387]

I told him to read this paper by Ron Fouchier's team at the Erasmus Medical Center (which is where Couey used to work and which is one of NATO's main bioweapon development centers according to George Webb): [https://sci-hub.ee/https://www.science.org/doi/abs/10.1126/science.1213362]

Decrease in the average length of SARS2 sequences uploaded to GISAID

USMortality posted this tweet: [https://twitter.com/USMortality/status/1679756994708901888]

Fabian Spieker shared a nearly complete set of GISAID sequences with a collection date in 2020. I ran NextClade CLI on the sequences which aligned each sequence against Wuhan-Hu-1, and I counted which were the most common common starting and ending positions of the sequences in Wuhan-Hu-1 coordinates:

$ curl -Ls 'https://drive.google.com/uc?export=download&id=17LdyND_q7BTUMvc23nt2-TPlObfV7wXq'|xz -dc>early.clade
$ cut -f22,23 early.clade|LC_ALL=C sort|uniq -c|sort -rn|head|column -t
240843  55   29836
19067   1    29903
18949   39   29903
17731   55   29768
12690   31   29866
6956    343  29836
6847    55   29835
6464    39   29851
5636    40   29903
5472    55   29903

So the output above shows that by far the most common combination was 55 to 29,836. When I googled for the numbers, I found a paper which said: [https://bmcgenomics.biomedcentral.com/articles/10.1186/s12864-020-07283-6]

Amplicon libraries (ARTIC v3, Tailed v1, Tailed v2) were diluted to 8 pM in Illumina's HT1 buffer, spiked with 5% PhiX, and sequenced using a MiSeq 600 cycle v3 kit (Illumina, San Diego, CA).

[...]

Amplicon read depths were determined by counting the number of aligned reads covering the base at the center of each amplicon region. The iVar software package was used to trim primer sequences from the aligned reads, and iVar and Samtools mpileup were used to call variants and generate consensus sequences [3]. Variants located outside of the region targeted by the amplicon panel were filtered out (reference genome positions 1-54 and 29,836-29,903), and consensus sequences bases corresponding to those regions were trimmed.

In all three versions of the ARCTIC protocol, the first forward primer matches positions 30 to 54 and the last reverse primer matches positions 29,836 to 29,866: [https://github.com/artic-network/artic-ncov2019/blob/master/primer_schemes/nCoV-2019/V3/nCoV-2019.bed]

$ curl https://github.com/artic-network/artic-ncov2019/raw/master/primer_schemes/nCoV-2019/V3/nCoV-2019.bed|(gsed -u 4q;echo ...;tail -n4)
MN908947.3  30  54  nCoV-2019_1_LEFT    nCoV-2019_1 +
MN908947.3  385 410 nCoV-2019_1_RIGHT   nCoV-2019_1 -
MN908947.3  320 342 nCoV-2019_2_LEFT    nCoV-2019_2 +
MN908947.3  704 726 nCoV-2019_2_RIGHT   nCoV-2019_2 -
...
MN908947.3  29288   29316   nCoV-2019_97_LEFT   nCoV-2019_1 +
MN908947.3  29665   29693   nCoV-2019_97_RIGHT  nCoV-2019_1 -
MN908947.3  29486   29510   nCoV-2019_98_LEFT   nCoV-2019_2 +
MN908947.3  29836   29866   nCoV-2019_98_RIGHT  nCoV-2019_2 -

However in the newer MIDNIGHT protocol which was launched by Oxford Nanopore Technologies in September 2021, the first forward primer matches positions 30 to 54 and the last reverse primer matches positions 29,790 to 29,814. [https://www.researchgate.net/publication/363454268_SARS-CoV2_genome_sequencing_protocol_1200bp_amplicon_midnight_primer_set_using_Nanopore_Rapid_kit_v5] So the range between the primers is 46 bases shorter than in the ARCTIC protocol ((29835-55+1)-(29789-55+1)). And therefore the gradual switch from ARCTIC to MIDNIGHT might partially explain the decrease in average sequence length at GISAID which started in late 2021.

Fabian Spieker scraped GISAID for FASTA files of about 4 million submissions from the United States: https://vigilance.pervaers.com/i/136194099/downloadable-datasets. I tried aligning the sequences in the FASTA files against Wuhan-Hu-1:

for x in l/e/ga/GISAID/_USA/*.fasta;do paste <(cut -f3 ${x%sequences.fasta}metadata.tsv|sed 1d) <(seqkit seq -s $x)|seqkit tab2fx;done>l/e/ga/GISAID/usa.fa
minimap2 sars2.fa l/e/ga/GISAID/usa.fa -a --sam-hit-only|grep -v ^@|cut -f-6 >usa.sam
ruby -ane's=$F[3].to_i;e=s+$F[5].scan(/\d+(?=[DM])/).map(&:to_i).sum-1;puts [$F[0],s,e]*" "' usa.sam|awk 'NR==FNR{a[$1]=$2;next}{$1=a[$1]}1' <(cut -f3,5 l/e/ga/GISAID/_USA/*.metadata.tsv|cut -d- -f1) ->years

In 2020 by far the most common aligned range was bases 55 to 29,836, which matches the primers in the first three versions of the ARCTIC protocol:

$ grep ^2020 years|LC_ALL=C sort|uniq -c|sort -rn|tail|column -t
36036  2020  55  29836
6811   2020  39  29903
4982   2020  1   29903
3492   2020  31  29866
3464   2020  55  29768
2682   2020  56  29836
2572   2020  40  29903
2565   2020  39  29836
2557   2020  47  29799
2182   2020  39  29851

However in 2022 the most common aligned range became 51 to 29,827:

$ grep ^2022 years|LC_ALL=C sort|uniq -c|sort -rn|head|column -t
246848  2022  51  29827
49163   2022  1   29903
38585   2022  55  29836
37024   2022  47  29903
33027   2022  3   29903
28395   2022  43  29842
28201   2022  55  20676
26318   2022  40  29819
24819   2022  40  29818
22474   2022  50  29827

I found that in the 4th version of the ARCTIC protocol the first forward primer matched positions 25-50 and the last reverse primer matched positions 29,827-29,854. [https://github.com/artic-network/artic-ncov2019/blob/master/primer_schemes/nCoV-2019/V4/SARS-CoV-2.primer.bed]

US cities with no excess mortality in 2020

USMortality posted this tweet: [https://twitter.com/USMortality/status/1755486878579695947]

However a lot of the time when USMortality says that there is "no excess mortality", he means that there is no clear increase in excess mortality on a yearly level, but he ignores waves of excess deaths that are visible on a quarterly or monthly level. When I looked at all-cause deaths in US counties with a population of 100,000 or above, I found almost no counties that didn't have months with clearly elevated excess mortality in 2020:

Deaths in European countries in the fourth quarter of 2020

USMortality posted this tweet: [https://twitter.com/USMortality/status/1757301226092503271]

However the first COVID vaccine outside of a trial was given on December 8th 2020 UTC in the UK. [https://www.bbc.com/news/uk-55227325.amp]

OWID is missing vaccine doses given in UK in December 2020, but based on the date of the first vaccine dose listed at OWID, United States is the only country in his table where the first dose was given before the second half of December 2020:

country=strsplit("Bulgaria,Croatia,Poland,Lithuania,United States,Estonia,Slovakia,Greece,Latvia,Czechia,Hungary,Italy,Netherlands,United Kingdom,Spain,Slovenia,Portugal,Scotland,France,Belgium,Finland,South Korea,Austria,Germany,Norway,Switzerland,Israel,Sweden,Denmark,Iceland,New Zealand,Luxembourg",",")[[1]]

download.file("https://covid.ourworldindata.org/data/owid-covid-data.csv","owid-covid-data.csv")
t=as.data.frame(data.table::fread("owid-covid-data.csv"))

r=sapply(split(t,t$location),\(x)x$date[which(x$people_vaccinated_per_hundred>0)[1]])
options(width=90)
as.Date(r,"1970-1-1")[country]
      Bulgaria        Croatia         Poland      Lithuania  United States        Estonia
  "2020-12-29"   "2020-12-30"   "2020-12-28"   "2020-12-27"   "2020-12-13"   "2020-12-27"
      Slovakia         Greece         Latvia        Czechia        Hungary          Italy
  "2021-01-03"   "2020-12-29"   "2020-12-28"   "2020-12-27"   "2021-01-18"   "2020-12-27"
   Netherlands United Kingdom          Spain       Slovenia       Portugal       Scotland
  "2021-01-08"   "2021-01-10"   "2021-01-04"   "2020-12-27"   "2021-01-01"   "2021-01-10"
        France        Belgium        Finland    South Korea        Austria        Germany
  "2021-01-01"   "2020-12-30"   "2021-01-17"   "2021-02-26"   "2021-01-08"   "2020-12-27"
        Norway    Switzerland         Israel         Sweden        Denmark        Iceland
  "2020-12-28"   "2020-12-24"   "2020-12-20"   "2021-01-03"   "2021-01-01"   "2020-12-30"
   New Zealand     Luxembourg
  "2021-02-22"   "2020-12-28"

In many European countries like Belgium, Bulgary, Chechia, Italy, and Poland, the excess deaths in 2020 Q4 already peaked in November 2020, so it's difficult to blame it on the vaccines:

The wave of excess deaths in winter 2020-2021 also coincided with a spike in the percentage of positive PCR tests:

Claim that ages 65-74 had no excess mortality in Germany in 2020

USMortality posted this tweet which appeared to indicate that ages 65-74 had negative excess CMR in Germany in 2020: [https://twitter.com/USMortality/status/1771960735179895107]

However if you read the small print, it says that the baseline was the 2017-2019 average. But developed countries usually have a decreasing rate in mortality rate within age groups, which means that the average baseline underestimates excess mortality if you look at CMR within age groups. When I used the 5-year linear regression baseline that is used by Mortality Watch by default, I got about 3% excess CMR for ages 65-74 in 2020:

Germany also had negative excess mortality in the first quarter of 2020 before COVID. And there was high excess mortality in the 4th quarter of 2020 before vaccines were rolled out, because the first vaccine outside trials was only given on December 26th:

Excess ASMR in Sweden using Q3 to Q2 years

USMortality posted this tweet: [https://twitter.com/USMortality/status/1772908341528006992]

However his July 2019 to June 2020 year only includes one quarter during COVID, and the 3 quarters before it all had negative seasonality-adjusted excess mortality (at least with the baseline I used here, where I excluded 2019 because it had exceptionally low mortality):

OWID uses a 2015-2019 linear regression baseline for all countries, but it's inaccurate in the case of Sweden because 2019 had such low mortality. However the ETS baseline that USMortality used in the plot above doesn't give too much weight to 2019, so it actually produces negative total excess ASMR in the vaccine era in 2021-2023:

Mortality Watch calculates ASMR for some countries like Sweden so that it uses the five broad age groups at STMF (0-14, 15-64, 65-74, 75-84, and 85+). I thought it may have explained why Sweden got negative total excess ASMR in 2021-2023, but here I got positive excess ASMR in 2021-2023 even when I used the STMF age groups, so it's probably because I used a polynomial baseline instead of an ETS baseline (but the ETS baseline might actually be more accurate):

library(ggplot2)

cutl=\(x,y)cut(x,c(y,Inf),y,T,F)

t=read.csv("http://sars2.net/f/swedenpopdead.csv")|>subset(year>=1990)

std=t$pop[t$year==2020]
y=tapply(t$dead/t$pop*std[t$age+1]/sum(std)*1e5,t$year,sum)
xy=data.frame(x=unique(t$year),y,z="ASMR by single year of age")

a=aggregate(t[,3:4],list(year=t$year,age=cutl(t$age,seq(0,100,5))),sum)
std=a$pop[a$year==2020]
y=tapply(a$dead/a$pop*std[a$age]/sum(std)*1e5,a$year,sum)
xy2=data.frame(x=unique(a$year),y,z="ASMR by five-year age groups")

a=aggregate(t[,3:4],list(year=t$year,age=cutl(t$age,c(0,15,65,75,85))),sum)
std=a$pop[a$year==2020]
y=tapply(a$dead/a$pop*std[a$age]/sum(std)*1e5,a$year,sum)
xy3=data.frame(x=unique(a$year),y,z="ASMR by five broad STMF age groups")

xy=rbind(xy,xy2,xy3)
xy$z=factor(xy$z,unique(xy$z))

xy$trend=unlist(lapply(split(xy,xy$z),\(x)predict(lm(y~poly(x,2),subset(x,x<2020)),x)))

cand=c(sapply(c(1,2,5),\(x)x*10^c(-10:10)))
ystep=cand[which.min(abs(cand-(max(xy$y)-min(xy$y))/4))]
ystart=ystep*floor(min(xy$y)/ystep)
yend=ystep*ceiling(max(xy$y)/ystep)
ybreak=seq(ystart,yend,ystep)
xstart=min(xy$x);xend=max(xy$x)

color=c(hcl(225,110,60),hcl(270,110,60),hcl(320,110,60))

ggplot(xy,aes(x,y,color=z))+
geom_hline(yintercept=c(ystart,0,yend),color="black",linewidth=.3,lineend="square")+
geom_vline(xintercept=c(xstart,xend),color="black",linewidth=.3,lineend="square")+
geom_line(aes(color=z),linewidth=.3)+
geom_line(aes(y=trend,color=z),linetype=2,linewidth=.3)+
labs(title="Age-standardized mortality rate per 100,000 in Sweden",subtitle="The dashed line is a 2000-2019 second-degree polynomial trend, and the standard population is the 2020 Swedish population. Source: statistikdatabasen.scb.se/pxweb/en/ssd/START__BE."|>stringr::str_wrap(83),x=NULL,y=NULL)+
coord_cartesian(clip="off",expand=F)+
scale_x_continuous(limits=c(xstart,xend),breaks=seq(1900,2100,5))+
scale_y_continuous(limits=c(ystart,yend),breaks=ybreak)+
scale_color_manual(values=color)+
guides(colour=guide_legend(override.aes=list(linewidth=.4)))+
theme(axis.text=element_text(size=7,color="black"),
  axis.ticks=element_line(linewidth=.3,color="black"),
  axis.ticks.length=unit(.2,"lines"),
  axis.title=element_text(size=8),
  legend.background=element_blank(),
  legend.box.just="left",
  legend.key=element_rect(fill="white"),
  legend.spacing.x=unit(.15,"lines"),
  legend.key.size=unit(.75,"lines"),
  legend.position=c(1,1),
  legend.justification=c(1,1),
  legend.box.background=element_rect(fill=alpha("white",1),color="black",linewidth=.3),
  legend.margin=margin(-.15,.35,.25,.35,"lines"),
  legend.text=element_text(size=7,vjust=.5),
  legend.title=element_blank(),
  panel.background=element_rect(fill="white"),
  panel.grid.major=element_line(linewidth=.3,color="gray90"),
  plot.background=element_rect(fill="white"),
  plot.margin=margin(.4,.6,.4,.5,"lines"),
  plot.subtitle=element_text(size=7.2),
  plot.title=element_text(size=8.5))
ggsave("1.png",width=4,height=3.5,dpi=450)

Someone posted this reply to USMortality's tweet:

However that plot shows the raw number of deaths with a 2015-2019 average baseline, which may be inaccurate because Sweden had an unusually low number of deaths in 2019, and with ASMR you can even get negative total excess mortality in 2021-2023 depending on the baseline.

Sweden had a decreasing trend in deaths per year in the 00s and a roughly flat trend in the 2010s, but I believe the trend would've started to increase in the 2020s even without COVID, because according to population estimates from statistikdatabasen.scb.se, the total population in ages 80 and above was about 17% higher in 2023 than 2018:

> t=read.csv("http://sars2.net/f/swedenpopdead.csv")
> tail(with(subset(t,age>=80),tapply(pop,year,sum)))
  2018   2019   2020   2021   2022   2023
522133 536306 543720 559634 582347 611556

In the plot below I calculated a second-degree polynomial trend for CMR by single year of age in 2000-2018, then I derived the expected deaths for each year by multiplying the population size of each age group by the trend in CMR. The expected number of deaths per year already started to increase after 2012, but the increase got even steeper in 2018-2023. The total excess mortality in 2020-2023 was about -0.3%, so I guess it's possible that Sweden has actually had negative excess mortality since the start of 2020:

J.J. Couey

Twitter threads by Kevin McKernan

JC has been debunked here:

McKernan quoted a paper titled "An Infectious cDNA Clone of SARS-CoV-2" which said that an infectious clone of SARS2 had similar replication kinetics as a regular clinical isolate: "Seven complimentary DNA (cDNA) fragments spanning the SARS-CoV-2 genome were assembled into a full-genome cDNA. RNA transcribed from the full-genome cDNA was highly infectious after electroporation into cells, producing 2.9 × 10⁶ plaque-forming unit (PFU)/mL of virus. Compared with a clinical isolate, the infectious-clone-derived SARS-CoV-2 (icSARS-CoV-2) exhibited similar plaque morphology, viral RNA profile, and replication kinetics." [https://www.ncbi.nlm.nih.gov/pmc/articles/PMC7153529/]

Someone asked McKernan: "Sir, can you please explain for a layman, how a virus that cannot be sustained in a lab have the capability to circle the globe annually?" But he replied: "Who told you this nonsense? You can order attenuated C19 from ATCC. They irradiate it before it goes out the door to make it non infectious but have sustained cultures for 3 years now. I've ordered this and it qPCRs with CDC primers. Doesn't swarm decay. https://atcc.org/microbe-products/virology/animal-viruses/coronavirus#t=productTab&numberOfResults=24" ["https://twitter.com/Kevin_McKernan/status/1750640339205976386]

McKernan also linked to a paper by Butler et al. which found that in total RNA-seq runs of nasal and oropharyngeal swabs from COVID patients, RNA of SARS2 was more abundant than human RNA, and only about 3% of patients had evidence of a coinfection with another respiratory virus. [https://www.nature.com/articles/s41467-021-21361-7]

Claim that SARS1 was evolving at a much faster rate than SARS2

In a Twitch stream in September 2023, JC said the following: [https://www.twitch.tv/videos/1925658751?t=15m49s]

And so the only way that this works the only way that it really makes sense is if there was a background signal, and then there was the release of a clone to trigger the molecular signal around the world, that, you know, some molecular biologists could call each other up and say, "Hey, we got a new one over here, too, and it's the same - I think it's the same sequence as yours." "Wow, really? So is mine." "Wow really? Ours is the same too."

Which is just not possible. The only remotely close example we have of that is SARS1. The only dataset we have from that is Alina Chan, and that dataset's not published, but it clearly showed that the SARS1 virus was changing at a much higher rate at the beginning when it first came out then this one ever achieved. And so how is that really possible? Well, it's only possible if we're looking at a background stable signal, that's being - let's say - it's being misconstrued as spread. So if there is a SARS virus in the background everywhere, then everywhere we sequence we'd expect to find different ones.

And so all we need to do is just tell us some story about a phylogeny, and some story about change, and every time they want to make it serious they can pick one that looks serious. It's just not - it's not a genuine tale of high-fidelity molecular biology mystery solving. That's not what's happening on the the GenSaid database or whatever it's called. It's a carefully curated - probably library of nonsense.

And that's the unfortunate part that there are just some people who are gonna be spectacularly committed to a lie, and have you believe that before the pandemic we only had a few hundred - maybe even fifty full sequences of a coronavirus - and now, since we put our mind to it, we have several hundred thousand sequences, and a very detailed phylogeny of its evolution over the past three years. That in no way compares to any other phylogeny that we've ever measured in nature, because we've never been able to do that before. And the only one we could've kinda done it with - we only got a few hundred sequences that show - uh, uh, a speed of change five orders of magnitude - or one order of magnitude higher than this one - five times higher than this one.

JC said something like "GenSaid" so I don't know if he meant GISAID or GenBank, but neither of them are carefully curated, because for example both of them are full of sequences with an incorrect collection date, like Omicron sequences with a collection date in 2020. JC said that "before the pandemic we only had a few hundred - maybe even fifty full sequences of a coronavirus", but on GenBank there were 3,122 results which matched the query coronaviridae[organism] 0:2019[dp] 25000:35000[sequence length] (where dp stands for date published). [https://www.ncbi.nlm.nih.gov/nuccore/?term=coronaviridae%5Borganism%5D+0%3A2019%5Bdp%5D+20000%3A40000%5Bsequence+length%5D] And JC said that there's currently several hundred thousand published sequences of SARS2, but actually there's about 16 million SARS2 submissions at GISAID as of September 2023.

SARS1 was also nowhere near the virus with the largest number of complete genetic sequences before 2020, because there's about 200,000 influenza A sequences at the NCBI's influenza virus database, and there's about 20,000 complete HIV-1 sequences at the HIV sequence database of the Los Alamos National Laboratory. [https://www.ncbi.nlm.nih.gov/genomes/FLU/Database/nph-select.cgi, https://www.hiv.lanl.gov/components/sequence/HIV/search/search.html] And even if you only look at betacoronaviruses, GenBank has more sequences of MERS than SARS1.

But anyway, you can download a FASTA file for SARS1 sequences by opening the page for Tor2 at GenBank and clicking "Run BLAST". [https://www.ncbi.nlm.nih.gov/nuccore/30271926] Then enter SARS-CoV-2 (taxid:2697049) into the "Organism" field and click the "exclude" checkbox next to it (because otherwise the search may fail because the CPU use limit is exceeded). Then click "Algorithm parameters", set "Max target sequences" to 500, and click BLAST. Then click "Download" and select "FASTA (complete sequence)". Then run the following code:

brew install mafft seqkit brewsci/bio/snp-dists xmlstarlet
seqkit seq -n Downloads/seqdump.txt|grep -n WIV1,|seqkit range -r 1:$(cut -d: -f1) Downloads/seqdump.txt|seqkit seq -m 29000|mafft --thread 4 ->sars1.fa
(seqkit grep -nrp Tor2 sars1.fa;cat sars1.fa)|seqkit fx2tab|awk -F\\t '{gsub(/[^acgt]/,"-",$2)}NR==1{split($2,a,"");l=length;next}{split($2,b,"");n=0;for(i=1;i<=l;i++)if(a[i]!="-"&&b[i]!="-"&&a[i]!=b[i])n++;print n,$1}'|sort -rn>sars1.dist
curl -sd id=$(seqkit seq -ni sars1.fa|paste -sd, -) 'https://eutils.ncbi.nlm.nih.gov/entrez/eutils/efetch.fcgi?db=nuccore&retmode=xml'>sars1.xml
xml fo -D sars1.xml|xml sel -t -m //GBSeq -v GBSeq_accession-version -o \| -v GBSeq_definition -o \| -v GBSeq_create-date -o \| -v './/GBQualifier[GBQualifier_name="collection_date"]/GBQualifier_value' -o \| -v './/GBQualifier[GBQualifier_name="country"]/GBQualifier_value' -o \| -v './/GBQualifier[GBQualifier_name="host"]/GBQualifier_value' -o \| -v '(.//GBReference_title[text()!="Direct Submission"])[last()]' -n>sars1.meta
awk -F'[ |]' 'NR==FNR{a[$1]=$0;next}{print$1,a[$2]}' sars1.{meta,dist}|sort -n

The output shows sequences of SARS1 and SARS1-like bat viruses sorted by their number of nucleotide changes to the Tor2 reference genome (where it doesn't count positions where either sequence has a gap, an N letter, or a degenerate base):

0 JX163927.1|SARS coronavirus Tor2 isolate Tor2/FP1-10851, complete genome|17-SEP-2012|05-Feb-2010|USA||
0 NC_004718.3|SARS coronavirus Tor2, complete genome|14-APR-2003||Canada: Toronto|Homo sapiens; patient #2 with severe acute respiratory syndrome (SARS)|Analysis of multimerization of the SARS coronavirus nucleocapsid protein
1 JX163923.1|SARS coronavirus Tor2 isolate Tor2/FP1-10912, complete genome|17-SEP-2012|10-Feb-2010|USA||
1 JX163925.1|SARS coronavirus Tor2 isolate Tor2/FP1-10895, complete genome|17-SEP-2012|05-Feb-2010|USA||
1 JX163926.1|SARS coronavirus Tor2 isolate Tor2/FP1-10912, complete genome|17-SEP-2012|10-Feb-2010|USA||
2 AY323977.2|SARS coronavirus HSR 1, complete genome|24-JUN-2003||Italy||Coronaviridae and SARS-associated coronavirus strain HSR1
2 AY427439.1|SARS coronavirus AS, complete genome|13-OCT-2003||||
2 JX163928.1|SARS coronavirus Tor2 isolate Tor2/FP1-10895, complete genome|17-SEP-2012|05-Feb-2010|USA||
3 AY283797.1|SARS coronavirus Sin2748, complete genome|09-MAY-2003||Singapore||Comparative full-length genome sequence analysis of 14 SARS coronavirus isolates and common mutations associated with putative origins of infection
3 AY291451.1|SARS coronavirus TW1, complete genome|14-MAY-2003||Taiwan||The complete genome of SARS coronavirus clone TW1
3 AY394998.1|SARS coronavirus LC1, complete genome|29-JAN-2004||||From independent foci of epidemic outbreak to large genomic alteration in late phase viruses: evolution of the SARS-coronavirus
3 AY502928.1|SARS coronavirus TW5, complete genome|07-JAN-2004||Taiwan||Characterization of severe acute respiratory syndrome coronavirus genomes in Taiwan: molecular epidemiology and genome evolution
3 DQ898174.1|SARS coronavirus strain CV7, complete genome|11-AUG-2007||Canada||The SR-rich motif in SARS-CoV nucleocapsid protein is essential for the virus replication
4 AY282752.2|SARS coronavirus CUHK-Su10, complete genome|07-MAY-2003||||Coronavirus genomic-sequence variations and the epidemiology of the severe acute respiratory syndrome
4 AY283794.1|SARS coronavirus Sin2500, complete genome|09-MAY-2003||Singapore||Comparative full-length genome sequence analysis of 14 SARS coronavirus isolates and common mutations associated with putative origins of infection
4 AY283796.1|SARS coronavirus Sin2679, complete genome|09-MAY-2003||Singapore||Comparative full-length genome sequence analysis of 14 SARS coronavirus isolates and common mutations associated with putative origins of infection
4 AY321118.1|SARS coronavirus TWC, complete genome|17-JUN-2003||||Genomic sequence of SARS isolate from the first fatal case in Taiwan
4 AY357075.1|SARS coronavirus PUMC02, complete genome|17-NOV-2003||||
4 AY502926.1|SARS coronavirus TW3, complete genome|07-JAN-2004||Taiwan||Characterization of severe acute respiratory syndrome coronavirus genomes in Taiwan: molecular epidemiology and genome evolution
4 AY502927.1|SARS coronavirus TW4, complete genome|07-JAN-2004||Taiwan||Characterization of severe acute respiratory syndrome coronavirus genomes in Taiwan: molecular epidemiology and genome evolution
4 AY714217.1|SARS Coronavirus CDC#200301157, complete genome|28-SEP-2004||USA||
4 JQ316196.1|SARS coronavirus HKU-39849 isolate UOB, complete genome|20-MAR-2012|16-Apr-2003|United Kingdom||Reverse Genetics of SARS-Related Coronavirus Using Vaccinia Virus-Based Recombination
5 AY283795.1|SARS coronavirus Sin2677, complete genome|09-MAY-2003||Singapore||Comparative full-length genome sequence analysis of 14 SARS coronavirus isolates and common mutations associated with putative origins of infection
5 AY345986.1|SARS coronavirus CUHK-AG01, complete genome|29-NOV-2003||||Genomic characterisation of the severe acute respiratory syndrome coronavirus of Amoy Gardens outbreak in Hong Kong
5 AY350750.1|SARS coronavirus PUMC01, complete genome|17-NOV-2003||||
5 AY362699.1|SARS coronavirus TWC3, complete genome|13-AUG-2003||||Completed and direct sequence of throat swab sample taken from the first index case in Hoping hospital outbreak
5 AY394978.1|SARS coronavirus GZ-B, complete genome|29-JAN-2004||||From independent foci of epidemic outbreak to large genomic alteration in late phase viruses: evolution of the SARS-coronavirus
5 AY395000.1|SARS coronavirus LC3, complete genome|29-JAN-2004||||From independent foci of epidemic outbreak to large genomic alteration in late phase viruses: evolution of the SARS-coronavirus
5 AY485278.1|SARS coronavirus Sino3-11, complete genome|30-NOV-2003||||Variance analysis of nucleic acid sequence of candidate strain Sino3 for identification of SARS inactivated vaccine
5 AY502929.1|SARS coronavirus TW6, complete genome|07-JAN-2004||Taiwan||Characterization of severe acute respiratory syndrome coronavirus genomes in Taiwan: molecular epidemiology and genome evolution
5 AY502931.1|SARS coronavirus TW8, complete genome|07-JAN-2004||Taiwan||Characterization of severe acute respiratory syndrome coronavirus genomes in Taiwan: molecular epidemiology and genome evolution
5 EU371559.1|SARS coronavirus ZJ02, complete genome|06-JAN-2009||||
5 GU553363.1|SARS coronavirus HKU-39849 isolate TCVSP-HARROD-00001, complete genome|08-FEB-2010|07-Jun-2003|China: Hong Kong|Homo sapiens|
5 JX163924.1|SARS coronavirus Tor2 isolate Tor2/FP1-10851, complete genome|17-SEP-2012|05-Feb-2010|USA||
6 AP006557.1|SARS coronavirus TWH genomic RNA, complete genome|02-AUG-2003||||The complete genome of SARS coronavirus TWH
6 AY283798.2|SARS coronavirus Sin2774, complete genome|09-MAY-2003||Singapore||Comparative full-length genome sequence analysis of 14 SARS coronavirus isolates and common mutations associated with putative origins of infection
6 AY338174.1|SARS coronavirus Taiwan TC1, complete genome|10-JUL-2003||||SARS coronavirus TC1, clinical specimen
6 AY357076.1|SARS coronavirus PUMC03, complete genome|17-NOV-2003||||
6 AY394999.1|SARS coronavirus LC2, complete genome|29-JAN-2004||||From independent foci of epidemic outbreak to large genomic alteration in late phase viruses: evolution of the SARS-coronavirus
6 AY395002.1|SARS coronavirus LC5, complete genome|29-JAN-2004||||From independent foci of epidemic outbreak to large genomic alteration in late phase viruses: evolution of the SARS-coronavirus
6 AY502930.1|SARS coronavirus TW7, complete genome|07-JAN-2004||Taiwan||Characterization of severe acute respiratory syndrome coronavirus genomes in Taiwan: molecular epidemiology and genome evolution
6 AY559086.1|SARS coronavirus Sin849, complete genome|28-MAR-2004||Singapore||Mutational dynamics of the SARS coronavirus in cell culture and human populations isolated in 2003
6 AY559087.1|SARS coronavirus Sin3725V, complete genome|28-MAR-2004||Singapore||Mutational dynamics of the SARS coronavirus in cell culture and human populations isolated in 2003
6 AY559088.1|SARS coronavirus SinP1, complete genome|28-MAR-2004||Singapore||Mutational dynamics of the SARS coronavirus in cell culture and human populations isolated in 2003
6 AY559092.1|SARS coronavirus SinP5, complete genome|28-MAR-2004||Singapore||Mutational dynamics of the SARS coronavirus in cell culture and human populations isolated in 2003
6 GU553365.1|SARS coronavirus HKU-39849 isolate TCVSP-HARROD-00003, complete genome|08-FEB-2010|05-Dec-2007|USA|Chlorocebus aethiops|
7 AY278741.1|SARS coronavirus Urbani, complete genome|21-APR-2003||||SARS coronavirus (SARS-CoV), Urbani strain
7 AY345988.1|SARS coronavirus CUHK-AG03, complete genome|29-NOV-2003||||Genomic characterisation of the severe acute respiratory syndrome coronavirus of Amoy Gardens outbreak in Hong Kong
7 AY394983.1|SARS coronavirus HSZ2-A, complete genome|29-JAN-2004||||From independent foci of epidemic outbreak to large genomic alteration in late phase viruses: evolution of the SARS-coronavirus
7 AY394987.1|SARS coronavirus HZS2-Fb, complete genome|29-JAN-2004||||From independent foci of epidemic outbreak to large genomic alteration in late phase viruses: evolution of the SARS-coronavirus
7 AY394989.1|SARS coronavirus HZS2-D, complete genome|29-JAN-2004||||From independent foci of epidemic outbreak to large genomic alteration in late phase viruses: evolution of the SARS-coronavirus
7 AY394990.1|SARS coronavirus HZS2-E, complete genome|29-JAN-2004||||From independent foci of epidemic outbreak to large genomic alteration in late phase viruses: evolution of the SARS-coronavirus
7 AY502932.1|SARS coronavirus TW9, complete genome|07-JAN-2004||Taiwan||Characterization of severe acute respiratory syndrome coronavirus genomes in Taiwan: molecular epidemiology and genome evolution
7 AY559081.1|SARS coronavirus Sin842, complete genome|28-MAR-2004||Singapore||Mutational dynamics of the SARS coronavirus in cell culture and human populations isolated in 2003
7 FJ882963.1|SARS coronavirus P2, complete genome|12-MAY-2009|10-Aug-2004|USA|Homo sapiens|
8 AP006558.1|SARS coronavirus TWJ genomic RNA, complete genome|02-AUG-2003||||The complete genome of SARS coronavirus TWJ
8 AP006560.1|SARS coronavirus TWS genomic RNA, complete genome|02-AUG-2003||||The complete genome of SARS coronavirus TWS
8 AP006561.1|SARS coronavirus TWY genomic RNA, complete genome|02-AUG-2003||||The complete genome of SARS coronavirus TWY
8 AY394991.1|SARS coronavirus HZS2-Fc, complete genome|29-JAN-2004||||From independent foci of epidemic outbreak to large genomic alteration in late phase viruses: evolution of the SARS-coronavirus
8 AY485277.1|SARS coronavirus Sino1-11, complete genome|30-NOV-2003||||Variance analysis of nucleic acid sequence of candidate strain Sino1 for identification of SARS inactivated vaccine
8 AY502923.1|SARS coronavirus TW10, complete genome|07-JAN-2004||Taiwan||Characterization of severe acute respiratory syndrome coronavirus genomes in Taiwan: molecular epidemiology and genome evolution
8 JN854286.1|SARS coronavirus HKU-39849 isolate recSARS-CoV HKU-39849, complete genome|23-MAY-2012|16-Apr-2003|United Kingdom||Reverse genetics of SARS-related coronavirus using vaccinia virus-based recombination
9 AP006559.1|SARS coronavirus TWK genomic RNA, complete genome|02-AUG-2003||||The complete genome of SARS coronavirus TWK
9 AY291315.1|SARS coronavirus Frankfurt 1, complete genome|11-JUN-2003||||Mechanisms and enzymes involved in SARS coronavirus genome expression
9 AY310120.1|SARS coronavirus FRA, complete genome|12-AUG-2003||||SARS--beginning to understand a new virus
9 AY348314.1|SARS coronavirus Taiwan TC3, complete genome|24-JUL-2003||Taiwan||SARS coronavirus TC3 clinical specimen
9 AY394982.1|SARS coronavirus HGZ8L1-B, partial genome|29-JAN-2004||||From independent foci of epidemic outbreak to large genomic alteration in late phase viruses: evolution of the SARS-coronavirus
9 AY394992.1|SARS coronavirus HZS2-C, complete genome|29-JAN-2004||||From independent foci of epidemic outbreak to large genomic alteration in late phase viruses: evolution of the SARS-coronavirus
9 AY394993.1|SARS coronavirus HGZ8L2, complete genome|29-JAN-2004||||From independent foci of epidemic outbreak to large genomic alteration in late phase viruses: evolution of the SARS-coronavirus
9 AY559091.1|SARS coronavirus SinP4, complete genome|28-MAR-2004||Singapore||Mutational dynamics of the SARS coronavirus in cell culture and human populations isolated in 2003
9 AY559094.1|SARS coronavirus Sin846, complete genome|28-MAR-2004||Singapore||Mutational dynamics of the SARS coronavirus in cell culture and human populations isolated in 2003
9 AY864805.1|SARS coronavirus BJ162, complete genome|08-JUN-2006||China: Beijing||
10 AY559090.1|SARS coronavirus SinP3, complete genome|28-MAR-2004||Singapore||Mutational dynamics of the SARS coronavirus in cell culture and human populations isolated in 2003
10 DQ182595.1|SARS coronavirus ZJ0301 from China, complete genome|13-SEP-2005|21-Apr-2003|China: Hangzhou||Molecular evolution and multilocus sequence typing of 145 strains of SARS-CoV
11 AY278491.2|SARS coronavirus HKU-39849, complete genome|18-APR-2003||||Hong Kong SARS sequence
11 AY278554.2|SARS coronavirus CUHK-W1, complete genome|17-APR-2003||China: Hong Kong, Prince of Wales Hospital||Coronavirus genomic-sequence variations and the epidemiology of the severe acute respiratory syndrome
11 AY338175.1|SARS coronavirus Taiwan TC2, complete genome|10-JUL-2003||||SARS coronavirus TC2, clinical specimen
11 AY502924.1|SARS coronavirus TW11, complete genome|07-JAN-2004||Taiwan||Characterization of severe acute respiratory syndrome coronavirus genomes in Taiwan: molecular epidemiology and genome evolution
11 AY559084.1|SARS coronavirus Sin3765V, complete genome|28-MAR-2004||Singapore||Mutational dynamics of the SARS coronavirus in cell culture and human populations isolated in 2003
11 AY559089.1|SARS coronavirus SinP2, complete genome|28-MAR-2004||Singapore||Mutational dynamics of the SARS coronavirus in cell culture and human populations isolated in 2003
12 AY559093.1|SARS coronavirus Sin845, complete genome|28-MAR-2004||Singapore||Mutational dynamics of the SARS coronavirus in cell culture and human populations isolated in 2003
12 AY864806.1|SARS coronavirus BJ202, complete genome|08-JUN-2006||||Polymorphism of SARS-CoV genomes
13 AY304495.1|SARS coronavirus GZ50, complete genome|05-SEP-2003||Hong Kong||Isolation and characterization of viruses related to the SARS coronavirus from animals in southern China
13 AY559085.1|SARS coronavirus Sin848, complete genome|28-MAR-2004||Singapore||Mutational dynamics of the SARS coronavirus in cell culture and human populations isolated in 2003
13 AY559096.1|SARS coronavirus Sin850, complete genome|28-MAR-2004||Singapore||Mutational dynamics of the SARS coronavirus in cell culture and human populations isolated in 2003
13 AY595412.1|SARS coronavirus LLJ-2004, complete genome|29-JUN-2004||||The genome sequence of the SARS-associated coronavirus
13 DQ497008.1|SARS coronavirus strain MA-15, complete genome|28-MAY-2006||||A mouse-adapted SARS-coronavirus causes overwhelming infection and pulmonary damage associated with dose-dependent morbidity and mortality in BALB/c mice
14 AY278488.2|SARS coronavirus BJ01, complete genome|21-APR-2003||||SARS coronavirus BJ01 isolate genome sequence
14 AY559095.1|SARS coronavirus Sin847, complete genome|28-MAR-2004||Singapore||Mutational dynamics of the SARS coronavirus in cell culture and human populations isolated in 2003
14 MK062179.1|SARS coronavirus Urbani isolate icSARS, complete genome|21-NOV-2018|27-May-2017|USA|Homo sapiens|Evaluation of a recombination-resistant coronavirus as a broadly applicable, rapidly implementable vaccine platform
15 AY394994.1|SARS coronavirus HSZ-Bc, complete genome|29-JAN-2004||||From independent foci of epidemic outbreak to large genomic alteration in late phase viruses: evolution of the SARS-coronavirus
15 AY559083.1|SARS coronavirus Sin3408, complete genome|28-MAR-2004||Singapore||Mutational dynamics of the SARS coronavirus in cell culture and human populations isolated in 2003
16 AY394985.1|SARS coronavirus HSZ-Bb, complete genome|29-JAN-2004||||From independent foci of epidemic outbreak to large genomic alteration in late phase viruses: evolution of the SARS-coronavirus
17 AY279354.2|SARS coronavirus BJ04, complete genome|23-APR-2003||||SARS coronavirus BJ04 partial genome
17 AY394850.2|SARS coronavirus WHU, complete genome|30-SEP-2003||||Isolation of virus from a SARS patient and genome-wide analysis of genetic mutations related to pathogenesis and epidemiology from 47 SARS-CoV isolates
17 AY394979.1|SARS coronavirus GZ-C, complete genome|29-JAN-2004||||From independent foci of epidemic outbreak to large genomic alteration in late phase viruses: evolution of the SARS-coronavirus
17 AY559082.1|SARS coronavirus Sin852, complete genome|28-MAR-2004||Singapore||Mutational dynamics of the SARS coronavirus in cell culture and human populations isolated in 2003
17 AY654624.1|SARS coronavirus TJF, complete genome|24-JUL-2004||||Isolation and Identification of Viruses Related to the SARS Coronavirus from swines in China
18 AY394986.1|SARS coronavirus HSZ-Cb, complete genome|29-JAN-2004||||From independent foci of epidemic outbreak to large genomic alteration in late phase viruses: evolution of the SARS-coronavirus
18 FJ429166.1|Recombinant SARS coronavirus, complete sequence|29-NOV-2008||||Reverse genetic characterization of the natural genomic deletion in SARS-Coronavirus strain Frankfurt-1 open reading frame 7b reveals an attenuating function of the 7b protein in-vitro and in-vivo
20 MK062180.1|SARS coronavirus Urbani isolate icSARS-MA, complete genome|21-NOV-2018|28-May-2017|USA|Homo sapiens|Evaluation of a recombination-resistant coronavirus as a broadly applicable, rapidly implementable vaccine platform
21 AY394995.1|SARS coronavirus HSZ-Cc, complete genome|29-JAN-2004||||From independent foci of epidemic outbreak to large genomic alteration in late phase viruses: evolution of the SARS-coronavirus
22 FJ882938.1|SARS coronavirus wtic-MB, complete genome|13-DEC-2009|22-Sep-2007|USA: Tennessee||Infidelity of SARS-CoV Nsp14-exonuclease mutant virus replication is revealed by complete genome sequencing
23 AY313906.1|SARS coronavirus GD69, complete genome|03-DEC-2003||China: Jiangmen, Guangdong||Cross-host evolution of severe acute respiratory syndrome coronavirus in palm civet and human
24 AY278487.3|SARS coronavirus BJ02, complete genome|21-APR-2003||||SARS coronavirus BJ02 isolate genome sequence
24 AY278490.3|SARS coronavirus BJ03, complete genome|21-APR-2003||||SARS coronavirus BJ03 isolate genome sequence
24 FJ882927.1|SARS coronavirus wtic-MB isolate P1pp1, complete genome|13-DEC-2009|26-Sep-2007|USA: Tennessee||Infidelity of SARS-CoV Nsp14-exonuclease mutant virus replication is revealed by complete genome sequencing
24 FJ882933.1|SARS coronavirus wtic-MB isolate P3pp6, complete genome|13-DEC-2009|28-Mar-2008|USA: Tennessee||Infidelity of SARS-CoV Nsp14-exonuclease mutant virus replication is revealed by complete genome sequencing
24 FJ882934.1|SARS coronavirus wtic-MB isolate P3pp29, complete genome|13-DEC-2009|28-Mar-2008|USA: Tennessee||Infidelity of SARS-CoV Nsp14-exonuclease mutant virus replication is revealed by complete genome sequencing
24 FJ882935.1|SARS coronavirus wtic-MB isolate P3pp21, complete genome|13-DEC-2009|28-Mar-2008|USA: Tennessee||Infidelity of SARS-CoV Nsp14-exonuclease mutant virus replication is revealed by complete genome sequencing
24 FJ882936.1|SARS coronavirus wtic-MB isolate P3pp2, complete genome|13-DEC-2009|28-Mar-2008|USA: Tennessee||Infidelity of SARS-CoV Nsp14-exonuclease mutant virus replication is revealed by complete genome sequencing
24 FJ882947.1|SARS coronavirus wtic-MB isolate P3pp7, complete genome|13-DEC-2009|28-Mar-2008|USA: Tennessee||Infidelity of SARS-CoV Nsp14-exonuclease mutant virus replication is revealed by complete genome sequencing
25 AY297028.1|SARS coronavirus ZJ01, complete genome|19-MAY-2003||||SARS coronavirus ZJ01 isolate genome sequence
25 FJ882932.1|SARS coronavirus wtic-MB isolate P3pp14, complete genome|13-DEC-2009|28-Mar-2008|USA: Tennessee||Infidelity of SARS-CoV Nsp14-exonuclease mutant virus replication is revealed by complete genome sequencing
25 FJ882937.1|SARS coronavirus wtic-MB isolate P3pp18, complete genome|13-DEC-2009|28-Mar-2008|USA: Tennessee||Infidelity of SARS-CoV Nsp14-exonuclease mutant virus replication is revealed by complete genome sequencing
25 FJ882939.1|SARS coronavirus wtic-MB isolate P3pp16, complete genome|13-DEC-2009|28-Mar-2008|USA: Tennessee||Infidelity of SARS-CoV Nsp14-exonuclease mutant virus replication is revealed by complete genome sequencing
25 FJ882949.1|SARS coronavirus wtic-MB isolate P3pp23, complete genome|13-DEC-2009|28-Mar-2008|USA: Tennessee||Infidelity of SARS-CoV Nsp14-exonuclease mutant virus replication is revealed by complete genome sequencing
26 AY461660.1|SARS coronavirus SoD, complete genome|23-NOV-2003||Russia||The complete genome of the SARS associated Coronavirus isolate SoD
26 FJ882926.1|SARS coronavirus ExoN1, complete genome|13-DEC-2009|22-Sep-2007|USA: Tennessee||Infidelity of SARS-CoV Nsp14-exonuclease mutant virus replication is revealed by complete genome sequencing
26 FJ882930.1|SARS coronavirus ExoN1, complete genome|13-DEC-2009|22-Sep-2007|USA: Tennessee||Infidelity of SARS-CoV Nsp14-exonuclease mutant virus replication is revealed by complete genome sequencing
27 EU371560.1|SARS coronavirus BJ182a, complete genome|06-JAN-2009||||
27 EU371561.1|SARS coronavirus BJ182b, complete genome|06-JAN-2009||||
27 EU371563.1|SARS coronavirus BJ182-8, complete genome|06-JAN-2009||||
28 AB257344.1|SARS coronavirus Frankfurt 1 genomic RNA, nearly complete genome, clone: persistent virus #21|19-APR-2006||||Mutations appeared in severe acute respiratory syndrome-associate coronavirus by establishing the persistent infection in Vero E6 cells
28 EU371564.1|SARS coronavirus BJ182-12, complete genome|06-JAN-2009||||
28 FJ882957.1|SARS coronavirus MA15, complete genome|13-DEC-2009|25-Nov-2008|USA: Tennessee||A mouse-adapted SARS-coronavirus causes disease and mortality in BALB/c mice
29 EU371562.1|SARS coronavirus BJ182-4, complete genome|06-JAN-2009||||
29 JF292909.1|SARS coronavirus MA15 isolate d2ym4, complete genome|25-MAR-2011|10-Aug-2008|USA: Nashville, TN|Mus musculus; young|
29 JF292915.1|SARS coronavirus MA15 isolate d4ym5, complete genome|25-MAR-2011|10-Oct-2008|USA: Nashville, TN|Mus musculus; young|
30 DQ640652.1|SARS coronavirus GDH-BJH01, complete genome|12-JUN-2006||China|Homo sapiens|
30 FJ882952.1|SARS coronavirus MA15 isolate P3pp4, complete genome|13-DEC-2009|25-Nov-2008|USA: Tennessee||A mouse-adapted SARS-coronavirus causes disease and mortality in BALB/c mice
30 FJ882958.1|SARS coronavirus MA15 isolate P3pp7, complete genome|13-DEC-2009|25-Nov-2008|USA: Tennessee||A mouse-adapted SARS-coronavirus causes disease and mortality in BALB/c mice
30 HQ890541.1|SARS coronavirus MA15 isolate d2ym1, complete genome|25-MAR-2011|08-Oct-2008|USA: Nashville, TN|Mus musculus; young|
31 FJ882945.1|SARS coronavirus MA15 isolate P3pp6, complete genome|13-DEC-2009|25-Nov-2008|USA: Tennessee||A mouse-adapted SARS-coronavirus causes disease and mortality in BALB/c mice
31 FJ882948.1|SARS coronavirus MA15 isolate P3pp3, complete genome|13-DEC-2009|25-Nov-2008|USA: Tennessee||A mouse-adapted SARS-coronavirus causes disease and mortality in BALB/c mice
32 FJ882928.1|SARS coronavirus ExoN1 isolate P1pp1, complete genome|13-DEC-2009|28-Aug-2007|USA: Tennessee||Infidelity of SARS-CoV Nsp14-exonuclease mutant virus replication is revealed by complete genome sequencing
32 FJ882943.1|SARS coronavirus MA15 ExoN1, complete genome|13-DEC-2009|21-Nov-2008|USA: North Carolina||A mouse-adapted SARS-coronavirus causes disease and mortality in BALB/c mice
32 FJ882961.1|SARS coronavirus MA15 isolate P3pp5, complete genome|13-DEC-2009|25-Nov-2008|USA: Tennessee||A mouse-adapted SARS-coronavirus causes disease and mortality in BALB/c mice
32 HQ890526.1|SARS coronavirus MA15 ExoN1 isolate d2ym1, complete genome|25-MAR-2011|08-Oct-2008|USA: Nashville, TN|Mus musculus; young|
32 HQ890529.1|SARS coronavirus MA15 ExoN1 isolate d2ym4, complete genome|25-MAR-2011|08-Oct-2008|USA: Nashville, TN|Mus musculus; young|
32 HQ890531.1|SARS coronavirus MA15 ExoN1 isolate d4ym1, complete genome|25-MAR-2011|10-Oct-2008|USA: Nashville, TN|Mus musculus; young|
32 HQ890532.1|SARS coronavirus MA15 ExoN1 isolate d4ym2, complete genome|25-MAR-2011|10-Oct-2008|USA: Nashville, TN|Mus musculus; young|
32 HQ890535.1|SARS coronavirus MA15 ExoN1 isolate d2om2, complete genome|25-MAR-2011|17-Sep-2008|USA: Nashville, TN|Mus musculus; old|
32 HQ890538.1|SARS coronavirus MA15 ExoN1 isolate d2om5, complete genome|25-MAR-2011|17-Sep-2008|USA: Nashville, TN|Mus musculus; old|
32 JF292903.1|SARS coronavirus MA15 ExoN1 isolate d4ym5, complete genome|25-MAR-2011|10-Oct-2008|USA: Nashville, TN|Mus musculus; young|
32 JF292905.1|SARS coronavirus MA15 ExoN1 isolate d3om4, complete genome|25-MAR-2011|18-Sep-2008|USA: Nashville, TN|Mus musculus; old|
32 JF292906.1|SARS coronavirus MA15 ExoN1 isolate d3om5, complete genome|25-MAR-2011|18-Sep-2008|USA: Nashville, TN|Mus musculus; old|
38 AY772062.1|SARS coronavirus WH20, complete genome|01-MAR-2005||||Functional study on the infection mechanisms of SARS-CoV based on the infectious clone
38 FJ882940.1|SARS coronavirus ExoN1 isolate P3pp37, complete genome|13-DEC-2009|06-Aug-2008|USA: Tennessee||Infidelity of SARS-CoV Nsp14-exonuclease mutant virus replication is revealed by complete genome sequencing
39 AY463059.1|SARS coronavirus ShanghaiQXC1, complete genome|05-JAN-2004||||Analysis of SARS coronavirus genome in Shanghai isolates
39 AY463060.1|SARS coronavirus ShanghaiQXC2, complete genome|05-JAN-2004||||Analysis of SARS coronavirus genome in Shanghai isolates
40 AY394996.1|SARS coronavirus ZS-B, complete genome|29-JAN-2004||||From independent foci of epidemic outbreak to large genomic alteration in late phase viruses: evolution of the SARS-coronavirus
40 AY395003.1|SARS coronavirus ZS-C, complete genome|29-JAN-2004||||From independent foci of epidemic outbreak to large genomic alteration in late phase viruses: evolution of the SARS-coronavirus
41 AY390556.1|SARS coronavirus GZ02, complete genome|31-JAN-2004||China: Guangzhou||SARS coronavirus GZ02 isolate genome sequence
41 FJ882955.1|SARS coronavirus ExoN1 isolate P3pp19, complete genome|13-DEC-2009|28-Mar-2008|USA: Tennessee||Infidelity of SARS-CoV Nsp14-exonuclease mutant virus replication is revealed by complete genome sequencing
41 MK062181.1|SARS coronavirus Urbani isolate icSARS-C3, complete genome|21-NOV-2018|29-May-2017|USA|Homo sapiens|Evaluation of a recombination-resistant coronavirus as a broadly applicable, rapidly implementable vaccine platform
43 FJ882931.1|SARS coronavirus ExoN1 isolate P3pp12, complete genome|13-DEC-2009|28-Mar-2008|USA: Tennessee||Infidelity of SARS-CoV Nsp14-exonuclease mutant virus replication is revealed by complete genome sequencing
44 FJ882953.1|SARS coronavirus MA15 ExoN1 isolate P3pp4, complete genome|13-DEC-2009|26-Nov-2008|USA: Tennessee||A mouse-adapted SARS-coronavirus causes disease and mortality in BALB/c mice
44 FJ882954.1|SARS coronavirus ExoN1 isolate P3pp46, complete genome|13-DEC-2009|06-Aug-2008|USA: Tennessee||Infidelity of SARS-CoV Nsp14-exonuclease mutant virus replication is revealed by complete genome sequencing
44 FJ882956.1|SARS coronavirus ExoN1 isolate P3pp53, complete genome|13-DEC-2009|06-Aug-2008|USA: Tennessee||Infidelity of SARS-CoV Nsp14-exonuclease mutant virus replication is revealed by complete genome sequencing
44 FJ882960.1|SARS coronavirus ExoN1 isolate P3pp34, complete genome|13-DEC-2009|06-Aug-2008|USA: Tennessee||Infidelity of SARS-CoV Nsp14-exonuclease mutant virus replication is revealed by complete genome sequencing
45 FJ882950.1|SARS coronavirus ExoN1 isolate P3pp60, complete genome|13-DEC-2009|06-Aug-2008|USA: Tennessee||Infidelity of SARS-CoV Nsp14-exonuclease mutant virus replication is revealed by complete genome sequencing
45 FJ882951.1|SARS coronavirus MA15 ExoN1 isolate P3pp3, complete genome|13-DEC-2009|26-Nov-2008|USA: Tennessee||A mouse-adapted SARS-coronavirus causes disease and mortality in BALB/c mice
47 FJ882929.1|SARS coronavirus ExoN1 isolate P3pp1, complete genome|13-DEC-2009|28-Mar-2008|USA: Tennessee||Infidelity of SARS-CoV Nsp14-exonuclease mutant virus replication is revealed by complete genome sequencing
47 FJ882944.1|SARS coronavirus ExoN1 isolate P3pp23, complete genome|13-DEC-2009|28-Mar-2008|USA: Tennessee||Infidelity of SARS-CoV Nsp14-exonuclease mutant virus replication is revealed by complete genome sequencing
47 JF292922.1|SARS coronavirus ExoN1 isolate c5P1, complete genome|25-MAR-2011|18-Mar-2009|USA: Nashville, TN||
47 MK062182.1|SARS coronavirus Urbani isolate icSARS-C3-MA, complete genome|21-NOV-2018|30-May-2017|USA|Homo sapiens|Evaluation of a recombination-resistant coronavirus as a broadly applicable, rapidly implementable vaccine platform
49 FJ882941.1|SARS coronavirus ExoN1 isolate P3pp8, complete genome|13-DEC-2009|28-Mar-2008|USA: Tennessee||Infidelity of SARS-CoV Nsp14-exonuclease mutant virus replication is revealed by complete genome sequencing
49 FJ882962.1|SARS coronavirus MA15 ExoN1 isolate P3pp10, complete genome|13-DEC-2009|18-Dec-2008|USA: Tennessee||A mouse-adapted SARS-coronavirus causes disease and mortality in BALB/c mice
51 AY278489.2|SARS coronavirus GD01, complete genome|21-APR-2003||||The E protein is a multifunctional membrane protein of SARS-CoV
51 FJ882942.1|SARS coronavirus MA15 ExoN1 isolate P3pp5, complete genome|13-DEC-2009|26-Nov-2008|USA: Tennessee||A mouse-adapted SARS-coronavirus causes disease and mortality in BALB/c mice
53 FJ882959.1|SARS coronavirus MA15 ExoN1 isolate P3pp6, complete genome|13-DEC-2009|26-Nov-2008|USA: Tennessee||A mouse-adapted SARS-coronavirus causes disease and mortality in BALB/c mice
54 MK062183.1|SARS coronavirus Urbani isolate icSARS-C7, complete genome|21-NOV-2018|31-May-2017|USA|Homo sapiens|Evaluation of a recombination-resistant coronavirus as a broadly applicable, rapidly implementable vaccine platform
56 AY304486.1|SARS coronavirus SZ3, complete genome|05-SEP-2003||Hong Kong||Isolation and characterization of viruses related to the SARS coronavirus from animals in southern China
57 AY304488.1|SARS coronavirus SZ16, complete genome|05-SEP-2003||Hong Kong||Isolation and characterization of viruses related to the SARS coronavirus from animals in southern China
59 JX162087.1|SARS coronavirus ExoN1 isolate c5P10, complete genome|20-JUN-2012|01-Jan-2009|USA: Tennessee||
60 MK062184.1|SARS coronavirus Urbani isolate icSARS-C7-MA, complete genome|21-NOV-2018|01-Jun-2017|USA|Homo sapiens|Evaluation of a recombination-resistant coronavirus as a broadly applicable, rapidly implementable vaccine platform
77 AY572035.1|SARS coronavirus civet010, complete genome|23-AUG-2005||China: Southern China|civet|SARS-CoV infection in a restaurant from palm civet
78 AY686864.1|SARS coronavirus B039, complete genome|08-JUL-2005|||palm civet|Characterization of SARS-CoV like virus from animals in southern China
78 KF514407.1|SARS coronavirus ExoN1 strain SARS/VeroE6_lab/USA/ExoN1_c5.7P20/2010, complete genome|17-AUG-2013|01-Oct-2010|USA: Nashville, TN||
80 AY545914.1|SARS coronavirus isolate HC/SZ/79/03, complete genome|01-MAR-2005||China: Shenzhen||An Averted SARS Outbreak?
80 AY545916.1|SARS coronavirus isolate HC/SZ/266/03, complete genome|01-MAR-2005||China||An Averted SARS Outbreak?
82 AY351680.1|SARS coronavirus ZMY 1, complete genome|03-AUG-2003||||
82 AY545917.1|SARS coronavirus isolate HC/GZ/81/03, complete genome|01-MAR-2005||China||An Averted SARS Outbreak?
83 AY572034.1|SARS coronavirus civet007, complete genome|23-AUG-2005||China: Southern China|civet|SARS-CoV infection in a restaurant from palm civet
84 AY545918.1|SARS coronavirus isolate HC/GZ/32/03, complete genome|01-MAR-2005||China||An Averted SARS Outbreak?
84 AY686863.1|SARS coronavirus A022, complete genome|08-JUL-2005||||Characterization of SARS-CoV like virus from animals in southern China
86 AY613950.1|SARS coronavirus PC4-227, complete genome|28-JAN-2005||China|palm civet|Cross-host evolution of severe acute respiratory syndrome coronavirus in palm civet and human
88 AY545919.1|SARS coronavirus isolate CFB/SZ/94/03, complete genome|01-MAR-2005||China||An Averted SARS Outbreak?
88 AY572038.1|SARS coronavirus civet020, complete genome|23-AUG-2005||China: Southern China|civet|SARS-CoV infection in a restaurant from palm civet
89 AY515512.1|SARS coronavirus HC/SZ/61/03, complete genome|01-JAN-2005||China|Paguma larvata (Himalayan palm civets)|An Averted SARS Outbreak?
90 AY568539.1|SARS coronavirus GZ0401, complete genome|28-FEB-2005||China: December 22, 2003||Cross-host evolution of severe acute respiratory syndrome coronavirus in palm civet and human
90 AY613948.1|SARS coronavirus PC4-13, complete genome|28-JAN-2005||China|palm civet|Cross-host evolution of severe acute respiratory syndrome coronavirus in palm civet and human
92 AY613949.1|SARS coronavirus PC4-136, complete genome|28-JAN-2005||China|palm civet|Cross-host evolution of severe acute respiratory syndrome coronavirus in palm civet and human
93 AY613947.1|SARS coronavirus GZ0402, complete genome|28-JAN-2005||China||Cross-host evolution of severe acute respiratory syndrome coronavirus in palm civet and human
96 FJ959407.1|SARS coronavirus isolate A001, complete genome|26-SEP-2009||China|palm civet|The isolation and genome analysis of a SARS coronavirus from palm civet
456 MT308984.1|Mutant SARS coronavirus Urbani clone SARS-Urbani-MA_SHC014-spike, complete genome|02-MAY-2020|||mouse|Author Correction: A SARS-like cluster of circulating bat coronaviruses shows potential for human emergence
1122 KT444582.1|SARS-like coronavirus WIV16, complete genome|13-JAN-2016|21-Jul-2013|China|Rhinolophus sinicus|Isolation and characterization of a novel bat coronavirus closely related to the direct progenitor of SARS coronavirus
1125 KY417150.1|Bat SARS-like coronavirus isolate Rs4874, complete genome|01-NOV-2017|21-Jul-2013|China|Rhinolophus sinicus|Discovery of a rich gene pool of bat SARS-related coronaviruses provides new insights into the origin of SARS coronavirus
1174 OK017852.1|Sarbecovirus sp. isolate YN2020B, complete genome|22-SEP-2021|Jun-2020|China: Yunnan|Rhinolophus sinicus|A comprehensive survey of bat sarbecoviruses across China in relation to the origins of SARS-CoV and SARS-CoV-2
1174 OK017854.1|Sarbecovirus sp. isolate YN2020D, complete genome|22-SEP-2021|Jun-2020|China: Yunnan|Rhinolophus sinicus|A comprehensive survey of bat sarbecoviruses across China in relation to the origins of SARS-CoV and SARS-CoV-2
1174 OK017856.1|Sarbecovirus sp. isolate YN2020F, complete genome|22-SEP-2021|Jun-2020|China: Yunnan|Rhinolophus sinicus|A comprehensive survey of bat sarbecoviruses across China in relation to the origins of SARS-CoV and SARS-CoV-2
1176 KY417146.1|Bat SARS-like coronavirus isolate Rs4231, complete genome|01-NOV-2017|17-Apr-2013|China|Rhinolophus sinicus|Discovery of a rich gene pool of bat SARS-related coronaviruses provides new insights into the origin of SARS coronavirus
1176 OK017855.1|Sarbecovirus sp. isolate YN2020E, complete genome|22-SEP-2021|Jun-2020|China: Yunnan|Rhinolophus sinicus|A comprehensive survey of bat sarbecoviruses across China in relation to the origins of SARS-CoV and SARS-CoV-2
1176 OK017857.1|Sarbecovirus sp. isolate YN2020G, complete genome|22-SEP-2021|Jun-2020|China: Yunnan|Rhinolophus sinicus|A comprehensive survey of bat sarbecoviruses across China in relation to the origins of SARS-CoV and SARS-CoV-2
1177 OK017853.1|Sarbecovirus sp. isolate YN2020C, complete genome|22-SEP-2021|Jun-2020|China: Yunnan|Rhinolophus sinicus|A comprehensive survey of bat sarbecoviruses across China in relation to the origins of SARS-CoV and SARS-CoV-2
1184 OQ175344.1|Bat Coronavirus RsYN20 isolate BtRs-BetaCoV/YN2020-Q324, complete genome|14-AUG-2023|22-Jun-2020|China: Yunnan|Rhinolophus sinicus|Panoramic Analysis of Coronaviruses Carried by Representative Bat Species in Southern China to Better Understand the Coronavirus Sphere
1185 OQ175347.1|Bat Coronavirus RsYN20 isolate BtRs-BetaCoV/YN2020-Q327, complete genome|14-AUG-2023|24-Jun-2020|China: Yunnan|Rhinolophus sinicus|Panoramic Analysis of Coronaviruses Carried by Representative Bat Species in Southern China to Better Understand the Coronavirus Sphere
1186 OQ175345.1|Bat Coronavirus RsYN20 isolate BtRs-BetaCoV/YN2020-Q325, complete genome|14-AUG-2023|22-Jun-2020|China: Yunnan|Rhinolophus sinicus|Panoramic Analysis of Coronaviruses Carried by Representative Bat Species in Southern China to Better Understand the Coronavirus Sphere
1188 OQ175346.1|Bat Coronavirus RsYN20 isolate BtRs-BetaCoV/YN2020-Q326, complete genome|14-AUG-2023|23-Jun-2020|China: Yunnan|Rhinolophus sinicus|Panoramic Analysis of Coronaviruses Carried by Representative Bat Species in Southern China to Better Understand the Coronavirus Sphere
1188 OQ175348.1|Bat Coronavirus RsYN20 isolate BtRs-BetaCoV/YN2020-Q328, complete genome|14-AUG-2023|25-Jun-2020|China: Yunnan|Rhinolophus sinicus|Panoramic Analysis of Coronaviruses Carried by Representative Bat Species in Southern China to Better Understand the Coronavirus Sphere
1226 OQ503505.1|Severe acute respiratory syndrome-related coronavirus isolate 162181, complete genome|22-JUN-2023|13-Aug-2016|China|Rhinolophus sinicus|Isolation of ACE2-dependent and -independent sarbecoviruses from Chinese horseshoe bats
1227 KY417152.1|Bat SARS-like coronavirus isolate Rs9401, complete genome|01-NOV-2017|16-Oct-2015|China|Rhinolophus sinicus|Discovery of a rich gene pool of bat SARS-related coronaviruses provides new insights into the origin of SARS coronavirus
1228 MK211376.1|Coronavirus BtRs-BetaCoV/YN2018B, complete genome|30-JUN-2019|Sep-2016|China|Rhinolophus affinis|The identification of diverse bat alphacoronaviruses and betacoronaviruses in Chinese provinces provides new insights into the evolution and origin of CoV-related diseases
1231 KY417151.1|Bat SARS-like coronavirus isolate Rs7327, complete genome|01-NOV-2017|24-Oct-2014|China|Rhinolophus sinicus|Discovery of a rich gene pool of bat SARS-related coronaviruses provides new insights into the origin of SARS coronavirus
1245 KC881006.1|Bat SARS-like coronavirus Rs3367, complete genome|06-NOV-2013|19-Mar-2012|China|Rhinolophus sinicus|Isolation and characterization of a bat SARS-like coronavirus that uses the ACE2 receptor
1247 OK017849.1|Sarbecovirus sp. isolate YN2016C, complete genome|22-SEP-2021|Aug-2016|China: Yunnan|Rhinolophus sinicus|A comprehensive survey of bat sarbecoviruses across China in relation to the origins of SARS-CoV and SARS-CoV-2
1248 OQ503504.1|Severe acute respiratory syndrome-related coronavirus isolate 162173, complete genome|22-JUN-2023|13-Aug-2016|China|Rhinolophus sinicus|Isolation of ACE2-dependent and -independent sarbecoviruses from Chinese horseshoe bats
1253 OK017850.1|Sarbecovirus sp. isolate YN2016D, complete genome|22-SEP-2021|Aug-2016|China: Yunnan|Rhinolophus sinicus|A comprehensive survey of bat sarbecoviruses across China in relation to the origins of SARS-CoV and SARS-CoV-2
1254 OK017851.1|Sarbecovirus sp. isolate YN2016E, complete genome|22-SEP-2021|Aug-2016|China: Yunnan|Rhinolophus sinicus|A comprehensive survey of bat sarbecoviruses across China in relation to the origins of SARS-CoV and SARS-CoV-2
1257 OK017847.1|Sarbecovirus sp. isolate YN2016A, complete genome|22-SEP-2021|Aug-2016|China: Yunnan|Rhinolophus sinicus|A comprehensive survey of bat sarbecoviruses across China in relation to the origins of SARS-CoV and SARS-CoV-2
1257 OK017848.1|Sarbecovirus sp. isolate YN2016B, complete genome|22-SEP-2021|Aug-2016|China: Yunnan|Rhinolophus sinicus|A comprehensive survey of bat sarbecoviruses across China in relation to the origins of SARS-CoV and SARS-CoV-2
1258 KF367457.1|Bat SARS-like coronavirus WIV1, complete genome|06-NOV-2013|Sep-2012|China|Rhinolophus sinicus|Isolation and characterization of a bat SARS-like coronavirus that uses the ACE2 receptor
1317 KC881005.1|Bat SARS-like coronavirus RsSHC014, complete genome|06-NOV-2013|17-Apr-2011|China|Rhinolophus sinicus|Isolation and characterization of a bat SARS-like coronavirus that uses the ACE2 receptor
1703 MK211378.1|Coronavirus BtRs-BetaCoV/YN2018D, complete genome|30-JUN-2019|Sep-2016|China|Rhinolophus affinis|The identification of diverse bat alphacoronaviruses and betacoronaviruses in Chinese provinces provides new insights into the evolution and origin of CoV-related diseases
1732 KY417142.1|Bat SARS-like coronavirus isolate As6526, complete genome|01-NOV-2017|12-May-2014|China|Aselliscus stoliczkanus|Discovery of a rich gene pool of bat SARS-related coronaviruses provides new insights into the origin of SARS coronavirus
1740 KY417147.1|Bat SARS-like coronavirus isolate Rs4237, complete genome|01-NOV-2017|17-Apr-2013|China|Rhinolophus sinicus|Discovery of a rich gene pool of bat SARS-related coronaviruses provides new insights into the origin of SARS coronavirus
1740 MK211377.1|Coronavirus BtRs-BetaCoV/YN2018C, complete genome|30-JUN-2019|Sep-2016|China|Rhinolophus affinis|The identification of diverse bat alphacoronaviruses and betacoronaviruses in Chinese provinces provides new insights into the evolution and origin of CoV-related diseases
1982 OP963575.1|Bat SARS-like virus BtSY1 ORF1ab polyprotein (ORF1ab), ORF1a protein (ORF1ab), spike glycoprotein, ORF3a protein, ORF3b protein, envelope protein, membrane glycoprotein M, ORF6 protein, ORF7a protein, ORF7b protein, ORF8 protein, nucleocapsid protein, and ORF10 protein genes, complete cds|24-JAN-2023|2018|China: Yunnan|Rhinolophus thomasi|Individual bat virome analysis reveals co-infection and spillover among bats and virus zoonotic potential

The output above shows that if you exclude samples with a non-human host, recombinant and synthetic sequences, and lab-created strains like MA15, wtic-MB, and ExoN1, then the vast majority of sequences have less than 20 nucleotide changes from Tor2, but the furthest sample from Tor2 is GZ02 which has 41 nucleotide changes, followed by ZS-B and ZS-C which both have 40 nucleotide changes. The ZS-B and ZS-C samples come from a paper titled "From independent foci of epidemic outbreak to large genomic alteration in late phase viruses: evolution of the SARS-coronavirus". There's 18 other samples from the same paper, but the other samples have between 3 and 21 nucleotide changes from Tor2, so the ZS-B and ZS-C samples seem to be anomalous, even though they are also similar to the GZ02 sample from another paper. There's no collection date listed for any of the three samples, even though GZ02 was submitted in September 2003, which is about a year after the collection date of Tor2 which was in September 2012. And the collection date of Wuhan-Hu-1 is in December 2019, and by December 2020 there were already some Alpha samples which had over 40 mutations from Wuhan-Hu-1.

From the plot below you can see that ZS-B and ZS-C are atypical sequences because GZ02 is the only sample which is closer to them than to Tor2 (R code):

A paper from 2004 which analyzed 63 SARS1 sequences from different phases of the epidemic said: "We noticed that the neutral mutation rate for SARS-CoV during this epidemic was almost constant (fig. S5) (14) and was estimated to be 8.26 × 10⁻⁶ (± 2.16 × 10⁻⁶)nt⁻¹ day⁻¹." [https://sci-hub.ee/https://www.science.org/doi/10.1126/science.1092002] However that's about 1/1300 mutations per site per year, which is similar to the mutation rate of SARS2.

Claim that there were 49 sequences of human coronaviruses available on the Internet in 2019

In a Twitch stream in October 2023, Couey said: "You know how many sequences of human coronaviruses there were available on the Internet in 2019? 49! 49!" [https://www.twitch.tv/videos/1955162291?t=1h27m36s]

However when I searched NCBI's nucleotide database for 0:2019[dp] human coronavirus 25000:35000[sequence length] (where "dp" stands for date published), there were a total of 376 results, with 182 results listed for OC43, 72 results for NL63, 50 results for HKU1, and so on. [https://www.ncbi.nlm.nih.gov/nuccore/?term=0%3A2019%5Bdp%5D+human+coronavirus+20000%3A40000%5Bsequence+length%5D] But it was missing many human coronaviruses where the title or other metadata of the entry did not match the words "human" and "coronavirus", including all sequences of SARS1 and MERS. There were 582 results for the search phrase 0:2019[dp] "Middle East respiratory syndrome coronavirus" 25000:35000[sequence length] (even though many of the MERS sequences came from camels and not humans, because I don't know how to filter the search results by host species). And there's almost a hundred complete human SARS1 sequences that were published at GenBank before 2020.

Was SARS2 circulating in humans before 2020 but not detected in the same way that HKU1 and NL63 were only discovered after SARS1?

Couey did a Twitch stream where he showed this sentence from a textbook about virology: "Remarkably, HCoV-NL63 and HCoV-HKU1 were only discovered recently, in the post-SARS era, despite the fact that each has a worldwide prevalence and has been in circulation for a long time." [https://www.twitch.tv/videos/2054590093?t=1h8m9s] So then Couey said that maybe SARS2 was similarly circulating in humans for a long time but it just wasn't deteceted earlier: "So how would we differentiate between the novel spreading pathogen and a pathogen that already had previous endemicity - that was already in the background - that we didn't even notice, that we didn't even detect until recently. And how would we know how many of these viruses have been detected in the background as part of a complement of RNA signals that are just there all the time, and we still haven't been able to get a good solid read on, because people like Nathan Wolfe have told us it's just like a dark matter of life down there, dark matter of DNA and RNA, genetic noise inside of which are hidden new life forms. How do we know that they haven't hypercharacterized that whole background signal at that size scale? [...] Well how could something have a worldwide prevalence and us not know it? How many more things could have a worldwide prevalence but we wouldn't have known because we just didn't pay attention, because we have common colds all the time."

In a later part of the stream Couey may have referred indirectly to a section of my nopandemic.html file where I pointed out that there's about 15 million sequencing runs that were published before 2020 at the NCBI's Sequence Read Archive, but I didn't find reads of SARS2 in any of them, and the only runs I found where sarbecovirus reads may have come from a human sample were French influenza A samples from 2008-2013 which matched SARS1 (but the runs matched lab-created wtic and ExoN1 strains of SARS1 so they may have also been contaminated in the lab).

So I decided to try if I could find reads of HKU1 or NL63 in random metagenomic sequencing runs at the SRA. So I ran this query to search for runs published before 2020 which had 10 or more reads that had a STAT hit for NL63: [https://www.ncbi.nlm.nih.gov/sra/docs/sra-bigquery/]

select * from `nih-sra-datastore.sra.metadata` as m, `nih-sra-datastore.sra_tax_analysis_tool.tax_analysis` as tax where m.acc=tax.acc and tax_id=277944 and total_count>=10 and releasedate<"2020-01-01" order by releasedate

There were a total of 101 results, which included some runs where the purpose was to sequence NL63, but they also included some random human metagenomic samples:

$ wget sars2.net/f/bigquerynl63.json
$ jq -r '.[]|[.acc,.sra_study,.total_count,.mbytes,.avgspotlen,.organism,(.releasedate|sub(" .*";"")),.assay_type,.center_name]|join("|")' bigquerynl63.json
ERR298310|ERP001119|114991|118|300|unidentified|2013-06-19|AMPLICON|SC
ERR298307|ERP001119|3123|28|300|unidentified|2013-06-19|AMPLICON|SC
ERR298309|ERP001119|7807|136|300|unidentified|2013-06-19|AMPLICON|SC
ERR298314|ERP001119|12|140|300|unidentified|2013-06-19|AMPLICON|SC
ERR298324|ERP001119|23|235|300|unidentified|2013-06-19|AMPLICON|SC
ERR298316|ERP001119|15|110|300|unidentified|2013-06-19|AMPLICON|SC
ERR298308|ERP001119|297|2|300|unidentified|2013-06-19|AMPLICON|SC
ERR298313|ERP001119|13|152|300|unidentified|2013-06-19|AMPLICON|SC
ERR338601|ERP003855|2709|6|178|metagenome|2013-11-11|AMPLICON|AMCNL
ERR338615|ERP003855|34|1|152|metagenome|2013-11-11|AMPLICON|AMCNL
ERR338596|ERP003855|871|2|189|metagenome|2013-11-11|AMPLICON|AMCNL
SRR2010685|SRP058055|21|1661|200|viral metagenome|2015-05-08|WGA|NATIONAL INSTITUTE FOR VIRAL DISEASE CONTROL AND P
SRR2040557|SRP058055|461|1937|250|viral metagenome|2015-05-27|WGA|NATIONAL INSTITUTE FOR VIRAL DISEASE CONTROL AND P
ERR969462|ERP010858|25|82|82|Lactobacillus gasseri|2015-07-31|WGS|WEIZMANN INSTITUE OF SCIENCE
ERR969490|ERP010858|35|58|82|Lactobacillus gasseri|2015-07-31|WGS|WEIZMANN INSTITUE OF SCIENCE
ERR969489|ERP010858|48|148|82|Lactobacillus gasseri|2015-07-31|WGS|WEIZMANN INSTITUE OF SCIENCE
ERR969508|ERP010858|20|88|82|Lactobacillus gasseri|2015-07-31|WGS|WEIZMANN INSTITUE OF SCIENCE
ERR969498|ERP010858|49|299|82|Lactobacillus gasseri|2015-07-31|WGS|WEIZMANN INSTITUE OF SCIENCE
ERR969491|ERP010858|29|195|82|Lactobacillus gasseri|2015-07-31|WGS|WEIZMANN INSTITUE OF SCIENCE
SRR2760982|SRP065210|3688|115|217|synthetic construct|2015-10-26|OTHER|GEO
SRR2760943|SRP065210|49|131|51|synthetic construct|2015-10-26|OTHER|GEO
SRR2760959|SRP065210|14|30|51|synthetic construct|2015-10-26|OTHER|GEO
SRR2760938|SRP065210|35|129|51|synthetic construct|2015-10-26|OTHER|GEO
SRR2760974|SRP065210|35|128|51|synthetic construct|2015-10-26|OTHER|GEO
SRR2760932|SRP065210|41|131|51|synthetic construct|2015-10-26|OTHER|GEO
SRR2760964|SRP065210|25|130|51|synthetic construct|2015-10-26|OTHER|GEO
SRR2760953|SRP065210|36|126|51|synthetic construct|2015-10-26|OTHER|GEO
SRR2760954|SRP065210|32|124|51|synthetic construct|2015-10-26|OTHER|GEO
SRR2760945|SRP065210|31|126|51|synthetic construct|2015-10-26|OTHER|GEO
SRR2760944|SRP065210|29|126|51|synthetic construct|2015-10-26|OTHER|GEO
SRR2760973|SRP065210|27|129|51|synthetic construct|2015-10-26|OTHER|GEO
SRR2760960|SRP065210|27|129|51|synthetic construct|2015-10-26|OTHER|GEO
SRR2760968|SRP065210|22|131|51|synthetic construct|2015-10-26|OTHER|GEO
SRR2760977|SRP065210|24|124|51|synthetic construct|2015-10-26|OTHER|GEO
SRR2760970|SRP065210|27|126|51|synthetic construct|2015-10-26|OTHER|GEO
SRR2760978|SRP065210|19|127|51|synthetic construct|2015-10-26|OTHER|GEO
SRR2760941|SRP065210|31|127|51|synthetic construct|2015-10-26|OTHER|GEO
SRR2760958|SRP065210|26|124|51|synthetic construct|2015-10-26|OTHER|GEO
SRR2760928|SRP065210|129|131|51|synthetic construct|2015-10-26|OTHER|GEO
SRR2760972|SRP065210|15|129|51|synthetic construct|2015-10-26|OTHER|GEO
SRR2760933|SRP065210|31|124|51|synthetic construct|2015-10-26|OTHER|GEO
SRR2760931|SRP065210|62|52|51|synthetic construct|2015-10-26|OTHER|GEO
SRR2760949|SRP065210|37|130|51|synthetic construct|2015-10-26|OTHER|GEO
SRR2760948|SRP065210|38|128|51|synthetic construct|2015-10-26|OTHER|GEO
SRR2760975|SRP065210|14|129|51|synthetic construct|2015-10-26|OTHER|GEO
SRR2760950|SRP065210|34|126|51|synthetic construct|2015-10-26|OTHER|GEO
SRR2760966|SRP065210|22|128|51|synthetic construct|2015-10-26|OTHER|GEO
SRR2760937|SRP065210|38|130|51|synthetic construct|2015-10-26|OTHER|GEO
SRR2760961|SRP065210|24|131|51|synthetic construct|2015-10-26|OTHER|GEO
SRR2760942|SRP065210|19|125|51|synthetic construct|2015-10-26|OTHER|GEO
SRR2760952|SRP065210|33|127|51|synthetic construct|2015-10-26|OTHER|GEO
SRR2760976|SRP065210|32|129|51|synthetic construct|2015-10-26|OTHER|GEO
SRR2760930|SRP065210|134|130|51|synthetic construct|2015-10-26|OTHER|GEO
SRR2760947|SRP065210|28|101|51|synthetic construct|2015-10-26|OTHER|GEO
SRR2760939|SRP065210|46|130|51|synthetic construct|2015-10-26|OTHER|GEO
SRR2760980|SRP065210|9121|145|223|synthetic construct|2015-10-26|OTHER|GEO
SRR2760934|SRP065210|30|124|51|synthetic construct|2015-10-26|OTHER|GEO
SRR2760979|SRP065210|9046|127|220|synthetic construct|2015-10-26|OTHER|GEO
SRR2760962|SRP065210|27|129|51|synthetic construct|2015-10-26|OTHER|GEO
SRR2760946|SRP065210|27|123|51|synthetic construct|2015-10-26|OTHER|GEO
SRR2760951|SRP065210|41|129|51|synthetic construct|2015-10-26|OTHER|GEO
SRR2760963|SRP065210|25|130|51|synthetic construct|2015-10-26|OTHER|GEO
SRR2760969|SRP065210|21|126|51|synthetic construct|2015-10-26|OTHER|GEO
SRR2760936|SRP065210|30|128|51|synthetic construct|2015-10-26|OTHER|GEO
SRR2760967|SRP065210|21|125|51|synthetic construct|2015-10-26|OTHER|GEO
SRR2760981|SRP065210|3723|103|213|synthetic construct|2015-10-26|OTHER|GEO
SRR2760965|SRP065210|31|126|51|synthetic construct|2015-10-26|OTHER|GEO
SRR2760940|SRP065210|26|128|51|synthetic construct|2015-10-26|OTHER|GEO
SRR2760957|SRP065210|28|132|51|synthetic construct|2015-10-26|OTHER|GEO
SRR2760929|SRP065210|77|56|51|synthetic construct|2015-10-26|OTHER|GEO
ERR1137974|ERP012929|10|59|79|human gut metagenome|2015-11-27|WGS|WEIZMANN INSTITUE OF SCIENCE
ERR1136752|ERP012929|33|2496|198|human gut metagenome|2015-11-27|WGS|WEIZMANN INSTITUE OF SCIENCE
ERR1136756|ERP012929|70|1393|197|human gut metagenome|2015-11-27|WGS|WEIZMANN INSTITUE OF SCIENCE
ERR1136754|ERP012929|32|2438|198|human gut metagenome|2015-11-27|WGS|WEIZMANN INSTITUE OF SCIENCE
ERR1137984|ERP012929|26|136|79|human gut metagenome|2015-11-27|WGS|WEIZMANN INSTITUE OF SCIENCE
ERR1137937|ERP012929|10|78|79|human gut metagenome|2015-11-27|WGS|WEIZMANN INSTITUE OF SCIENCE
ERR1110296|ERP012929|19|833|82|human gut metagenome|2015-11-27|WGS|WEIZMANN INSTITUE OF SCIENCE
ERR1136755|ERP012929|20|1535|197|human gut metagenome|2015-11-27|WGS|WEIZMANN INSTITUE OF SCIENCE
SRR2051847|SRP059140|10|16|40|Schmidtea mediterranea|2015-12-08|RNA-Seq|THE WHITEHEAD INSTITUTE FOR BIOMEDICAL RESEARCH
SRR2051757|SRP059140|31|104|49|Schmidtea mediterranea|2015-12-08|RNA-Seq|THE WHITEHEAD INSTITUTE FOR BIOMEDICAL RESEARCH
ERR1360080|ERP014917|18499|2283|202|Human coronavirus NL63|2016-04-16|RNA-Seq|UNIVERSITY OF UTAH, SCHOOL OF MEDICINE
ERR1399348|ERP014917|18499|1022|202|Human coronavirus NL63|2016-05-07|RNA-Seq|UNIVERSITY OF UTAH, SCHOOL OF MEDICINE
SRR5080092|SRP094624|99|3553|200|Solanum lycopersicum|2016-12-06|WGS|AGIS-CAAS
SRR5080062|SRP094624|343|3494|200|Solanum lycopersicum|2016-12-06|WGS|AGIS-CAAS
SRR5080052|SRP094624|416|3524|200|Solanum lycopersicum|2016-12-06|WGS|AGIS-CAAS
SRR5080045|SRP094624|531|3549|200|Solanum lycopersicum|2016-12-06|WGS|AGIS-CAAS
SRR5080046|SRP094624|49|3509|200|Solanum lycopersicum|2016-12-06|WGS|AGIS-CAAS
SRR5079873|SRP094624|290|3378|200|Solanum lycopersicum|2016-12-06|WGS|AGIS-CAAS
SRR5080073|SRP094624|262|3682|200|Solanum lycopersicum|2016-12-06|WGS|AGIS-CAAS
SRR5080123|SRP094624|87|3269|200|Solanum lycopersicum|2016-12-06|WGS|AGIS-CAAS
SRR5080133|SRP094624|234|3373|200|Solanum lycopersicum|2016-12-06|WGS|AGIS-CAAS
SRR5080110|SRP094624|11|3019|200|Solanum lycopersicum|2016-12-06|WGS|AGIS-CAAS
SRR2995160|SRP067369|96|2340|200|Zea mays|2016-12-14|ChIP-Seq|CHINA AGRICULTURAL UNIVERSITY
SRR4026659|SRP081599|1891|578|50|Homo sapiens|2017-01-06|RNA-Seq|GEO
SRR5188768|SRP097131|34|462|300|human metagenome|2017-01-24|WGA|BLOOD SYSTEMS RESEARCH INSTITUTE
SRR5215291|SRP098405|11|286|300|Influenza A virus|2017-03-24|WGS|FRED HUTCHINSON CANCER RESEARCH CENTER
SRR5215290|SRP098405|773|424|300|Influenza A virus|2017-03-24|WGS|FRED HUTCHINSON CANCER RESEARCH CENTER
SRR5295650|SRP100814|675461|2442|602|ssRNA viruses|2017-04-29|RNA-Seq|LINKOU CHANG GUNG MEMORIAL HOSPITAL
SRR5295649|SRP100814|69428|3390|602|ssRNA viruses|2017-04-29|RNA-Seq|LINKOU CHANG GUNG MEMORIAL HOSPITAL
SRR5871962|SRP111068|18435|16|188|Homo sapiens|2017-07-27|RNA-Seq|UNIVERSITY OF WASHINGTON LABORATORY MEDICINE
SRR5872015|SRP111068|87011|29|188|Homo sapiens|2017-07-27|RNA-Seq|UNIVERSITY OF WASHINGTON LABORATORY MEDICINE
SRR5871950|SRP111068|28057|16|192|Homo sapiens|2017-07-27|RNA-Seq|UNIVERSITY OF WASHINGTON LABORATORY MEDICINE
SRR5872050|SRP111068|238|16|190|Homo sapiens|2017-07-27|RNA-Seq|UNIVERSITY OF WASHINGTON LABORATORY MEDICINE
SRR5871961|SRP111068|21117|32|188|Homo sapiens|2017-07-27|RNA-Seq|UNIVERSITY OF WASHINGTON LABORATORY MEDICINE
SRR5872113|SRP111068|13344|12|192|Homo sapiens|2017-07-27|RNA-Seq|UNIVERSITY OF WASHINGTON LABORATORY MEDICINE
SRR5871946|SRP111068|53996|12|192|Homo sapiens|2017-07-27|RNA-Seq|UNIVERSITY OF WASHINGTON LABORATORY MEDICINE
SRR5871947|SRP111068|27|15|192|Homo sapiens|2017-07-27|RNA-Seq|UNIVERSITY OF WASHINGTON LABORATORY MEDICINE
SRR5872029|SRP111068|90930|12|94|Homo sapiens|2017-07-27|RNA-Seq|UNIVERSITY OF WASHINGTON LABORATORY MEDICINE
SRR5868318|SRP113588|35|2274|202|wastewater metagenome|2017-08-01|WGS|UNB
SRR5908856|SRP115011|109|3706|181|Homo sapiens|2017-08-11|RNA-Seq|GEO
ERR2060109|ERP024314|148|138|300|Escherichia coli|2017-08-22|WGS|ACADEMISCH MEDISCH CENTRUM
ERR2060108|ERP024314|39|114|300|Escherichia coli|2017-08-22|WGS|ACADEMISCH MEDISCH CENTRUM
SRR4098607|SRP083744|21171|5|164|viral metagenome|2017-09-01|OTHER|THE GENOME INSTITUTE AT WASHINGTON UNIVERSITY SCHOOL OF MEDICINE
SRR6075030|SRP118855|13|1770|300|Mus musculus|2017-09-29|RNA-Seq|INSTITUTE OF NEUROSCIENCE, SHANGHAI INSTITUTES FOR BIOLOGICAL SCIENCES, CHINESE ACADEMY OF SCIENCES
SRR6994411|SRP139809|458|6|403|metagenome|2018-04-12|OTHER|CDC-PDD
SRR6994466|SRP139809|1121|4|349|metagenome|2018-04-12|OTHER|CDC-PDD
SRR6994314|SRP139809|23|153|333|metagenome|2018-04-12|OTHER|CDC-PDD
SRR6994329|SRP139809|25|1|349|metagenome|2018-04-12|OTHER|CDC-PDD
SRR6994290|SRP139809|30759|8|454|metagenome|2018-04-12|OTHER|CDC-PDD
SRR6994569|SRP139809|191142|44|409|metagenome|2018-04-12|OTHER|CDC-PDD
SRR6994288|SRP139809|20|111|332|metagenome|2018-04-12|OTHER|CDC-PDD
SRR6994495|SRP139809|34|3|398|metagenome|2018-04-12|OTHER|CDC-PDD
SRR6994451|SRP139809|16|29|398|metagenome|2018-04-12|OTHER|CDC-PDD
SRR6994612|SRP139809|50|0|338|metagenome|2018-04-12|OTHER|CDC-PDD
SRR6994577|SRP139809|680|2|314|metagenome|2018-04-12|OTHER|CDC-PDD
SRR6994504|SRP139809|11|99|334|metagenome|2018-04-12|OTHER|CDC-PDD
SRR6220391|SRP121528|40|3601|200|Oryza sativa|2018-07-13|WGS|CHINESE ACADAMY OF SCIENCES
SRR6220524|SRP121528|42|3644|200|Oryza sativa Japonica Group|2018-07-13|WGS|CHINESE ACADAMY OF SCIENCES
SRR6220407|SRP121528|29|3514|200|Oryza sativa Indica Group|2018-07-13|WGS|CHINESE ACADAMY OF SCIENCES
SRR7754038|SRP083744|203|11|115|viral metagenome|2018-08-24|WGS|WASHINGTON UNIVERSITY SCHOOL OF MEDICINE
ERR2721003|ERP109879|125|290|200|Salmonella enterica subsp. enterica serovar Pullorum|2018-09-13|WGS|YANGZHOU UNIVERSITY
SRR7586389|SRP154984|15361|1506|200|Homo sapiens|2018-09-25|RNA-Seq|GEO
SRR7586356|SRP154984|11|1762|200|Homo sapiens|2018-09-25|RNA-Seq|GEO
SRR7586358|SRP154984|28|2173|200|Homo sapiens|2018-09-25|RNA-Seq|GEO
SRR7992643|SRP157584|15|166|252|human skin metagenome|2018-10-12|WGS|NISC
SRR7992642|SRP157584|35|163|252|human skin metagenome|2018-10-12|WGS|NISC
SRR7011768|SRP140557|923|576|50|Homo sapiens|2018-12-25|RNA-Seq|GEO
SRR7011745|SRP140557|77|545|50|Homo sapiens|2018-12-25|RNA-Seq|GEO
ERR3178641|ERP006046|19|1534|500|viral metagenome|2019-02-28|WGS|WELLCOME SANGER INSTITUTE
ERR3180491|ERP006046|145|6247|500|viral metagenome|2019-02-28|WGS|WELLCOME SANGER INSTITUTE
ERR3180630|ERP006046|177|82|500|viral metagenome|2019-02-28|WGS|WELLCOME SANGER INSTITUTE
ERR3180546|ERP006046|189|81|500|viral metagenome|2019-02-28|WGS|WELLCOME SANGER INSTITUTE
ERR3180575|ERP006046|141|6291|500|viral metagenome|2019-02-28|WGS|WELLCOME SANGER INSTITUTE
ERR3178736|ERP006046|14|1558|500|viral metagenome|2019-02-28|WGS|WELLCOME SANGER INSTITUTE
SRR7310170|SRP150456|166|230|56|Homo sapiens|2019-04-09|RNA-Seq|GEO
SRR7309918|SRP150456|13157|502|56|Homo sapiens|2019-04-09|RNA-Seq|GEO
SRR7309875|SRP150456|99|226|56|Homo sapiens|2019-04-09|RNA-Seq|GEO
SRR7309944|SRP150456|41380|341|56|Homo sapiens|2019-04-09|RNA-Seq|GEO
SRR7310193|SRP150456|1999|195|56|Homo sapiens|2019-04-09|RNA-Seq|GEO
SRR7309917|SRP150456|49|658|56|Homo sapiens|2019-04-09|RNA-Seq|GEO
SRR7309866|SRP150456|120748|222|56|Homo sapiens|2019-04-09|RNA-Seq|GEO
SRR7309855|SRP150456|41|96|56|Homo sapiens|2019-04-09|RNA-Seq|GEO
SRR7309868|SRP150456|26|337|56|Homo sapiens|2019-04-09|RNA-Seq|GEO
SRR7309933|SRP150456|3010|399|56|Homo sapiens|2019-04-09|RNA-Seq|GEO
SRR7309906|SRP150456|63|39|54|Homo sapiens|2019-04-09|RNA-Seq|GEO
SRR7310123|SRP150456|63|170|56|Homo sapiens|2019-04-09|RNA-Seq|GEO
SRR7309888|SRP150456|3742|150|56|Homo sapiens|2019-04-09|RNA-Seq|GEO
SRR7309864|SRP150456|33530|182|56|Homo sapiens|2019-04-09|RNA-Seq|GEO
SRR7310144|SRP150456|41|239|56|Homo sapiens|2019-04-09|RNA-Seq|GEO
SRR7310195|SRP150456|1034|162|56|Homo sapiens|2019-04-09|RNA-Seq|GEO
SRR7309867|SRP150456|1803|158|56|Homo sapiens|2019-04-09|RNA-Seq|GEO
SRR7309865|SRP150456|24493|301|56|Homo sapiens|2019-04-09|RNA-Seq|GEO
SRR8261377|SRP171137|1228|6457|240|Homo sapiens|2019-05-03|RNA-Seq|MD ANDERSON CANCER CENTER
SRR7615344|SRP155609|22|179|270|human metagenome|2019-05-29|RNA-Seq|UNIVERSITY OF CALIFORNIA, SAN FRANCISCO
SRR9211507|SRP200658|638|0|365|Human coronavirus NL63|2019-06-06|WGS|KEMRI WELLCOME-TRUST
SRR9016772|SRP195497|67|385|50|Caenorhabditis elegans|2019-08-08|RNA-Seq|GEO
SRR9016775|SRP195497|91|363|50|Caenorhabditis elegans|2019-08-08|RNA-Seq|GEO
SRR9016777|SRP195497|165|453|50|Caenorhabditis elegans|2019-08-08|RNA-Seq|GEO
SRR9016771|SRP195497|85|429|50|Caenorhabditis elegans|2019-08-08|RNA-Seq|GEO
SRR9016774|SRP195497|57|313|50|Caenorhabditis elegans|2019-08-08|RNA-Seq|GEO
SRR9016770|SRP195497|80|471|50|Caenorhabditis elegans|2019-08-08|RNA-Seq|GEO
SRR9016773|SRP195497|92|379|50|Caenorhabditis elegans|2019-08-08|RNA-Seq|GEO
SRR9016776|SRP195497|74|405|50|Caenorhabditis elegans|2019-08-08|RNA-Seq|GEO
SRR9967739|SRP218358|12|43|302|metagenome|2019-08-14|WGS|LEIDEN UNIVERSITY MEDICAL CENTER
SRR9966485|SRP218334|118742|208|302|metagenome|2019-08-14|WGS|LEIDEN UNIVERSITY MEDICAL CENTER
SRR9966486|SRP218334|20|135|302|metagenome|2019-08-14|WGS|LEIDEN UNIVERSITY MEDICAL CENTER
SRR9966511|SRP218334|1168|86|302|metagenome|2019-08-14|WGS|LEIDEN UNIVERSITY MEDICAL CENTER
SRR9967741|SRP218358|6206|16|302|metagenome|2019-08-14|WGS|LEIDEN UNIVERSITY MEDICAL CENTER
SRR10033305|SRP219571|85|103|293|Human orthopneumovirus|2019-08-29|AMPLICON|KEMRI WELLCOME-TRUST
SRR7772153|SRP159212|13|50619|200|Sus scrofa|2019-09-29|WGS|JIANGXI AGRICULTURAL UNIVERSITY
SRR7772155|SRP159212|11|50500|200|Sus scrofa|2019-09-29|WGS|JIANGXI AGRICULTURAL UNIVERSITY
SRR8868699|SRP150456|36889|256|56|Homo sapiens|2019-10-24|RNA-Seq|GEO
SRR7963138|SRP163370|62499|83|298|human metagenome|2019-11-03|WGS|HOSPICES CIVILS DE LYON
SRR7963127|SRP163370|1473|253|246|human metagenome|2019-11-03|WGS|HOSPICES CIVILS DE LYON
SRR9909268|SRP217528|52|1627|150|Homo sapiens|2019-11-21|RNA-Seq|GEO
SRR10769511|SRP238864|10|56|160|Ebola virus|2019-12-27|AMPLICON|UNIVERSITY OF CALIFORNIA SAN FRANCISCO

When I tried picking some metagenomic runs at random from the list above, at first I looked up this entry: SRR6994612|SRP139809|50|0|338|metagenome|2018-04-12|OTHER|CDC-PDD. It was part of a study titled "Respiratory Virus Enrichment Method for Genomic Sequencing and Identification", but the authors of the study did targeted enrichment specifically for NL63, so I rejected it because the authors knew that they were looking for NL63. [https://www.ncbi.nlm.nih.gov/sra/?term=SRR6994612]

Next I looked up this entry: SRR7754038|SRP083744|203|11|115|viral metagenome|2018-08-24|WGS|WASHINGTON UNIVERSITY SCHOOL OF MEDICINE. The abstract for the run at SRA said: "Metagenomic sequencing of samplings from clinical infections. Sample types include stool, nasopharynx, skin, etc." [https://www.ncbi.nlm.nih.gov/sra/?term=SRR7754038] The sample was described as a nasopharyngeal swab. I downloaded the reads and I aligned them against a FASTA file of about 19,000 virus reference sequences:

$ curl "https://www.ebi.ac.uk/ena/portal/api/filereport?accession=SRR7754038&result=read_run&fields=fastq_ftp"|sed 1d|cut -f1|tr \; \\n|sed s,^,ftp://,|xargs wget
[...]
$ wget https://ftp.ncbi.nlm.nih.gov/refseq/release/viral/viral.1.1.genomic.fna.gz
[...]
$ brew install bowtie2 seqkit
[...]
$ brew install --cask miniconda;conda init ${SHELL##*/};conda install -c bioconda bbmap # optional; only used to mask low-complexity regions
[...]
$ seqkit fx2tab viral.1.1.genomic.fna.gz|sed $'s/A*\t$//'|seqkit tab2fx|bbmask.sh window=20 in=stdin out=viral.fa
[...]
$ bowtie2-build --threads 3 viral.fa{,}
[...]
$ bowtie2 -p4 --no-unal -x viral.fa -U SRR7754038.fastq.gz --score-min L,-1.2,-1.2|samtools sort ->nl.bam
246154 reads; of these:
  246154 (100.00%) were unpaired; of these:
    245728 (99.83%) aligned 0 times
    381 (0.15%) aligned exactly 1 time
    45 (0.02%) aligned >1 times
0.17% overall alignment rate

I got 236 reads which aligned against NL63, but I also got 84 reads which aligned against an Escherichia phage and 62 reads which aligned against a human herpesvirus (so if you had a flu and you went to do metagenomic sequencing for a nasopharyngeal swab, you could've found out that you also had herpes):

$ x=nl.bam;samtools coverage $x|awk \$4|cut -f1,3-6|(gsed -u '1s/$/\terr%\tname/;q';sort -rnk5|awk -F\\t -v OFS=\\t 'NR==FNR{a[$1]=$2;next}{print$0,sprintf("%.2f",a[$1])}' <(samtools view $x|awk -F\\t '{x=$3;n[x]++;len[x]+=length($10);sub(/.*NM:i:/,"");mis[x]+=$1}END{for(i in n)print i"\t"100*mis[i]/len[i]}') -|awk -F\\t 'NR==FNR{a[$1]=$2;next}{print$0"\t"a[$1]}' <(seqkit seq -n viral.fa|gsed 's/ /\t/;s/,.*//') -)|column -ts$'\t'
#rname       endpos  numreads  covbases  coverage  err%  name
NC_001422.1  5385    84        4390      81.5227   1.57  Escherichia phage phiX174
NC_005831.2  27553   236       16979     61.6231   1.12  Human Coronavirus NL63
NC_074583.1  4387    3         301       6.86118   8.88  SsRNA phage SRR5466369_2 genomic sequence
NC_001348.1  124884  62        6545      5.24086   2.01  Human herpesvirus 3
NC_074405.1  3924    3         138       3.51682   5.10  SsRNA phage SRR5466337_3 genomic sequence
NC_039199.1  13350   1         125       0.93633   8.80  Human metapneumovirus isolate 00-1
NC_027398.1  38742   2         220       0.567859  6.82  Enterobacteria phage Sf101
NC_018275.1  39783   1         125       0.314205  6.40  Salmonella phage vB_SemP_Emek
NC_042057.1  42924   1         125       0.291212  0.80  Enterobacteria phage DE3
NC_019711.1  47287   1         125       0.264343  0.80  Enterobacteria phage HK629
NC_049953.1  47224   1         114       0.241403  5.26  Escherichia phage Lambda_ev099 genome assembly
NC_049814.1  51854   1         110       0.212134  3.64  Shigella phage JK16
NC_047938.1  51810   1         91        0.175642  2.20  Escherichia phage SECphi27 genome assembly
NC_049819.1  50732   1         51        0.100528  5.88  Escherichia phage atuna

In the code above I used loose alignment criteria which were loose enough that they would cause some reads of SARS2 to get aligned against SARS1, so if you would've ran the code in 2019 when SARS2 wasn't included in NCBI's set of virus reference sequences but SARS1 was, then you would've been able to discover that the reads contained some novel SARS-like virus if you got reads of SARS2 to align against SARS1. Winjor Small Mountain Dog used a similar method to discover SARS2 in December 2019, because his lab did metagenomic sequencing for a sample of an early COVID patient and he found that some of the reads matched SARS1.

In the following code where I took the same metagenomic reads which matched NL63 and I tried to align them against hCoV 229E, I got 2 reads which aligned against 229E with an average mismatch rate of about 21%. So if I would've run the code at a time when the genome of 229E had been published but the genome of NL63 hadn't been, then I would've been able to discover that the reads matched some new virus that was related to 229E:

$ seqkit grep -nrp 229E viral.fa>229e.fa
$ bowtie2-build --threads 3 229e.fa{,}
$ bowtie2 -p4 --no-unal -x 229e.fa -U SRR7754038.fastq.gz --score-min L,-1.2,-1.2|samtools sort ->nl2.bam
$ x=nl2.bam;samtools coverage $x|awk \$4|cut -f1,3-6|(gsed -u '1s/$/\terr%\tname/;q';sort -rnk5|awk -F\\t -v OFS=\\t 'NR==FNR{a[$1]=$2;next}{print$0,sprintf("%.2f",a[$1])}' <(samtools view $x|awk -F\\t '{x=$3;n[x]++;len[x]+=length($10);sub(/.*NM:i:/,"");mis[x]+=$1}END{for(i in n)print i"\t"100*mis[i]/len[i]}') -|awk -F\\t 'NR==FNR{a[$1]=$2;next}{print$0"\t"a[$1]}' <(seqkit seq -n viral.fa|gsed 's/ /\t/;s/,.*//') -)|column -ts$'\t'
#rname       endpos  numreads  covbases  coverage  err%   name
NC_002645.1  27277   2         233       0.8542    21.03  Human coronavirus 229E

Next I tried downloading another metagenomic run that was part of a study where the abstract said: "Overall design: 208 children with exacerbation prone asthma were enrolled according to the inclusion criteria. Each child had baseline samples collected and were prospectively monitored for the onset of cold symptoms (Events) during a 6 month period. 106/208 children came in during one or more events and had sufficient samples collected for analysis." [https://www.ncbi.nlm.nih.gov/sra/?term=SRR7309933] This run had almost a thousand times more reads than the run I looked at previously, so I also got a much larger number of reads which aligned against NL63. I also got 100% coverage for an Escherichia phage. Even though I filtered out human reads, some human still remained which aligned against viruses like Snyder-Theilen feline sarcoma virus, but you can tell that the sarcoma viruses are likely spurious matches since they have a high error rate:

$ curl "https://www.ebi.ac.uk/ena/portal/api/filereport?accession=SRR7309933&result=read_run&fields=fastq_ftp"|sed 1d|cut -f1|tr \; \\n|sed s,^,ftp://,|xargs wget
$ wget -q https://genome-idx.s3.amazonaws.com/bt/GRCh38_noalt_as.zip
$ unzip GRCh38_noalt_as.zip
[...]
$ bowtie2 -x GRCh38_noalt_as/GRCh38_noalt_as -p4 --no-unal -U SRR7309933.fastq.gz|cut -f1|grep -v ^@>asthmahuman
[...]
$ seqkit grep -vf asthmahuman SRR7309933.fastq.gz|bowtie2 -p4 --no-unal -x viral.fa -U-|samtools sort ->asthma3.bam
$ x=asthma3.bam;samtools coverage $x|awk \$4|cut -f1,3-6|(gsed -u '1s/$/\terr%\tname/;q';sort -rnk5|awk -F\\t -v OFS=\\t 'NR==FNR{a[$1]=$2;next}{print$0,sprintf("%.2f",a[$1])}' <(samtools view $x|awk -F\\t '{x=$3;n[x]++;len[x]+=length($10);sub(/.*NM:i:/,"");mis[x]+=$1}END{for(i in n)print i"\t"100*mis[i]/len[i]}') -|awk -F\\t 'NR==FNR{a[$1]=$2;next}{print$0"\t"a[$1]}' <(seqkit seq -n viral.fa|gsed 's/ /\t/;s/,.*//') -)|column -ts$'\t'
#rname       endpos  numreads  covbases  coverage   err%   name
NC_001422.1  5385    22324     5385      100        0.37   Escherichia phage phiX174
NC_005831.2  27553   4957      17309     62.8207    0.88   Human Coronavirus NL63
NC_043382.1  4900    144       497       10.1429    5.92   Snyder-Theilen feline sarcoma virus genomic sequence
NC_074583.1  4387    99        286       6.51926    2.22   SsRNA phage SRR5466369_2 genomic sequence
NC_038858.1  3810    23        134       3.51706    8.92   FBR murine osteosarcoma
NC_074405.1  3924    108       134       3.41488    0.60   SsRNA phage SRR5466337_3 genomic sequence
NC_008094.1  5188    27        137       2.64071    9.90   Y73 sarcoma virus
NC_001506.1  3811    13        84        2.20415    8.93   Murine osteosarcoma virus
NC_001403.1  4788    22        86        1.79616    10.38  Fujinami sarcoma virus
NC_007820.1  6037    10        90        1.49081    1.05   Coliphage NC35
NC_007823.1  6063    22        90        1.48441    1.91   Coliphage NC28
NC_007822.1  6066    17        90        1.48368    1.03   Coliphage WA45
NC_007827.1  6257    30        90        1.43839    1.40   Coliphage NC29
NC_007819.1  6071    13        87        1.43304    0.54   Coliphage ID32
NC_007821.1  6066    7         86        1.41774    0.76   Enterobacteria phage WA13
NC_007817.1  5484    14        74        1.34938    1.63   Enterobacteria phage ID2 Moscow/ID/2001
NC_007824.1  6049    13        81        1.33906    0.81   Coliphage ID62
NC_001730.1  6087    10        70        1.14999    0.18   Bacteriophage phiK complete genome
NC_012868.1  6094    8         69        1.13226    0.00   Enterobacteria phage St-1
NC_007825.1  5536    3         60        1.08382    0.00   Coliphage ID52
NC_001330.1  6085    2         62        1.0189     0.00   Enterobacteria phage alpha3
NC_009424.5  5779    1         57        0.98633    5.26   Woolly monkey sarcoma virus
NC_001499.1  5894    1         56        0.950119   5.36   Abelson murine leukemia virus
NC_007818.1  6066    1         56        0.923178   0.00   Coliphage ID21
NC_003678.1  12602   2         114       0.904618   6.14   Pestivirus giraffe-1 H138 complete genome
NC_001407.1  9392    24        68        0.72402    10.00  Rous sarcoma virus
NC_033774.1  8913    5         61        0.684394   6.64   Pepper chlorotic spot virus isolate 14YV733 segment L
NC_042057.1  42924   6         275       0.640667   1.48   Enterobacteria phage DE3
NC_001416.1  48502   5         286       0.589666   1.75   Enterobacteria phage lambda
NC_041925.1  54836   66        315       0.57444    6.75   UNVERIFIED: Proteus phage VB_PmiS-Isfahan
NC_019711.1  47287   4         227       0.480047   0.00   Enterobacteria phage HK629
NC_001461.1  12573   1         58        0.461306   3.45   Bovine viral diarrhea virus 1
NC_049951.1  41969   3         168       0.400295   0.00   Enterobacteria phage O276
NC_005344.1  39043   2         113       0.289424   1.77   Enterobacteria phage Sf6
NC_047813.1  18546   8         52        0.280384   15.46  Staphylococcus phage Andhra
NC_049955.1  45560   3         84        0.184372   0.00   Escherichia phage Lambda_ev243 genome assembly
NC_027398.1  38742   1         56        0.144546   0.00   Enterobacteria phage Sf101
NC_049448.1  39642   1         57        0.143787   6.90   Klebsiella phage ST437-OXA245phi4.1
NC_008168.1  104709  24        135       0.128929   11.09  Choristoneura fumiferana granulovirus
NC_049950.1  46288   1         56        0.120982   8.77   Escherichia virus Lambda_2H10 genome assembly
NC_049953.1  47224   1         57        0.120701   0.00   Escherichia phage Lambda_ev099 genome assembly
NC_049946.1  49168   1         58        0.117963   0.00   Escherichia virus Lambda_4A7 genome assembly
NC_018279.1  49116   1         57        0.116052   0.00   Salmonella phage vB_SosS_Oslo
NC_054662.1  49299   1         57        0.115621   8.77   Streptomyces phage Omar
NC_049952.1  48763   1         56        0.114841   8.77   Escherichia virus Lambda_2B8 genome assembly
NC_049948.1  50125   1         57        0.113716   0.00   Escherichia phage Lambda_ev017 genome assembly
NC_027984.1  57677   1         58        0.10056    0.00   Stx2 converting phage vB_EcoP_24B
NC_049925.1  61578   1         52        0.0844457  0.00   Stx converting phage vB_EcoS_P27
NC_050152.1  101660  1         57        0.0560693  1.75   Enterobacteria phage P7

So similarly if SARS2 would've been widespread in humans before 2020, you would be able to find reads of SARS2 in random metagenomic sequencing runs of human samples (unless for example the runs would've been removed from SRA, but even then labs also keep their own copies of their past sequencing runs, and there's several projects which have been mirroring the SRA).

Housatonic

Claim that excess deaths from drug overdoses in the US in 2020-2022 were approximately equal to COVID deaths

Mark Kulacz from Housatonic Live said: "If we had a 100, 150 thousand - it all depends on what you consider to be the baseline - excess deaths of drug overdoses between 2020, 2021, and 2022 - if we had that many excess deaths from drug overdoses, how is it possible that for those three years, the total number of excess deaths equals the total number of COVID deaths? I didn't say 150,000 people died of drug overdose. What I said was excess deaths. During those three years, we actually had 315,000 drug overdose deaths, in the United States in those three years. Baseline as of the year 2000 was 32,000 people a year. So you could make it a point that it's over 200,000. Well, 200,000, you could make it a point it's 100,000, 110,000 excess deaths of the 307,000 based upon the record level going into 2019. How is it possible that you can have at least over 100,000 - maybe 150,000 - excess deaths of another tragedy? Yet the total excess deaths equals the total number of COVID deaths. How is that possible? Do we have 150,000 less people die from shark attacks? Did we have 150,000 less people die from car accidents?" [https://www.youtube.com/watch?v=BR0cY51ID1M&t=42m12s]

Housatonic said that there were only about 100-150 thousand COVID deaths in the United States in 2020-2022, but actually the number reported by CDC and OWID is about 1.1 million:

$ wget -q https://covid.ourworldindata.org/data/owid-covid-data.csv
$ csvtk -T cut -f location,new_deaths,date owid-covid-data.csv|awk -F\\t '$1=="United States"{a[substr($3,1,4)]+=$2}END{for(i in a)print i,a[i]}'
2020 352004
2021 467051
2022 265838
2023 44696

The number of excess deaths during the COVID pandemic is typically not calculated relative to the number of deaths during a single year like 2019, but it's calculated relative to a past trend, like the trend from 2015 to 2019 in the case of CDC's dataset for excess mortality during COVID. [https://www.cdc.gov/nchs/nvss/vsrr/covid19/excess_deaths.htm] So if there was an increasing trend in drug overdose deaths in 2015-2019, then the trend is included in the baseline that is used to calculate excess mortality.

In the plot below which shows the yearly number of drug overdose deaths and some other drug-related deaths in the US, the total number of deaths was about 92,000 in 2020 and about 107,000 in 2021: [https://nida.nih.gov/research-topics/trends-statistics/overdose-death-rates]

You can get similar data yourself from CDC WONDER. [https://wonder.cdc.gov/mcd.html] First click on "Data Request" under the final data for 1999-2020 and click "I Agree". Then in section 1, set "Group Results By" to "Year", in section 6 click "Advanced Finder Options" and set the "Selected Items" to "X40 X41 X42 X43 X44 X60 X61 X62 X63 X64 X85 Y10 Y11 Y12 Y13 Y14" (with each ICD code on its own line), and in section 8 click "Export Results", and then click "Send". Then repeat the same procedure for the provisional data from 2018 until the present.

Then run this code:

(awk 'NR==1||/^\t/' Multiple\ Cause\ of\ Death\,\ 1999-2020.txt;sed -n 5,6p Provisional\ Mortality\ Statistics\,\ 2018\ through\ Last\ Week.txt)|tr -d \"|cut -f3-6|tr \\t ,>wonder.csv

Then run the following R code which calculates yearly excess deaths using the linear trend in 2015-2019 as the baseline:

> t=read.csv("wonder.csv")
> t$trend=lm(Deaths~Year.Code,t|>subset(Year.Code>=2015&Year.Code<=2019))|>predict(t)
> t$excess=t$Deaths-t$trend
> tail(t,8)[,c(1,2,5,6)]|>print.data.frame(row.names=F)
Year.Code Deaths   trend  excess
     2015  52404 56816.6 -4412.6
     2016  63632 60835.3  2796.7
     2017  70237 64854.0  5383.0
     2018  67367 68872.7 -1505.7
     2019  70630 72891.4 -2261.4
     2020  91799 76910.1 14888.9
     2021 106699 80928.8 25770.2
     2022 108193 84947.5 23245.5
> sum(t$excess[t$Year>=2020])
[1] 63904.6

So the code above shows that the total number of excess deaths in 2020-2022 was only about 64,000 (even though some deaths from 2022 are still missing because drug-related deaths often have a long registration delay).

Here's also a plot of the same data:

It's also difficult to confuse drug deaths with COVID deaths because most COVID deaths are in elderly age groups but most deaths from drug overdoses are in younger age groups. And COVID deaths occur in waves which coincide with waves of high PCR positivity rate, but drug deaths are distributed more evenly throughout the year. And COVID deaths also occur at different times in different states, so that for example southern states had waves of COVID deaths in summer 2020 and summer 2021 which didn't occur in northern states, but there is less within-year variation in the pattern of drug overdose deaths across states.

In another YouTube stream, Housatonic said: "Through statistical manipulation, flu deaths are reclassified as COVID deaths. Which in and of itself does not increase the overall mortality. But you know what did? Those drug overdose deaths in vast quantity backfilled missing flu deaths." [https://www.youtube.com/watch?v=0vuLqXHK0P0&t=20m35s] However in the years before COVID, CDC estimated that the average number of influenza deaths per year in the US was only about 30,000, but the total number of excess deaths in the United States from 2020 to 2022 is listed as about 1.25 million at OWID. [https://www.cdc.gov/flu/about/burden/index.html, https://ourworldindata.org/grapher/cumulative-excess-deaths-covid?country=%7eUSA&time=earliest..2023-01-01] Flu deaths generally occur in the winter and they coincide with periods when there's a high PCR positivity rate for influenza viruses, but according to WHO's influenza statistics for the United States, the PCR positivity rate for influenza viruses was close to 0% from spring 2020 until around November 2021. [https://app.powerbi.com/view?r=eyJrIjoiZTkyODcyOTEtZjA5YS00ZmI0LWFkZGUtODIxNGI5OTE3YjM0IiwidCI6ImY2MTBjMGI3LWJkMjQtNGIzOS04MTBiLTNkYzI4MGFmYjU5MCIsImMiOjh9] The excess deaths caused by COVID occurred at different times in different US states but they generally coincided with periods when there was high PCR positivity rate for COVID, so for example in southern states where there were spikes in COVID deaths in the summer, there were also spikes in PCR positivity rate during the summer. [#Excess_deaths_in_southern_US_states_in_summer_2020]

Drug deaths have a fairly uniform distribution throughout the year with few sudden spikes in deaths (except for some reason most states seem to have had an increase in drug deaths in May 2020):

Housatonic also said that the number of COVID deaths in the United States was approximately equal to the number of excess deaths, so he was wondering what happened to the excess drug-related deaths. However according to OWID's data for the United States, there's about 1.08 million COVID deaths in 2020-2022 but about 1.25 million excess deaths. [https://ourworldindata.org/grapher/cumulative-excess-deaths-covid?time=earliest%2e%2e2023-01-01&country=%7eUSA] And in a dataset for excess deaths published by the CDC, on weeks ending in 2020-2022, there's about 1.32 million excess deaths based on the reported data, and there's about 1.61 million excess deaths based on the weighted data, which uses Farrington surveillance algorithms to account for deaths that are missing because of a registration delay: [https://www.cdc.gov/nchs/nvss/vsrr/covid19/excess_deaths.htm]

$ curl https://data.cdc.gov/api/views/xkkf-xrst/rows.csv>cdcexcess.csv
$ awk -F, '$2=="United States"&&$10>=2020&&$10<=2022&&$11=="Unweighted"{x+=$7}END{print x}' cdcexcess.csv
1321738
$ awk -F, '$2=="United States"&&$10>=2020&&$10<=2022&&$11=="Predicted (weighted)"{x+=$7}END{print x}' cdcexcess.csv
1605221

Couey posted this tweet: [https://x.com/jjcouey/status/1765439564770934814]

However in the second quarter of 2020, there were about 6000 excess drug deaths relative to the pre-COVID trend but about 50 times as many COVID deaths:

Paper about using Remdesivir to treat emerging betacoronaviruses

Housatonic did a video about a paper published in March 2019 where one author was Baric's postdoc student and the other author was Sina Bavari. [https://pubmed.ncbi.nlm.nih.gov/30849247/] He said: "We should see that Ralph Baric's last postdoc student actually co-authored a document called Broad-Spectrum coronavirus antiviral drug discovery, which was published in early 2019, which actually says very specifically that GS-5734 from Gilead - Remdesivir - is the most likely thing to work against a novel coronavirus that causes a global pandemic spilling out of Asia, probably China via a wet market after jumping off of a bat or camel. This document is the smoking gun of the entire pandemic." [https://www.bitchute.com/video/VFwl1v6YJC2O/, time 4:27]

The authors of the paper may have well had foreknowledge of the COVID pandemic. However the paper doesn't say anything about a pandemic emerging in Asia or likely China. The only part of the paper which mentions China is a sentence which says that "SARS-CoV emerged in the Guangdong province of southeastern China in late 2002". And the paper doesn't even mention wet markets apart from saying that "SARS-CoV was detected in small animals like civets and raccoon dogs that were present in live-animal markets". And the paper doesn't say that there would be a global pandemic caused by a coronavirus that came from a bat or camel, but it just described the official story about the origins of SARS1 and MERS.

The paper did say that bat sarbecoviruses and merbecoviruses are called "pre-emergent" because they have the potential to emerge into human populations: "Recent studies suggest that BatCoV-SHC014 and BatCoV-WIV1 are genetically similar to SARS-CoV and enter cells using human receptors [10,15,16]. Similarly, BatCoV-HKU4 and BatCoV-HKU5 are MERS-like BatCoVs that may also be circulating in bat populations, and some MERS-like BatCoVs may also be able to recognize human host cell receptors [17-19]. Such BatCoVs are now called 'pre-emergent', because they may have the potential to emerge into human populations." (HKU4 and HKU5 are merbecoviruses and not sarbecoviruses like HKU3.)

The paper was about an antiviral drug for treating emerging betacoronaviruses in humans, so it made sense for the authors to describe previous human epidemics that were caused by betacoronaviruses. And just because the official story about the origins of SARS2 shared some features in common with the official story about the origins of SARS1 and MERS, and because the authors of the paper described the official story about the origins of SARS1 and MERS, it doesn't mean that the authors were able to predict COVID.

People are often also saying that the virus in the Event 201 scenario originated in China or that it originated on a wet market, even though actually it originated on pig farms in Brazil. Or people are saying that the virus in the Lock Step scenario was a coronavirus or that it originated in China, even though actually it was an influenza virus and its country of origin was not specified.

Using world population estimates to determine the death toll of the Spanish flu

Housatonic said: "If you look at world population charts - which are compiled from many data sources - if you look at it between the year 1918 and 1919, you just will not see any world population decrease. Matter of fact, it goes up. It goes up at the same rate it did the year before and the year after, more or less. And unless there was an unexplained one-time 25 to 50 million baby boom worldwide, in addition to expected birth rates, that would not be the case if the 1918 Spanish narrative really was 25, 50, 100 million dead people. So it's several hundred thousand, maybe a couple million worldwide. And it was, to the best of what I can see, a bacterial infections, which were spread because of the nature of World War I." [https://www.youtube.com/watch?v=x2epaylZzwQ&t=4m20s]

I agree that the number of deaths caused by the Spanish flu might well be in the millions and not tens of millions (unless you include deaths that were caused by descendants of the Spanish flu strain of H1N1, because they remained in circulation up to the 1950s).

But anyway, spikes in deaths caused by the Spanish Flu are not necessarily visible in the world population estimates, because many countries only have projected data, or the data is interpolated from censuses which are performed every 1 to 3 decades so that single-year spikes in deaths between censuses get smoothed out.

The countries in the plot below were some of the most developed countries 100 years ago, but even Russia just has a smooth interpolated curve before the 1950s that has no dent in deaths after WW2 or the Russian Civil War. But even the Russian Civil War is estimated to have resulted in about 7-12 million deaths, so the interpolated population estimates might similarly be hiding a large number of deaths caused by the Spanish flu:

The first and only census of the Russian Empire was performed in 1897, but after that the first Soviet census was only performed 29 years later in 1926 (but it could be that neither census is even incorporated in the data from GapMinder I used).

GapMinder's estimates are based on modern-day national boundaries, but it might be difficult to match old census data to modern-day national boundaries, because for example at the time of the Russian Empire, about 10% of the population of the Grand Duchy of Finland lived within the borders of modern-day Russia, and the 1897 census might not include population estimates within different regions of the Grand Duchy of Finland.

However for example Sweden didn't take part in WW1, but they still had a massive spike in reported deaths in 1918: [https://twitter.com/KoudijsHenk/status/1706571015415898465/photo/3, original source unknown]

Jikkyleaks

Jikky the Mouse might belong to a kind of "no-pandemic-lite" camp because he says that some people were killed by the virus, so I don't know if he should be included on this page, but he still promotes many of the same theories as the no-pandemicists. [https://arkmedic.substack.com/p/there-was-no-virus] In December 2022 he was one of the first big names in the COVID conspiratard movement who started promoting Couey's Scooby Doo clone theory, and he published a Substack post where he wrote: "There was never a pandemic of any lethal virus. The sequences made by Baric, Daszak, Shi and their buddies in virology labs around the world are viral sequences of RNA, but they are synthetic. They can be effectively distributed via clones (lab based production of RNA sequences) rather than letting an unstable real-life RNA coronavirus loose on the world, which would likely regress and flop as a bioweapon. What they proposed (a scary novel lethal coronavirus causing a pandemic) is nigh on impossible, but the scare was real." [https://arkmedic.substack.com/p/it-doesnt-matter]

Twitter thread from 2020 about Johns Hopkins COVID dashboard

Jikky said this about a Twitter thread from 2020 by a user named Jockthedog2: "Still one of the most important threads on twitter. If you haven't seen it, you're about 3 years late but it's time to catch up." [https://x.com/Jockthedog2/status/1333502166829502465] He also linked the thread in a Substack post where he wrote: "A very interesting thread on twitter explains all about the origins of the Johns Hopkins dashboard run by Lauren Gardner - whose expertise was in data synthesis - and why the numbers that underpin it are almost certainly synthetic, originating via China." Jikky also wrote: "I'll help you. Because the JHU dashboard used synthetic data generated by Ensheng Dong via DXY in China. The Chinese synthesised this data in order to create a scenario where the world was driven into lockdown whilst mainland China opened up, giving them the only GDP growth in the world in 2020." [https://arkmedic.substack.com/p/there-was-no-virus/comment/42183879]

One tweet in the thread said: "On the dashboard you'll see that numbers are constantly increasing within a few minutes. While it is claimed the dashboard is fetched from the above GitHub repository, the repository does not change that often - in fact, on many days there is a single update of raw data." However when someone at GitHub asked what the source of the live data was because it was more up-to-date than the data at GitHub, another user linked to a page at ArcGIS which showed each individual update to the live data. [https://github.com/CSSEGISandData/COVID-19/issues/385, https://www.arcgis.com/home/item.html?id=c0b356e20b30490c8b8b4c7bb9554e7c#data] And also I didn't find any place where JHU claimed that their live data was fetched from GitHub. But the JHU's FAQ says that their world map was updated hourly but data at their GitHub was only updated daily: "The map is updated on an hourly basis throughout the day. The time of the latest update is noted on the bottom of the dashboard. The GitHub database updates daily between 04:45 and 05:15 GMT." [https://coronavirus.jhu.edu/map-faq]

The author of the Twitter thread was wondering why JHU would use data from the Chinese website DXY. But it might be because DXY had province-level data for China or because they published Chinese data earlier than other sources. A paper by the developers of the JHU dashboard said: "Our primary data source is DXY, an online platform run by members of the Chinese medical community, which aggregates local media and government reports to provide cumulative totals of COVID-19 cases in near real time at the province level in China and at the country level otherwise." [https://europepmc.org/article/PMC/7159018] The reason why they wrote that DXY was their primary source may have been because the paper was published on February 19th 2020, when China accounted for 74,278 out of 74,770 cumulative COVID cases worldwide according to OWID. On a list of sources in a README file at JHU's GitHub repository, DXY is now listed on third place after the WHO and the European CDC, even though the sources are probably not listed in the order of importance since a note next to the list says that ECDC was "not currently relied upon as a source of data". [https://github.com/CSSEGISandData/COVID-19/]

In the Twitter thread about the JHU dashboard, Jockthedog2 asked: "How would anyone at DXY have up-to-date numbers for, say, Portugal? Or Belize? Or Argentina? Numbers that are supposedly more accurate than the official figures from those countries' governments?" However in a README file at JHU's GitHub repository, there's a list of over a hundred different data sources in addition to DXY, and the source for data from Portugal was listed as the Portuguese "General Directorate of Health" until 2022 but WHO afterwards. [https://github.com/CSSEGISandData/COVID-19/]

In the Twitter thread by Jockthedog2, he also linked to a GitHub issue where the someone pointed out that in a CSV file for the daily cumulative number of cases published by the JHU, the number of cases for New South Wales didn't match the figures listed at health.nsw.gov.au, because for example on March 7th there were 28 instead of 36 cases listed. [https://github.com/CSSEGISandData/COVID-19/issues/426] However it might be because in a CSV file at JHU's GitHub, the date when the data for NSW was updated is listed as 2020-03-07T02:03:30, but New South Wales follows the time zone UTC+10/11, so JHU's CSV file may have been missing half a day's worth of cases. [https://github.com/CSSEGISandData/COVID-19/blob/master/csse_covid_19_data/csse_covid_19_daily_reports/03-07-2020.csv] In an epidemiology report published by the Australian government, there's 33 cumulative cases listed up to March 7th but they only include cases up to 19:00 AEDT (8:00 UTC). [https://www1.health.gov.au/internet/main/publishing.nsf/Content/novel_coronavirus_2019_ncov_weekly_epidemiology_reports_australia_2020.htm] So the reason for some of these discrepancies in the daily case numbers might be that local authorities sometimes publish their reports at the end of the working day and not at the end of the day, or that JHU's CSV files at GitHub are in UTC but data reported by local authorities is usually in a local time zone. In the GitHub issue about the discrepancy in the case numbers for NSW, the case number from health.nsw.​gov.​au for each day is always somewhere inclusively between the numbers listed by the JHU for the current day and the next day.

Jockthedog2 linked to an issue at GitHub which pointed out that the cumulative number of cases in Japan was 25 on February 5th, 45 on February 6th, and 25 on February 7th, so the cumulative number of cases fell by 20 on February 7th. [https://github.com/CSSEGISandData/COVID-19/issues/33] However I found a pull request about the same issue, where someone replied: "If I remember correctly, the first batch of infections on the Diamond Princess was counted to be part of 'Japan' prior to it being split out. This article on evening of Feb 6th (JST) mentions the total (at that time) on the cruise of 20 known infections. Regardless would be good to remove this from the JP timeline, and ensuring it is counted in the Others aggregate." [https://github.com/CSSEGISandData/COVID-19/pull/89] In a README file at the JHU's GitHub repository, there's also the following entry under March 1st 2020: "Diamond Princess| All cases of COVID-19 in repatriated US citizens from the Diamond Princess are grouped together, and their location is currently designated at the ship's port location off the coast of Japan. These individuals have been assigned to various quarantine locations (in military bases and hospitals) around the US. This grouping is consistent with the CDC." [https://github.com/CSSEGISandData/COVID-19/blob/master/csse_covid_19_data/README.md]

If the JHU's case numbers were simulated like Jockthedog2 and Jikky suggested, then why do the the case numbers match the numbers published in other sources? For example in the Europe CDC's situation report for February 1st which includes the EEA and UK, there's 7 cases listed in Germany, 6 in France, 2 in Italy and UK, and 1 in Finland, Spain, and Sweden. [http://web.archive.org/web/20200201140459/https://www.ecdc.europa.eu/en/cases-2019-ncov-eueea] JHU's figures for February 1st are otherwise identical except there's 8 instead of 7 cases in Germany. https://github.com/CSSEGISandData/COVID-19/blob/master/csse_covid_19_data/csse_covid_19_daily_reports/02-01-2020.csv] However it might be because JHU included cases from some other source besides ECDC or because JHU's data was updated later than ECDC's data. The CSV file published by the JHU says that their data for Germany was updated on 18:33 UTC, but the page on Europe CDC's website is titled "Situation update 1 February 14:00". The 8th COVID case in Germany was reported on February 1st in Bavaria. [https://en.wikipedia.org/wiki/COVID-19_pandemic_in_Germany#Bavaria] On the website of the Bavarian health ministry, there's a press release about the case which said in German that "there are currently (as of 6 PM) a total of eight known coronavirus cases in Bavaria". [https://www.stmgp.bayern.de/presse/aktuelle-informationen-zur-coronavirus-lage-in-bayern-bayerisches-gesundheitsministerium-8/] From the source code of the website you can see that the press release has the timestamp 2020-02-01T00:59:59+02:00, but other press releases on the website also have a timestamp that ends with 00:59:59+02:00 so it's probably just used as the default time for articles with a date-only timestamp. So if the press release by the Bavarian health ministry was published at 6 PM in UTC+1, then it would've been published after the ECDC's daily report but before the JHU's daily data at GitHub was updated.

Jockthedog2 made it seem like the JHU's COVID dashboard was some kind of a CCP-controlled operation because many of their programmers were Chinese. But it might have something to do with how in the 2023 International Mathematical Olympiad, the six members of the US team were named Lin, Liu, Lu, Shen, Wang, and Zhao. [https://www.imo-official.org/team_r.aspx?code=USA&year=2023] And at the 2022 International Olympiad in Informatics, the members of the US team were named Chen, Feng, Jiang, and Zhang. [http://www.usaco.org/] In a paper by Davide Piffer where he calculated polygenic scores for human populations based on the frequency of alleles associated with educational attainment, out of populations at 1000 Genomes, Han Chinese from Shangai ranked first with a score about 1.61 SDs above average, but the score of US whites was only about 0.76 SDs above average. [https://www.researchgate.net/publication/332076417_Evidence_for_Recent_Polygenic_Selection_on_Educational_Attainment_and_Intelligence_Inferred_from_Gwas_Hits_A_Replication_of_Previous_Findings_Using_Recent_Data]

When Jikky asked me if the JHU continued to manually add individual cases based on news items and social media posts even in spring 2020 when there was a large number of new cases, I pointed out that the first paper about the JHU dashboard from February 2020 said: "To identify new cases, we monitor various Twitter feeds, online news services, and direct communication sent through the dashboard." But the second paper from August 2022 said: "As the virus spread internationally, data were manually sourced and validated from a mix of official and aggregate sources, including 1Point3Acres, BNO news, Worldometers.info, local news reporting, and social media posts from governments and health authorities. Eventually, governments and health authorities established public bodies for reporting epidemic data within their jurisdictions, which replaced ad hoc sourcing as they became available." [https://www.thelancet.com/journals/laninf/article/PIIS1473-3099%2822%2900434-0/fulltext]

In the appendix of the second paper about the JHU dashboard from 2022, the authors also demonstrate challenges that arise from aggregating data that is published in different time zones: "The data collected and reported on the dashboard has to follow a regular time interval to be useful for most data analysis. For this, the dashboard produces graphs and products based on 'per-day' cutoffs, so the daily change in data can be easily tabulated. However, producing a single product for all locations across all time zones has presented challenges in selecting the precise moment for the day cutoff for the generation of the time series and daily report files. The cutoff time was initially chosen as 11:59 PM Greenwich Mean Time (UTC or GMT+0). However, this time occasionally resulted in cases on the West Coast of the United States not being captured, which was viewed as inappropriate for a US-centric data effort. The cutoff time was then extended to 4:00 AM UTC, but this happened to fall right around the update time for the Indian Ministry of Health, resulting in cases sometimes being stale between two updates and double-counting on the next day. Now, all daily products are generated at 5:00 AM UTC. When these changes were implemented, historical data was shifted to reflect this time cut-off for all dates. India, Pakistan, and Mexico still occasionally update shortly after product generation, so our system gives these countries an extra two-hour window in which their updates will be applied to the previous day." [https://ars.els-cdn.com/content/image/1-s2.0-S1473309922004340-mmc1.pdf]

Jikky also asked me: "For instance can you point to the live feed of data from Australia during 2020 that fed the dashboard?" [https://twitter.com/Jikkyleaks/status/1766963648726257908] However in the latest version of the Readme file on JHU's GitHub account, they list two sources for Australia: https://www.health.gov.au/news/coronavirus-update-at-a-glance and https://www.covidlive.com.au/. [https://github.com/CSSEGISandData/COVID-19/blob/master/README.md] The website was added to the README file in April 2020. [https://github.com/CSSEGISandData/COVID-19/tree/765856b3e1e8618effefc7c3acb267af2c79edec] Then Jikky said that the covidlive.com.au website didn't provide live data. But in the case of their website, maybe live data didn't mean that they added individual cases in real time but rather that they added the daily new cases for each region soon after they were published by the region, as you can see from their list of updates: [https://covidlive.com.au/last-updated]

Worldometers also said that their live updates meant that they updated the daily totals for each country throughout the day as new reports were published: "Effective February 1, 2023, the Coronavirus Tracker had switched from LIVE to Daily Updates. As a number of major countries had transitioned to weekly updates, there was no need anymore for immediate updates throughout the day as soon as a new report is released." [https://www.worldometers.info/coronavirus/]

Claim that NYT's dataset for daily COVID cases by county is synthetic

Jikky wrote this about the dataset for daily COVID cases by county that was published by the New York Times: "Sorry but this is junk data with no source. Please show the source case data. This data is synthetic." [https://arkmedic.substack.com/p/there-was-no-virus/comment/42133146]

The CDC has published a CSV file with about 10 million rows where each row contains information about an individual COVID case, including the county of residence. [https://data.cdc.gov/Case-Surveillance/COVID-19-Case-Surveillance-Public-Use-Data-with-Ge/n8mc-b4w4] The file only includes the month of each case and not the day of month. However when I used it to calculate the monthly number of new COVID cases by county, the results were similar to the NYT dataset:

$ curl -s 'https://data.cdc.gov/api/views/n8mc-b4w4/rows.csv'>cases.csv
$ head -n2 cases.csv|csvtk transpose|csvtk pretty|sed 2d
case_month                        2020-08
res_state                         GA
state_fips_code                   13
res_county                        CLAYTON
county_fips_code                  13063
age_group                         65+ years
sex                               Female
race                              NA
ethnicity                         NA
case_positive_specimen_interval
case_onset_interval               0
process                           Missing
exposure_yn                       Missing
current_status                    Laboratory-confirmed case
symptom_status                    Symptomatic
hosp_yn                           Missing
icu_yn                            Missing
death_yn                          Missing
underlying_conditions_yn
$ sed 1d cases.csv|awk -F, '{a[$1" "$5]++}END{for(i in a)print i,a[i]}'>temp
$ wget -q https://raw.githubusercontent.com/nytimes/covid-19-data/master/us-counties-2020.csv
$ sed 1d us-counties-2020.csv|LC_ALL=C sort -t, -k4,4|awk -F, '$4{if($4!=x)prev=0;sub("...$","",$1);a[$1" "$4]+=$5-prev;x=$4;prev=$5}END{for(i in a)print i,a[i]}'>temp2
$ awk 'NR==FNR{a[$1" "$2]=$3;next}{print$0,a[$1" "$2]}' temp{,2}
[...]

The number of cases reported by Johns Hopkins University also matches the NYT dataset. For example in Snohomish County on April 20th, there were 2,162 cumulative cases according to NYT and 2,163 according to JHU:

$ wget -q https://github.com/CSSEGISandData/COVID-19/raw/master/csse_covid_19_data/csse_covid_19_daily_reports/04-20-2020.csv
$ wget -q https://raw.githubusercontent.com/nytimes/covid-19-data/master/us-counties-2020.csv
$ awk 'NR==1||/2020-04-20,Snohomish/' us-counties-2020.csv|column -ts,
date        county     state       fips   cases  deaths
2020-04-20  Snohomish  Washington  53061  2162   96
$ awk 'NR==1||/Snohomish/' 04-20-2020.csv|csvtk pretty|sed 2d
FIPS    Admin2      Province_State   Country_Region   Last_Update           Lat           Long_          Confirmed   Deaths   Recovered   Active   Combined_Key
53061   Snohomish   Washington       US               2020-04-20 23:36:47   48.04615983   -121.7170703   2163        101      0           2062     Snohomish, Washington, US

And the total number of cumulative cases in the US on April 20th was also similar (and the reason why JHU's number of cases was slightly lower might be that JHU's CSV file says that their data for US counties was last updated on 11:36 PM UTC):

$ awk -F, '$4=="US"{x+=$8}END{print x}' 04-20-2020.csv
784790
$ awk -F, '$1=="2020-04-20"{x+=$5}END{print x}' us-counties-2020.csv
784991

However Jikky says that the case data by NYT and JHU are both "synthetic", so was NYT's data copied from JHU or vice versa, or did they just use a similar algorithm to synthesize their case numbers, or did both of them copy their data from a third source? Jikky wrote: "the JHU dashboard used synthetic data generated by Ensheng Dong via DXY in China. The Chinese synthesised this data in order to create a scenario where the world was driven into lockdown whilst mainland China opened up, giving them the only GDP growth in the world in 2020." [https://arkmedic.substack.com/p/there-was-no-virus/comment/42183879] So I guess in his scheme if Enshong Dong or DXY were also responsible for synthesizing JHU's data for the daily number of cases by US county, then the NYT and CDC would've had to copy their data from JHU (even though Jikky didn't specify if Enshong Dong or DXY were responsible for synthesizing all of JHU's data or only some of the data).

Later in another Substack post Jikky wrote: [https://arkmedic.substack.com/p/where-did-the-pandemic-go]

The worldometer site is almost certainly curated by a group of people who use modelling to estimate the figures. During COVID we were told that even in the darkest crevices of Africa we would be getting live health information - this is simply not true (we have written about this on twitter and other places and I will likely do a substack on it in due course).

These sites cannot possibly curate live information on deaths up to the minute. To illustrate this please look at the archive for this worldomoter page.

On the 1st August 2023 the world population was recorded at 8,045,311,447 exactly the same as the world population recorded on 6th Jan 2024.

However if you scroll to the bottom of the page at Worldometers he linked, it says that their source was the 2022 United Nations World Population Prospects dataset, which was published in July 2022. So just because Worldometers don't subtract COVID deaths from the population estimates doesn't imply that they wouldn't have up-to-date information available for COVID deaths.

World population estimates at Worldometers

As evidence that there was no pandemic, Jikky posted these plots of world population estimates at Worldometers: [https://www.arkmedic.info/p/where-did-the-pandemic-go]

Jikky also wrote:

These sites cannot possibly curate live information on deaths up to the minute. To illustrate this please look at the archive for this worldomoter page.

On the 1st August 2023 the world population was recorded at 8,045,311,447 exactly the same as the world population recorded on 6th Jan 2024. Screenshots below.

This is likely to account for why there is no significant "excess deaths" recorded on worldometers for 2022-2023, following the vaccine rollouts, even though has been widely reported in individual countries' statistics. There is no simple way of curating this information for all countries just as there was never any simple way of curating live COVID death figures, and why the person in charge of the Johns Hopkins dashboard was an expert in data modelling.

He linked this page as the source of his statistics: https://www.worldometers.info/world-population/world-population-by-year/. However at the bottom of the page, it says that the source of the world population estimates was the 2022 UN World Population Prospects dataset. So the reason why the numbers haven't changed between 2023 and 2024 is because they're taken from a dataset that was published in 2022.

However just because Worldometers uses one old dataset somewhere on their website doesn't mean that they couldn't have aggregated up-to-date information for COVID deaths.

The World Population Prospects dataset was published in July 2022, but UN's website seems to indicate that the dataset uses modeled data from January 2022 onwards: "In the 2022 revision, the figures from 1950 up to 2021 are treated as estimates, and thus the projections for each country or area begin on 1 January 2022 and extend until 2100. Because population data are not necessarily available for that date, the 2022 estimate is derived from the most recent population data available for each country, obtained usually from a population census or a population register, projected to 2022 using all available data on fertility, mortality and international migration trends between the reference date of the population data available and 1 January 2022." [https://population.un.org/wpp/Methodology/] The same page also says: "For 74 countries or areas, the most recent available population count was from the period 2005-2014. For the remaining 11 countries or areas, the most recent available census data were from before 2005."

However I guess some of the data from 2022 is based on actual reported mortality in 2022, because for example Ukraine has a 38% increase in CMR between 2021 and 2022 in the WPP dataset. [stat.html#Plot_percentage_change_in_yearly_crude_mortality_rate] And Hong Kong also has a 16% increase in CMR from 2021 to 2022 (because Hong Kong had almost no COVID deaths until 2022, but they had about 170% excess mortality in March 2022 according to OWID).

Nick Hudson

Quote from a censored PANDA presentation

In 2024 Nick Hudson published a video which had been recorded in 2022 but which he hadn't published earlier because the chicks in the video didn't go along with his agenda that there was no pandemic. He highlighted this sentence by Jennifer Smith: "One of the myths that was perpetuated over the last few years is that SARS-CoV-2 was a novel coronavirus, something we haven't seen before, and that is false."

However right after that part she also said that SARS2 "has over 90% genome identity so it is similar to SARS1", which was also mentioned in the slides of the talk.

However actually if you compare the reference genomes of SARS1 and SARS2, they have about 80.0% nucleotide identity if positions where either sequence has a gap are ignored, or about 78.9% if not:

$ curl 'https://eutils.ncbi.nlm.nih.gov/entrez/eutils/efetch.fcgi?db=nuccore&rettype=fasta&id=MN908947,NC_004718'|mafft --quiet --thread 4 -|seqkit seq -s|awk 'NR==1{split($0,a,"");l=length;next}{split($0,b,"");for(i=1;i<=l;i++){if(a[i]!="-"&&b[i]!="-"){n++;if(a[i]!=b[i])d++};if(a[i]!=b[i])d2++}print (1-d/n)*100,(1-d2/l)*100}'
79.9548 78.9479

So if she made such a basic mistake, then maybe she wasn't qualified to decide if SARS2 was a novel virus or not. (But Hudson was still willing to quote her as long as she said something that supported his agenda, even though Smith said that the point of their presentation was to debunk other people at PANDA who were downplaying the importance of the virus, which might also explain why their presentation remained unpublished.)

Smith said that she may have gotten the figure of over 90% identity from a paper which included this paragraph: "CoVs have the largest RNA viral genome, ranging from 26 to 32 kb in length [11]. The SARS-CoV-2 genome share about 82% sequence identity with SARS-CoV and MERS-CoV and >90% sequence identity for essential enzymes and structural proteins. This high level of the sequence revealed a common pathogenesis mechanism, thus, therapeutic targeting. Structurally, SARS-CoV-2 contains four structural proteins, that include spike (S), envelope (E), membrane (M), and nucleocapsid (N) proteins. These proteins share high sequence similarity to the sequence of the corresponding protein of SARS-CoV, and MERS-CoV." [https://www.ncbi.nlm.nih.gov/pmc/articles/PMC7293463/]

The E, N, and M proteins of Tor2 have over 90% amino acid identity to Wuhan-Hu-1. But the authors of the paper made a big error when they wrote that SARS2 had about 82% sequence identity to MERS, even though actually the reference genomes of MERS and SARS2 have only about 57% identity if you ignore positions where either sequence has a gap or about 50% if you don't:

$ curl 'https://eutils.ncbi.nlm.nih.gov/entrez/eutils/efetch.fcgi?db=nuccore&rettype=fasta&id=MN908947,NC_019843'|mafft --quiet --thread 4 -|seqkit seq -s|awk 'NR==1{split($0,a,"");l=length;next}{split($0,b,"");for(i=1;i<=l;i++){if(a[i]!="-"&&b[i]!="-"){n++;if(a[i]!=b[i])d++};if(a[i]!=b[i])d2++}print (1-d/n)*100,(1-d2/l)*100}'
57.3859 49.7232

And another error in the same pargagraph was when it said that "CoVs have the largest RNA viral genome", because actually some non-coronavirus nidoviruses have longer genomes:

$ curl ftp://ftp.ncbi.nlm.nih.gov/entrez/entrezdirect/install-edirect.sh|sh
[...]
$ esearch -db nuccore -query '"Riboviria"[Organism] AND refseq[filter]'|efetch -format fasta>riboviridae.fa
$ seqkit fx2tab riboviridae.fa|awk -F\\t '{print length($2),$1}'|sort -nr|head
41178 NC_040361.1 Planarian secretory cell nidovirus isolate UIUC, complete genome
36652 NC_076697.1 MAG: Pacific salmon nidovirus isolate H14 ORF1a polyprotein (QKQ71_gp1), ORF1b polyprotein (QKQ71_gp2), LAP1C-like protein (QKQ71_gp3), spike protein (QKQ71_gp4), envelope (QKQ71_gp5), membrane protein (QKQ71_gp6), and nucleoprotein (QKQ71_gp7) genes, complete cds
36144 NC_076911.1 Veiled chameleon serpentovirus B, complete sequence
35906 NC_040711.1 Aplysia californica nido-like virus isolate EK, complete genome
33452 NC_024709.1 Ball python nidovirus strain 07-53, complete genome
32753 NC_076657.1 Morelia viridis nidovirus isolate BH171/14-7, complete genome
32399 NC_035465.1 Morelia viridis nidovirus strain S14-1323_MVNV, complete genome
31686 NC_010646.1 Beluga Whale coronavirus SW1, complete genome
31537 NC_076912.1 Veiled chameleon serpentovirus A, complete sequence
31526 AC_000192.1 Murine hepatitis virus strain JHM, complete genome

Claim that COVID did not spread outside of Wuhan in China

Hudson wrote: "Finally, since Covid did not spread out of Wuhan despite five million travellers to other Chinese provinces (a 'super-spreader' event of epic proportions), we find no reason to think that it spread out of Wuhan to other countries either." [https://twitter.com/NickHudsonCT/status/1762827354424959451] He also wrote: "A key finding is that there was no sign of spread (cluster and ripple effects) in the data. Testing was into an existing positive base."

However in a nearly complete set of GISAID submissions with a collection date in 2020, there's 1,183 submissions where the country is listed as China and the collection date is in March 2020 or earlier, but the province is listed as Hubei in only 332 submissions:

$ curl -Ls sars2.net/f/gisaid2020.tsv.xz|xz -dc>gisaid2020.tsv
$ awk -F\\t '$4<="2020-03"&&$6=="China"{a[$7]++}END{for(i in a)print a[i],i}' gisaid2020.tsv|sort -rn
332 Hubei
143 Guangdong
99 Shanghai
91 Anhui
90 Sichuan
79 Shandong
51 Zhejiang
47 Beijing
44 Guangzhou
42 Jiangxi
34 Hangzhou
23 Henan
19 Jiangsu
19 Hebei
14 Wuhan
11 Guangxi
10 Shaanxi
9 Yunnan
7 Hunan
7
3 Meizhou
3 Fujian
3 Chongqing
2 Jining
1 Gansu

For example there's a descendant of proCoV2 from the city of Hefei in Anhui with a collection date on March 4th. It has 7 mutations from Wuhan-Hu-1. Its closest possible ancestor samples have a subset of 5 of the mutations and they're also from the same city but they have an earlier collection date. But there's no other samples which would have a subset of 4 or more of the mutations and no other mutations from Wuhan-Hu-1:

$ tab()(awk '{if(NF>m)m=NF;for(i=1;i<=NF;i++){a[NR][i]=$i;l=length($i);if(l>b[i])b[i]=l}}END{for(h in a){for(i=1;i<=m;i++)printf(i==m?"%s\n":"%-"(b[i]+n)"s",a[h][i])}}' "${1+FS=$1}" "n=${2-1}")
$ awk -F\\t 'NR==FNR{a[$0];next}!$19{n=0;split($12,b,",");for(i in b){if(b[i]in a)n++;else next}print n FS$0}' <(tr , \\n<<<C4703A,C8782T,G11083T,C16946T,C18060T,T28144C,C28887T) gisaid2020.tsv|cut -f1,2,3,5,7-9,13|sort -rn|head|tab \\t
7 EPI_ISL_16138283 hCoV-19/Anhui/932/2020                2020-03-04 China   Anhui       Hefei     C4703A,C8782T,G11083T,C16946T,C18060T,T28144C,C28887T
5 EPI_ISL_16138306 hCoV-19/Anhui/425-2/2020              2020-02-11 China   Anhui       Hefei     C4703A,C8782T,G11083T,C18060T,T28144C
5 EPI_ISL_16138288 hCoV-19/Anhui/839/2020                2020-02-27 China   Anhui       Hefei     C4703A,C8782T,G11083T,C18060T,T28144C
3 EPI_ISL_855195   hCoV-19/USA/NY-WCM-0461-1-N/2020      2020-03-15 USA     New York              C8782T,C18060T,T28144C
3 EPI_ISL_671375   hCoV-19/Ireland/KE-NVRL-20G27987/2020 2020-03-20 Ireland Kerry                 C8782T,C18060T,T28144C
3 EPI_ISL_596386   hCoV-19/USA/WA-NIH-WA1/2020           2020-01-19 USA     Washington            C8782T,C18060T,T28144C
3 EPI_ISL_522942   hCoV-19/Mexico/CMX-INMEGEN-12/2020    2020-08-06 Mexico  Mexico City           C8782T,C18060T,T28144C
3 EPI_ISL_493171   hCoV-19/Wuhan/0126-C13/2020           2020-01-26 China   Hubei       Wuhan     C8782T,C18060T,T28144C
3 EPI_ISL_444526   hCoV-19/USA/IL-NM016/2020             2020-03-15 USA     Illinois    Chicago   C8782T,C18060T,T28144C
3 EPI_ISL_428449   hCoV-19/Guangdong/20SF123/2020        2020-01-20 China   Guangdong   Zhanjiang C8782T,C18060T,T28144C

There's also another descendant of proCoV2 from the province of Shangdong which has 10 mutations from Wuhan-Hu-1. Its collection date is listed as February 6th. Its closest possible ancestor is also from Shangdong and it has a collection date 4 days earlier, but it has no other possible ancestors with more than 3 mutations from Wuhan-Hu-1:

$ awk -F\\t 'NR==FNR{a[$0];next}!$19{n=0;split($12,b,",");for(i in b){if(b[i]in a)n++;else next}print n FS$0}' <(tr , \\n<<<C8782T,C18060T,G25621T,T28144C,T29709A,G29711A,A29713G,T29867G,A29872T,A29875G) gisaid2020.tsv|cut -f1,2,3,5,7-9,13|sort -rn|head -n4|tab \\t
10 EPI_ISL_962560 hCoV-19/Shandong/2020C1240312/2020    2020-02-06 China   Shandong  C8782T,C18060T,G25621T,T28144C,T29709A,G29711A,A29713G,T29867G,A29872T,A29875G
8  EPI_ISL_962582 hCoV-19/Shandong/2020C1240070/2020    2020-02-02 China   Shandong  C8782T,T28144C,T29709A,G29711A,A29713G,T29867G,A29872T,A29875G
3  EPI_ISL_855195 hCoV-19/USA/NY-WCM-0461-1-N/2020      2020-03-15 USA     New York  C8782T,C18060T,T28144C
3  EPI_ISL_671375 hCoV-19/Ireland/KE-NVRL-20G27987/2020 2020-03-20 Ireland Kerry     C8782T,C18060T,T28144C

And if the virus had been circulating a long time before testing started, then why are there no Chinese GISAID submissions from the first half of 2020 that have more than 30 mutations from Wuhan-Hu-1? Did they disappear in the same way that pre-Omicron strains mostly disappeared after the emergence of Omicron?

In a study which analyzed nearly all COVID patients admitted to a hospital in Shanghai up to September 2020, by March-April 2020 about 99% of all cases were in patients who were considered to have been infected outside of China: [https://academic.oup.com/ve/advance-article/doi/10.1093/ve/veae020/7619252]

We recruited nearly all clinically diagnosed and laboratory confirmed COVID-19 patients admitted to the Shanghai Public Health Clinical Center during January 20th to September 17th, 2020, including the first case (a male) who was diagnosed in Shanghai on January 20th, 2020 and from Wuhan (Supplementary Table 1). These patients included 553 males and 380 females, with a median age of 36.00 years.

Based on the admission dates of these patients, the whole study period was divided into three stages: stage I was from January 20th to February 29th, 2020; stage II from March 1st to CCEPTED MANUSCRIPT April 30th; and stage III from May 1st to September 30th (Fig. 1A). Of these 327 patients appeared during the stage I, 266 cases were infected domestically, 32 cases were diagnosed within 1-22 days after returning or coming from abroad, but the remaining 29 cases had no clear epidemiological records (Fig. 1B, Table 1). For domestic infections, 88 patients were infected in Shanghai, while 152 patients were from or had a travelling history to Wuhan (130) Hubei province (22), and 26 patients were from or had a travelling history to other 12 Chinese provinces. During the stage II, 302 (99.01%) cases were imported cases, who came or returned from abroad, mainly from Europe (231), while only three cases were infected domestically (Table 1, Supplementary Fig. 1). Similarly, during the stage III, in addition to five domestical infections, 296 cases were infected outside of China, mainly from Asian countries and regions (Table 1, Supplementary Fig. 1). The epidemiological and clinical

On GISAID there's a similar shift to strains with a foreign origin by March-April 2020. For example for the sample hCoV-19/Beijing/DT-travelES02/2020 which has a collection date on March 12th, the closest potential ancestor samples are all from the city of Elche in Spain:

$ grep travelES gisaid2020.tsv|cut -f1-8,11-12|tr \\t \|
EPI_ISL_452345|hCoV-19/Beijing/DT-travelES03/2020|2020-05-27|2020-03-07|B.1|China|Beijing||7|C241T,C3037T,C14408T,A20268G,C20897T,T20901C,A23403G
EPI_ISL_452344|hCoV-19/Beijing/DT-travelES02/2020|2020-05-27|2020-03-12|A.2|China|Beijing||8|C203T,T8395A,C14805T,A22151G,G25979T,T28144C,C28657T,C28863T
EPI_ISL_452343|hCoV-19/Beijing/DT-travelES01/2020|2020-05-27|2020-03-16|B.1|China|Beijing||3|C241T,C3037T,A23403G
EPI_ISL_452346|hCoV-19/Beijing/DT-travelES04/2020|2020-05-27|2020-03-19|B.1|China|Beijing||10|C241T,C3037T,T8022G,C14408T,A20268G,A23403G,A24389C,G24390C,G29473A,G29734C
$ awk -F\\t 'NR==FNR{a[$0];next}!$19{n=0;split($12,b,",");for(i in b){if(b[i]in a)n++;else next}print n FS$0}' <(tr , \\n<<<C203T,T8395A,C14805T,A22151G,G25979T,T28144C,C28657T,C28863T) gisaid2020.tsv|cut -f1,2,3,5,7-9,13|sort -rn|head|tr \\t \|
8|EPI_ISL_452344|hCoV-19/Beijing/DT-travelES02/2020|2020-03-12|China|Beijing||C203T,T8395A,C14805T,A22151G,G25979T,T28144C,C28657T,C28863T
4|EPI_ISL_4275027|hCoV-19/Spain/VC-IBV-99035052/2020|2020-03-13|Spain|Comunitat Valenciana|Elche|C14805T,G25979T,T28144C,C28657T
3|EPI_ISL_4275067|hCoV-19/Spain/VC-IBV-99035093/2020|2020-03-20|Spain|Comunitat Valenciana|Elche|T28144C,C28657T,C28863T
3|EPI_ISL_4275022|hCoV-19/Spain/VC-IBV-99035047/2020|2020-03-13|Spain|Comunitat Valenciana|Elche|G25979T,T28144C,C28657T
2|EPI_ISL_4275076|hCoV-19/Spain/VC-IBV-99035102/2020|2020-03-21|Spain|Comunitat Valenciana|Elche|T28144C,C28657T
2|EPI_ISL_4275047|hCoV-19/Spain/VC-IBV-99035072/2020|2020-03-18|Spain|Comunitat Valenciana|Elche|T28144C,C28657T
1|EPI_ISL_512773|hCoV-19/Meizhou/Meizhou-1/2020|2020-01-31|China|Meizhou||T28144C
1|EPI_ISL_500814|hCoV-19/England/SWG-MAR-nPCR2.1/2020|2020-03-11|United Kingdom|England||C14805T
1|EPI_ISL_454973|hCoV-19/Wuhan/HB-WH5-229/2020|2020-02-22|China|Hubei|Wuhan|T28144C
1|EPI_ISL_454919|hCoV-19/Wuhan/HB-WH1-143/2020|2020-02-03|China|Hubei|Wuhan|T28144C

The sample below from the city of Hefei has 7 mutations from Wuhan-Hu-1. Its closest possible ancestor strains have 4 mutations and they're all from Hefei but they have slightly earlier collection dates. But it doesn't have any other possible ancestors with more than 2 mutations:

$ awk -F\\t '$6=="China"&&$10=="Human"&&$11==7&&$4>="2020-02-01"' gisaid2020.tsv|sed -n 10p|cut -f12|tr , \\n|awk -F\\t 'NR==FNR{a[$0];next}!$19{n=0;split($12,b,",");for(i in b){if(b[i]in a)n++;else next}print n FS$0}' - gisaid2020.tsv|cut -f1,2,3,5,7-9,13|sort -rn|head|ra2
7|EPI_ISL_16138307|hCoV-19/Anhui/396/2020|2020-02-10|China|Anhui|Hefei|G5558A,G9479T,G11083T,T14418A,A17614G,A18253T,C26885T
4|EPI_ISL_16138319|hCoV-19/Anhui/241/2020|2020-02-06|China|Anhui|Hefei|G11083T,T14418A,A17614G,C26885T
4|EPI_ISL_16138312|hCoV-19/Anhui/363/2020|2020-02-09|China|Anhui|Hefei|G11083T,T14418A,A17614G,C26885T
4|EPI_ISL_16138311|hCoV-19/Anhui/364/2020|2020-02-09|China|Anhui|Hefei|G11083T,T14418A,A17614G,C26885T
1|EPI_ISL_728208|hCoV-19/Japan/FHU-CS84-0228/2020|2020-02-28|Japan|Aichi||G11083T
1|EPI_ISL_728206|hCoV-19/Japan/FHU-CS24-0227/2020|2020-02-27|Japan|Aichi||G11083T
1|EPI_ISL_728155|hCoV-19/Japan/FHU-CS84-0222/2020|2020-02-22|Japan|Aichi||G11083T
1|EPI_ISL_728000|hCoV-19/Japan/FHU-CS56-0221/2020|2020-02-21|Japan|Aichi||G11083T
1|EPI_ISL_727999|hCoV-19/Japan/FHU-CS29-0221/2020|2020-02-21|Japan|Aichi||G11083T
1|EPI_ISL_727998|hCoV-19/Japan/FHU-CS27-0221/2020|2020-02-21|Japan|Aichi||G11083T

Hugh Akston

Claim that there was no excess mortality outside the NYC tri-state area in spring 2020

Akston posted this tweet: [https://x.com/ProfessorAkston/status/1742034871969575061]

However I pointed out that many counties in southern states had over 100% excess mortality in April 2020, and there were even some counties that already had around 100% excess mortality in March:

He answered: "The subdivision alone will create areas of 'statistical significance' with no underlying causal effects. One needs a long time-line prior to any intervention to gain a sense of just random variability." However I included all months of 2019 in my heatmap above for comparison to show that there was no month with over 32% excess mortality in 2019. And I also pointed out that many of the same southern counties also had high COVID deaths per capita in spring 2020:

I also pointed out that in the CDC's dataset for excess deaths, Louisiana had about 69% excess mortality on the week ending April 11th 2020. And the spike in deaths was preceded by a spike in PCR positivity rate by about 2 weeks: [https://www.cdc.gov/nchs/nvss/vsrr/covid19/excess_deaths.htm, https://healthdata.gov/dataset/COVID-19-Diagnostic-Laboratory-Testing-PCR-Testing/j8mb-icvb]

In fact Louisiana was one of the states with the highest PCR positivity rate in March 2020:

Deaths classified under unspecified coronavirus at CDC WONDER

Akston posted this tweet: [https://twitter.com/ProfessorAkston/status/1778214083646415288]

This is not rocket science.

A chart of CDC "unspecified coronavirus" mortality elevates w/ GoF, along w/ likely embedded coronavirus mortality in the sustained, vaxx-refractory influenza mortality.

This wasn't COVID-19.

That crap has been leaking for a dozen years.

@RandPaul

However I think the ICD code for "Coronavirus infection, unspecified" (B34.2) includes known human coronaviruses like 229E, NL63, OC43, and HKU1, because they don't seem to have their own ICD codes, but there's only an ICD code for SARS1. And maybe testing for coronaviruses had become more common in the years before COVID.

I asked Google Gemini: "what ICD codes are used for human coronaviruses like 229E, NL63, OC43, and HKU1". But it answered:

There are two main ICD-10 codes used for human coronaviruses depending on the specific situation:

Other people

Jonathan Engler: claim that NYC accounted for a huge proportion of all US COVID deaths

Engler wrote: "So, genius, what's your theory as to why a huge proportion of the US 'covid deaths' happened in NYC, and happened at a rate consistent with a mass casualty / terrorist event, and happened in younger as well as age groups, a pattern completely different from everywhere else?" [https://wherearethenumbers.substack.com/p/whodunnit-unabridged/comment/39593011]

However according to the dataset for COVID cases and deaths by county that was published by the New York Times, even in 2020 there were about 25,000 COVID deaths in New York City out of a total of about 350,000 COVID deaths in the whole United States. [https://github.com/nytimes/covid-19-data/blob/master/us-counties-2020.csv] So I don't know if it's such a "huge proportion", because the number of COVID deaths per capita in New York City was about 2.7 times the US total (from (25144/8.773)/(346050/329.5)). The data for COVID deaths by county published by New York Times ends in March 2023, but at that point their dataset has 45,123 COVID deaths in New York City out of a total of 1,135,344 COVID deaths in the whole United States, so there's only about 1.5 times as many CODID deaths per capita in NYC as in the whole US (from (45123/8.773)/(1135344/329.5)).

Joel Smalley: claim that deaths in UK among ages 15-44 in July 2021 were not related to COVID

Smalley pointed out that there was a spike in all-cause deaths among ages 15-44 in UK in late July 2021: [https://metatron.substack.com/p/massive-mortality-signal-in-young]

Smalley then said that the spike in deaths was caused by the vaccines and not COVID, even though it occurred at a time when a low number of new vaccines were being given in the UK:

According to the dataset for all-cause deaths in England and Wales that Smalley used, all-cause deaths in ages 15-44 peaked on July 20th 2021 (regardless of whether you look at single-day data or a 7-day moving average). [https://www.ons.gov.uk/peoplepopulationandcommunity/birthsdeathsandmarriages/deaths/adhocs/1491dailydeathsbydateofoccurrence1june2014to31july2023bysingleyearofageenglandandwales] But according to an ONS dataset for weekly COVID deaths in England and Wales, in late July 2021 there was actually a clear increase in COVID deaths in ages 15-44: [https://www.ons.gov.uk/datasets/weekly-deaths-age-sex/editions/covid-19/versions/154]

Week ending COVID deaths in ages 15-44
2021-05-03 3
2021-05-10 1
2021-05-17 3
2021-05-24 2
2021-05-31 5
2021-06-07 3
2021-06-14 7
2021-06-21 10
2021-06-28 15
2021-07-05 8
2021-07-12 18
2021-07-19 36
2021-07-26 30
2021-08-02 34
2021-08-09 29
2021-08-16 35
2021-08-23 28
2021-08-30 27
2021-09-06 35

In fact on the week ending July 19th 2021, there was the highest number of COVID deaths in ages 15-44 out of any week between February 2021 and December 2021.

There was also a spike in PCR positivity rate in England in late July 2022, because the 7-day moving average of the positivity rate rose from less than 1% in May 2021 to a peak of 11.6% on both July 22nd and July 23nd, after which it again fell back to about 8% a week later: [https://coronavirus.data.gov.uk/details/testing?areaType=nation&areaName=England]

Smalley also wrote: "Take a look at week ending 23-Jul-21, highlighted in the chart. The ONS reported 313 deaths for that week. On average in 2018 and 2019, 293 15 to 44 year olds died each week in England & Wales, with a standard deviation of 18."

However July 23rd 2021 was a Friday. The peak in deaths in ages 15-44 was on week 29 which ended on July 25th, when there was a total of 385 deaths.

The average weekly number of deaths in 2018-2019 between ages 15-44 was about 292 and the standard deviation was about 17.9, so the sigma score for week 29 of 2021 would be about (385-292.4519)/17.88956 or about 5.2. Or if you use the average number of deaths in 2015-2019 as the baseline, then the sigma score is only about 4.7:

system("wget -Umozilla --content-disposition https://www.ons.gov.uk/file?uri=/peoplepopulationandcommunity/birthsdeathsandmarriages/deaths/adhocs/1491dailydeathsbydateofoccurrence1june2014to31july2023bysingleyearofageenglandandwales/dailydeaths20142023.xlsx")
t=as.data.frame(readxl::read_excel("dailydeaths20142023.xlsx",sheet=4,range="A6:CP3354"))
week=format(as.Date(paste0(t$Year,"-",t$Month,"-",t$Day)),"%G_%V")
tap=tapply(rowSums(t[,19:48]),week,sum)
tap2=tap[names(tap)<"2020"&names(tap)>="2018"]
((tap-mean(tap2))/sd(tap2))["2021_29"]

Smalley also wrote that "the ONS reported 313 deaths for that week", but there's a total of 405 deaths among ages 15-44 between July 17th and 23rd (if the week would end on Friday).

Daniel Nagase: claim that there was no excess mortality in Canada in 2020

Daniel Nagase posted a link to the plot below and wrote: "Laughably Canadian government statisticians couldn't be quite as sophisticated in obfuscating their raw data, and a graph made with their own data showed no excess mortality for all of 2020, during Covid." [https://metatron.substack.com/p/massive-mortality-signal-in-young/comment/40216275]

According to OWID which uses excess mortality data from the World Mortality Dataset, Canada had negative excess mortality for the first three months of 2020, which might explain why there was no clear increase in excess mortality in 2020 as a whole. However according to OWID which uses excess mortality data from the World Mortality Database, Canada still had about 24% excess mortality on one week of April 2020 and about 13% excess mortality on one week of December 2020, and both peaks in excess deaths coincided with peaks in excess deaths in the United States:

In summer 2020 when Canada had close to 0% excess mortality, the PCR positivity rate also remained below 1% for a long time. But the spikes in excess deaths in spring 2020 and winter 2020-2021 both coincided with a spike in PCR positivity rate. In many northern states of the United States, the PCR positivity rate also fell below 1% in summer 2020, but in southern states and Mexico there was higher excess mortality and higher PCR positivity in summer 2020.

Mike Yeadon: excess mortality in United States in early 2020

Yeadon wrote: "I still struggle to see the pandemic of covid19. Denis Rancourt and colleagues fail to find an increase in all causes mortality at a time when we were informed that a new & highly contagious respiratory virus was sweeping the land. I'm being simple and asking does not the absence of increase in ACM rule out an additional cause of respiratory illness and death? Just considering the early 2020 period in all 50 US states here." [https://arkmedic.substack.com/p/there-was-no-virus/comment/42133146]

I don't know if the virus is supposed to have been sweeping the land that long before excess mortality became visible on the county level in March 2020, because according to OWID, the cumulative number of cases in the United States only reached above 100 on March 3rd, above 1,000 on March 10th, above 10,000 on March 19th, and above 100,000 on March 28th.

In March 2020 you can find high excess morality in the same counties which had a high number of COVID cases per capita. When I calculated seasonality-adjusted monthly excess deaths on CDC WONDER so that I used data from 2018-2019 as the baseline, the county with the 5th highest percentage of excess deaths in March 2020 was Cleburne, Arkansas:

However in the dataset for COVID cases and deaths by county that was published by the New York Times, Cleburne, Arkansas was also the county with the 23rd highest number of COVID cases per capita in March 2020 (if the counties of NYC are excluded because they were aggregated together in the NYT dataset):

t=read.csv("https://raw.githubusercontent.com/nytimes/covid-19-data/master/us-counties-2020.csv")
t=na.omit(t[order(t$fips),])
t=t[grepl("2020-03",t$date),]
ag=aggregate(unlist(tapply(t$cases,t$fips,\(x)diff(c(0,x)))),t[,2:4],sum)
pop=read.csv("https://www2.census.gov/programs-surveys/popest/datasets/2010-2020/counties/totals/co-est2020-alldata.csv")
ag$pop=setNames(pop[,9],paste0(pop[,4],sprintf("%03d",pop[,5])))[as.character(ag$fips)]
ag$ratio=ag$x/ag$pop*1e5
ag[order(-ag$ratio),][1:32,]|>print.data.frame(row.names=F)

If the counties of NYC are omitted, then Orleans, LA was the county with the 4th highest number of COVID cases per capita and the 10th highest percentage of excess deaths:

Twitter video panel by Pieniazek, Engler, Hockett, and Neil

Norman Pieniazek did a video panel on Twitter with Jonathan Engler, Jessica Hockett, and Martin Neil. [https://x.com/normanpie/status/1718288083601281152]

At time 21:22, Pieniazek said: "The origin of the virus, in the paper that - Fan Wu I think was the name of the first author - these people had of course at the Wuhan institute all fantastic instruments, you know sequencers that they could get from various institutes." However the sequencing was done in Shanghai and most authors of the paper were affiliated with the Shanghai Public Health Clinical Center. Eddie Holmes said that the samples were sent from Wuhan to Shanghai by train. [https://www.youtube.com/watch?v=5u94foNmpKE&t=17m54s]

At time 26:07, Pieniazek described the sequencing of Wuhan-Hu-1 by Wu et al. like this: "You put some kind of a master sequence into the instrument, and then you do sequence it and check what matches the sequence. Because it's very difficult to assemble something from scratch. The pieces are small and there's so many combinations that it's very difficult. So they - as they say - they had all kinds of bat origin viruses. I don't think this kind of work would be permitted in the United States." However actually Wu et al. used MEGAHIT to do de-novo assembly for the metagenomic short reads, and the first 30,474-base version of Wuhan-Hu-1 they published was the contig they got from MEGAHIT (and it accidentally even included 618-base segment of the human genome at the 3' end, which is a common type of assembly error in metagenome-assembled genomes). Another page on my website has instructions on how you can run MEGAHIT yourself to reproduce the de-novo assembly from Wu et al.'s metagenomic reads: hamburgmath.html. Wu et al. wrote: "Of the 384,096 contigs assembled by Megahit, the longest (30,474 nucleotides (nt)) had a high abundance and was closely related to a bat SARS-like coronavirus (CoV) isolate - bat SL-CoVZC45 (GenBank accession number MG772933) - that had previously been sampled in China, with a nucleotide identity of 89.1% (Supplementary Tables 1, 2)." [https://www.nature.com/articles/s41586-020-2008-3] But ZC45 wasn't used as any kind of a "master sequence" during the assembly but it was just the closest match for the de-novo assembled contig.

At time 31:30, Engler talked about how Corman-Drosten used samples of SARS1 to test their PCR protocol because they didn't have samples of SARS2 available, and then he said: "Somebody found the sequences - maybe before it was published - somebody, in one of these journals or something - a preprint server - got the sequence from the Chinese before it was published - sent it to him. And then to create plausible deniability about how they came up with it, they made up this story about validating it against SARS and everything." However Corman-Drosten's primes and probes were designed to match both SARS2 and SARS1, so how could their story have been that they didn't know the genome of SARS2 when they designed the protocol? They needed to know the genome in order to choose primers which matched it. In the paper by Corman et al., they wrote that they designed the protocol based on Wuhan-Hu-1 and a few early sequences from GISAID.

At time 42:24, Pieniazek said: "My wife actually was on the committee that was naming - created the naming scheme for HIV. And this is such a scam. But you know it from England, from those WhatsApp messages, that let us invent a new variant to scare..." The WhatsApp messages by Matt Hancock were sent on December 13th 2020 UTC. When Hancock asked "When do we deploy the new variant" and he wrote that "We frighten the pants off everyone with the new strain", I believe he was talking about when they would roll out the news story about the Alpha variant. [https://www.telegraph.co.uk/news/2023/03/04/project-fear-covid-variant-lockdown-matt-hancock-whatsapp/] News stories about the Alpha variant were published on December 22nd UTC by The Guardian and BBC, which was 9 days after the WhatsApp messages were posted. [https://www.theguardian.com/commentisfree/2020/dec/22/new-variant-coronavirus-genomic-sars-cov-2-pandemic, https://www.bbc.com/news/health-55413666] The Alpha variant was also known as the "UK variant" or "Kent variant" since it was first found in Kent and it first became widespread in southern England. Alpha was already fairly common in December 13th when Hancock wrote the WhatsApp messages, but it had not yet become a big news story, and the name Alpha wasn't introduced until May 2021 but the variant was initially called B.1.1.7. Wikipedia says: "The first case was likely in mid-September 2020 in London or Kent, United Kingdom.[90] The variant was sequenced in September.[91] As of 13 December 2020, 1,108 cases with this variant had been identified in the UK in nearly 60 different local authorities." [https://en.wikipedia.org/wiki/SARS-CoV-2_Alpha_variant#Spread_in_UK] The oldest tweet I found which mentioned the variant identifier B.1.1.7 was posted on December 15th UTC. [https://x.com/search?q=%22b.1.1.7%22+until%3A2020-12-17&f=live]

A Substack post about the video by Pieniazek et al. said: "The issue with 'infectious clones' is that 'you do not know what to create' because there are millions of sequences of coronavirus so there is no 'clonality' and each one has 30 thousand nucleotides and there are combinatorically infinite changes you could potentially need to consider when creating a coronavirus[5]. It therefore isn't possible to know what to change, via Gain of Function (GoF), to make the virus behave in more dangerous ways." [https://wherearethenumbers.substack.com/p/an-explosive-discussion-with-ex-cdc] However one idea for a GoF experiment would be to insert the N-terminal domain of the pangolin coronavirus GD_1 into SARS-CoV-2: "PV bearing Pangolin CoV GD spike mediated hyper-efficient entry into HeLa ACE2 and HEK 293T cells, yielding 50-100 fold higher signals than Wuhan-Hu-1 PV (Figs 3E-G and EV1C). The shorter loops observed in Pangolin CoV GD are analogous to the truncations seen in SARS-CoV-2 variants (Fig 3D). Therefore, to investigate the contribution of the NTD to Pangolin CoV spike activity we performed domain swaps and evaluated PV infection (Fig 3H). Providing Wu-Hu-1 with the Pangolin CoV NTD enhanced entry into HeLa ACE2 and HEK 293T cells and phenocopied Alpha PV (Fig 3I). Conversely, Pangolin CoV spike with the Wu-Hu-1 NTD exhibited greatly reduced infection (relative to native Pangolin CoV PV)." [https://www.embopress.org/doi/full/10.15252/embr.202154322] Another idea would be to insert a second furin cleavage site to a virus like IBV which previously had only one FCS: "Mutation of the S2' site of QX genotype (QX-type) infectious bronchitis virus (IBV) spike protein (S) in a recombinant virus background results in higher pathogenicity, pronounced neural symptoms and neurotropism when compared with conditions in wild-type IBV (WT-IBV) infected chickens. In this study, we present evidence suggesting that recombinant IBV with a mutant S2' site (furin-S2' site) leads to higher mortality. Infection with mutant IBV induces severe encephalitis and breaks the blood-brain barrier." [https://www.ncbi.nlm.nih.gov/pmc/articles/PMC6832359/]

The Substack post also said: "They can create thousands of virus combinations, but the problem is how to test these creations. There is no way to test the billions and billions of possible changes to a virus and identify which changes to the sequence are 'bad'. You need the phenotype, and you cannot deduce the phenotype from the genotype. So how would GoF researchers - E.g., EcoHealth alliance - know exactly what to create?" However you can see page 11 of the DEFUSE proposal for ideas on what kind of changes to introduce to the viral genome. [https://drasticresearch.files.wordpress.com/2021/09/main-document-preempt-volume-1-no-ess-hr00118s0017-ecohealth-alliance.pdf] It includes a section titled "RBD deletions" which says: "Small deletions at specific sites in the SARSr-CoV RBD alter risk of human infection. We will analyze the functional consequences of these RBD deletions on SARSr-CoV hACE2 receptor usage, growth in HAE cultures and in vivo pathogenesis. First, we will delete these regions, sequentially and in combination, in SHCO14 and SARS-CoV Urbani, aitticipating that the introduction of deletions will prevent virus growth in Vero cells and HAE. In parallel, we will evaluate whether RBD deletion repair restores the ability of low risk strains to use human ACE2 and grow in human cells." And next there's a section titled "S2 Proteolytic Cleavage and Glycosylation Sites" which says: "After receptor binding, a variety of cell surface or endosomal proteases cleave the SARS-CoV S glycoprotein causing massive changes in S structure and activating fusion-mediated entry. We will analyze all SARSr-CoV S gene sequences for appropriately conserved proteolytic cleavage sites in S2 and for the presence of potential furin cleavage sites. SARSr-CoV S with mismatches in proteolytic cleavage sites can be activated by exogenous trypsin or cathepsin L. Where clear mismatches occur, we will introduce appropriate human-specific cleavage sites and evaluate growth potential in Vero cells and HAE cultures. In SARS-CoV, we will ablate several of these sites based on pseudotyped particle studies and evaluate the impact of select SARSr-CoV S changes on virus replication and pathogenesis. We will also review deep sequence data for low abundant high risk SARSr-CoV that encode functional proteolytic cleavage sites, and if so, introduce these changes into the appropriate high abundant, low risk parental strain." And next there's a section titled "N-linked glycosylation" which says: "Some glycosylation events regulate-SARS-CoV particle binding DC-SIGN/L-SIGN, alternative receptors for SARS-CoV entry into macrophages or monocytes. Mutations that introduced two new N-linked glycosylation sites may have been involved in the emergence of human SARS-CoV from civets and raccoon dogs. While the sites are absent from civet and raccoon dog strains and clade 2 SARSr-CoV, they are present in WIV1, WIV16 and SHCO14, supporting a potential role for these sites in host jumping. To evaluate this, we will sequentially introduce clade 2 disrupting residues of SARS-CoV and-SHC014 and evaluate virus growth in Vero cells, nonpermissive cells ectopically expressing DC-SIGN, and in human monocytes and macrophages anticipating reduced virus growth efficiency. We will introduce the clade I mutations that result in N-linked glycosylation in rs4237 RBD deletion repaired strains, evaluating virus growth efficiency in HAE, Vero cells, or nonpermissive cells ± ectopic DC-SIGN expression. In vivo, we will evaluate pathogenesis in transgenic hACE2 mice." And finally there's a section titled "Low abundance micro-variations" which says: "We will structurally model and identify highly variable residue changes in the SARSr-CoV S RBD, use commercial gene blocks to introduce these changes singly and in combination into the S glycoprotein gene of the low risk, parental strain and test ACE2 receptor usage, growth in HAE and in-vivo pathogenesis." (So in the last section they wrote that they would test the effect of the mutations they introduce by measuring growth in human airway epithelial cells, and by the in-vivo experiments they probably meant infecting transgenic human ACE2 mice like in other parts of the proposal.)

Simon Goddek: excess mortality in Germany, Austria, and Switzerland

Simon Goddek posted this tweet: [https://x.com/goddeketal/status/1729507567452188771]

However all three countries had spikes in excess mortality in spring 2020 and late 2020. At OWID there's no PCR positivity data available for Austria in 2020 or for Switzerland in early 2020, but in countries with PCR positivity data available, the spikes in deaths coincided with a spike in PCR positivity rate, and the PCR positivity rate was also low in summer 2020 when excess mortality was low:

The plot in Goddek's tweet used a 52-week moving average, where the window extends 51 weeks backwards (and not 26 weeks backwards and 25 weeks forwards or vice versa). However Germany had negative excess ASMR in 2019 and the first two months of 2020, and also in summer 2020 when people weren't dying of COVID (and Austria and Switzerland also followed a similar pattern): [https://www.mortality.watch/explorer/?c=DEU&t=asmr_excess&ct=monthly&df=2019+Jan&v=2]

Germany also had low excess mortality in mid-2021 when there was a large number of new vaccines given:

"Whodunnit" bacterial pneumonia post by Where are the Numbers

In August 2023, Martin Neil, Jonathan Engler, Jessica Hockett, and Norman Fenton published a Substack post where they presented a hypothesis that deaths attributed to COVID may have been caused by bacterial pneumonia. [https://wherearethenumbers.substack.com/p/whodunnit-unabridged]

Another response to the Substack post was posted by Brian Mowrey, who has published a series of Substack posts where he has argued against the theory that COVID was caused by bacterial pneumonia. [https://unglossed.substack.com/p/repeating-the-case-against-bacterial]

Papers about the incidence of bacterial coinfections and secondary infections

Neil et al. wrote: "So, in Korea 45% of the patients showed coinfection but, in the USA, it was reported as significantly less at 3.5%. How can the same pathogen have such a different coinfection profile?" However the Korean paper they linked was quoting a meta-analysis where the figure of 45% came from a Chinese paper, so Neil et al. got the country wrong. The Chinese paper had a sample size of 40, where the table featured in the meta-analysis indicated that 14 patients had Mycoplasma pneumoniae and one patient had Streptococcus pneumoniae (giving a total of 15/40). [https://www.ncbi.nlm.nih.gov/pmc/articles/PMC7245213/] However if you read the Chinese paper, it just indicated that they found mycoplasma in 14 patients and not specifically Mycoplasma pneumoniae. [https://www.ncbi.nlm.nih.gov/pmc/articles/PMC7169899/] (But I don't know if it means that the Chinese study only tested for Mycoplasma pneumoniae and not other species of mycoplasma, because the meta-analysis also quoted another Chinese preprint which found a high prevalence of Mycoplasma pneumoniae in COVID patients: "The most common respiratory pathogens detected in Qingdao COVID-19 patients were influenza virus A (60.00%) and influenza virus B (53.33%), followed by mycoplasma pneumoniae (23.33%) and legionella pneumophila (20.00%)." [https://www.medrxiv.org/content/10.1101/2020.02.29.20027698v2.full.pdf])

As a source for the figure of 3.5%, Neil et al. quoted two different papers which both happened to feature the same figure. The other paper from the UK only looked at the prevalence of "invasive pneumococcal disease" where I belive they only tested for Streptococcus pneumoniae (which is also known as pneumococcus). [https://www.ncbi.nlm.nih.gov/pmc/articles/PMC7717180/pdf/ciaa1728.pdf] The second paper they quoted was a meta-analysis which included 24 papers, out of which 19 were from China, 2 from USA, and 3 from other countries (so that's another paper where Neil et al. got the country wrong). But anyway, the meta-analysis said: "In the random effects meta-analysis bacterial co-infection was identified in 3.5% of patients (95%CI 0.4-6.7%) and bacterial secondary infection was identified in 14.3% of patients (95%CI 9.6-18.9%). When pooling all included studies, the proportion of COVID-19 patients with bacterial infection was 6.9% (95%CI 4.3-9.5%) (Fig. 2)." [https://www.ncbi.nlm.nih.gov/pmc/articles/PMC7832079/] In case you're wondering how a co-infection is different from a secondary infection, the meta-analysis said: "Bacterial infection was defined as an acute infection including either (a) co-infection on presentation, or (b) secondary infection emerging during the course of illness or hospital stay." Other studies did not differentiate between coinfections and secondary infections. And in the studies that did, it could be that some patients had a bacterial infection on presentation but it was not counted as a coinfection if it was not diagnosed on presentation. And the meta-analysis said that it looked at the prevalence of "acute infections", which might mean that they didn't include studies where the subjects were simply tested for the presence of bacteria that cause pneumonia, like in the Chinese study where Neil et al. got the figure of 45% from.

Use of the term pneumonia to refer to COVID

Neil et al. wrote that it was unusual that Italians used the term "pneumonia" to refer to COVID in early 2020. However until February 11th when the name SARS-CoV-2 was introduced, the species name for SARS2 at GenBank used to be "Wuhan seafood market pneumonia virus". [https://www.ncbi.nlm.nih.gov/nuccore/1798172431?sat=48&satkey=1085346] In China an early name for COVID was "novel coronavirus pneumonia" (新型冠状病毒肺炎; literally "new pattern crown form sickness poison lung inflammation"). [https://zh.wikipedia.org/wiki/2019冠状病毒病] And an even earlier name for COVID in China was "pneumonia of unknown origin" (不明原因的肺炎病; literally "not bright source cause target lung inflammation sickness"). [https://www.who.int/zh/emergencies/disease-outbreak-news/item/2020-DON229]

Gram-positive bacteria in lung samples may be Staphylococcus aureus and not Streptococcus pneumoniae

There's a really stupid logical fallacy here: "When we look at the microbiological isolates taken from patients suffering from VAP we find that gram-positive bacteria are present in covid-19 patients at a statistically significantly higher rate compared to non-covid-19 patients. Streptococcus pneumoniae (pneumococci) are gram-positive, hence there is significantly higher presence of pneumonia (caused by this pathogen) in this cohort, which the authors fail to discuss." (I hope the logical fallacy came from the pen of the coauthor who had a PhD in social sciences and not from the professors specialized in math and statistics.)

The paper didn't say anything about Streptococcus pneumoniae, but it did mention Staphylococcus aureus, which is also gram-positive, which is frequently found in the upper respiratory tract, and which was not listed separately in the table that showed the percentage of gram-positive bacteria. The paper said: "VAP is a life-threatening disease associated with high mortality rates (43%) [5]. It is sustained by different microorganisms, especially Staphylococcus aureus, Enterobacteriaceae, and non-fermenting Gram-negative bacteria (Pseudomonas aeruginosa, Acinetobacter baumannii, and Stenotrophomonas maltophilia) [4]." [https://www.ncbi.nlm.nih.gov/pmc/articles/PMC8388913/] So some of the COVID patients who tested positive for gram-positive bacteria may have tested positive for Staphylococcus aureus or other bacteria. And you can't deduce that the patients tested positive for Streptococcus pneumoniae.

Mischaracterization of 2008 paper about Spanish flu where the last author was Fauci

Neil et al. wrote that "Fauci et al believe that the 1918 pandemic was largely caused by pneumonia" (by which I presume they meant bacterial pneumonia). However I don't think it's necessarily a fair characterization of the hypothesis presented in the paper from 2008 where Fauci was the last author. The paper said that "The majority of deaths in the 1918–1919 influenza pandemic likely resulted directly from secondary bacterial pneumonia caused by common upper respiratory-tract bacteria." [https://www.ncbi.nlm.nih.gov/pmc/articles/PMC2599911/] But that doesn't imply that it wasn't the H1N1 virus which caused the pandemic, since Fauci and his coauthors presumably didn't believe that the pandemic started because some species of bacteria circulated around the world.

And later the paper also said that the 1957 influenza pandemic was caused by a virus even though "most 1957-1958 deaths were attributable to secondary bacterial pneumonia": "The viruses that caused the 1957 and 1968 pandemics were descendants of the 1918 virus in which 3 (the 1957 virus) or 2 (the 1968 virus) new avian gene segments had been acquired by reassortment [21]. Although lower pathogenicity resulted in far fewer deaths, hence fewer autopsies, most 1957-1958 deaths were attributable to secondary bacterial pneumonia, as had been the case in 1918." So it can be simultaneously true that the pandemic was caused by a virus but that most deaths can be attributed to secondary bacterial pneumonia.

The discussion section of the paper also referred to animal studies where bacteria coadministered with a virus resulted in more severe disease than bacteria administered alone: [https://academic.oup.com/jid/article/198/7/962/2192118]

The question of whether the pathogenesis of severe influenza-associated pneumonia was primarily viral (i.e., assumed to be an unknown etiologic agent in 1918) or a combination of viral and bacterial agents was carefully considered by pathologists in 1918-1919, without definitive resolution [26, 33]. The issue was addressed anew in the early 1930s when Shope published a series of experimental studies that involved the just-discovered swine influenza A virus: severe disease in an animal model resulted only when the virus and Hemophilus influenzae suis were administered together [67]. In 1935, Brightman studied combined human influenza and streptococcal infection in a ferret intranasal inoculation model. Even though neither agent was pathogenic when administered alone, they were highly fatal in combination [68]. In rhesus monkeys, human influenza viruses given intranasally were not pathogenic, but could be made so by nasopharyngeal instillation of otherwise nonpathogenic bacteria [69]. During the 1940s, additional studies in ferrets, mice, and rats established that the influenza virus in combination with any of several pneumopathic bacteria acted synergistically to produce either a higher incidence of disease, a higher death rate, or a shortened time to death [70-73]; these effects could be mitigated or eliminated if antibiotics were given shortly after establishment of combined infection [73]. More recent data suggest that influenza vaccination may prevent bacterial disease [74].

The patient of Wuhan-Hu-1 was not patient zero

Neil et al. wrote: "The first victim is: 'Patient Zero' in China. On 26th December in Wuhan, China, patient zero was admitted to hospital experiencing a 'severe' respiratory syndrome that included fever, dizziness, and a cough."

However the patient in the Wu et al. paper was not the first COVID patient either by date of hospital admission or date of symptom onset. [https://media.discordapp.net/attachments/1093243194231246934/1112400975026733167/Untitled10.png] For example the 65-year-old male patient of the IPBCAMS-WH-01 sample was listed as having a date of hospital admission on December 18th. [https://www.ncbi.nlm.nih.gov/pmc/articles/PMC7147275/]

Eddie Holmes was one of the authors of the paper about Wuhan-Hu-1 where the first author was Fan Wu and the last author was Yongzhen Zhang. Holmes said that the Wuhan-Hu-1 sample was just one of seven samples that the authors of the paper received from Wuhan: "He [Zhang] contacted staff at Wuhan CDC in the local hospital saying: 'Can we have your samples? I want to sequence them.' [...] He was sent seven patient samples on January 3rd, and this - he was in Shanghai at that point - so they were sent on a train from Wuhan to Shanghai. He's sent seven samples and he put them on the sequencer on January 3rd." [https://www.youtube.com/watch?v=5u94foNmpKE&t=1s&t=17m45s] And Holmes also said that he heard that the plan of the Chinese authorities was to not announce the identity of the virus until the Lunar New Year, which fell on January 25th in 2020, and he said that Yongzhen Zhang actually got in major trouble for publishing the genome before then: "I heard was they wanted to have - it's maybe a rumor - but I heard they wanted to have the whole thing kind of tied up by Lunar New Year, and to have one big announcement saying 'here's the virus, we've solved the problem, here it all is', you know, bow-tied, post package posted - that's kind of what I heard they wanted. And we kind of like, you know, we scuppered their their plans in doing that, and like I say there has been a lot of fallout because of it." [time 26:08] And Holmes also said: "Zhang was not the first person to sequence the virus, okay. I don't know about the people that have done that as well - the whole set of groups were - but so, Zhengli Shi had sequenced it - actually probably before Sanger sequenced it." [time 31:01]

Neil et al. also wrote: "Patient zero is relatively young age and absence of significant health problems. Yet patient zero was subjected to a battery of tests, including very expensive genetic sequencing of fluid removed from his airways, that (we are told) ultimately led to the discovery of a new coronavirus subsequently dubbed SARS-CoV-2. This is not a routine medical response to a typical respiratory infection."

However Eddie Holmes said that Zhang's team put the sample on the sequencer on January 3rd in an unknown timezone, but at that point the story was that the Chinese authorities already knew there was an outbreak of pneumonia of an unknown cause but they had not yet announced what the causative agent was. [https://en.wikipedia.org/wiki/Timeline_of_the_COVID-19_pandemic_in_January_2020#3_January] So their motive for doing the metagenomic sequencing could've been to find out the cause of the pneumonia outbreak. You can try searching Google Scholar for "pneumonia unknown etiology metagenomic". [https://scholar.google.com/scholar?as_yhi=2019&q=pneumonia+unknown+etiology+metagenomic] You'll find a bunch of papers where they had a case of pneumonia of unknown etiology but they were able to find out the causative agent by doing metagenomic sequencing, like for example there's one paper titled "Metagenomic Analysis Identified Stenotrophomonas maltophilia Pneumonia in an Infant Suffering From Unexplained Very Severe Pneumonia". [https://www.ncbi.nlm.nih.gov/pmc/articles/PMC6761247/] (Stenotrophomonas maltophilia may also have been implicated in some of the early COVID cases in Wuhan, because it was one of the most abundant species of bacteria in the metagenomic sequencing runs of WIV02, WIV06, and WIV07.) And there's another paper titled "Metagenomic analysis identified human rhinovirus B91 infection in an adult suffering from severe pneumonia", where they wrote that the human rhinovirus B91 had previously remained undetected because it's rarely reported to cause pneumonia. [https://www.atsjournals.org/doi/full/10.1164/rccm.201609-1908LE]

Zhang's team was not the first to sequence the genome, because other samples had already been sequenced by December 27th local time by Vision Medicals and by December 29th local time by BGI: [https://www.caixinglobal.com/2020-02-29/in-depth-how-early-signs-of-a-sars-like-virus-were-spotted-spread-and-throttled-101521745.html]

As early as Dec. 27, a Guangzhou-based genomics company had sequenced most of the virus from fluid samples from the lung of a 65-year old deliveryman who worked at the seafood market where many of the first cases emerged. The results showed an alarming similarity to the deadly SARS coronavirus that killed nearly 800 people between 2002 and 2003.

Around that time, local doctors sent at least eight other patient samples from hospitals around Wuhan to multiple Chinese genomics companies, including industry heavyweight BGI, as they worked to determine what was behind a growing number of cases of unexplained respiratory disease. The results all pointed to a dangerous SARS-like virus.

[...]

Several other genomics companies also tested samples from patients in Wuhan with the then-unidentified virus in late December, Caixin learned.

Industry leader BGI received a sample from a Wuhan hospital on Dec. 26. Sequencing was completed by Dec. 29, and showed while it was not the virus that causes SARS, or severe acute respiratory syndrome, it was a previously unseen coronavirus that was about 80% similar to the virus that causes SARS.

A BGI source told Caixin that when they undertook the sequencing project in late December the company was unaware that the virus had sickened many people. "We take a lot of sequencing commissions every day," the source said.

Caixin has learned that the Wuhan hospital sent BGI at least 30 samples from different pneumonia cases for sequencing in December, and three were found to contain the new coronavirus. In addition to the Dec. 26 case, the second and third positive samples were received on Dec. 29 and Dec. 30. They were tested together and the results were reported to the Wuhan Municipal Health Commission as early as Jan. 1.

On Jan. 1, gene sequencing companies received an order from Hubei's health commission to stop testing and destroy all samples, according to an employee at one. “If you test it in the future, be sure to report it to us,” the person said they were told by phone.

Two days later on Jan. 3, the National Health Commission issued its gag order and said the Wuhan pneumonia samples needed to be treated as highly pathogenic microorganisms - and that any samples needed to be moved to approved testing facilities or destroyed.

But that day, Professor Zhang Yongzhen of Fudan University in Shanghai received biological samples packed in dry ice in metal boxes and shipped by rail from Wuhan Central Hospital. By Jan. 5, Zhang's team had also identified the new, SARS-like coronavirus through using high-throughput sequencing.

Wuhan-Hu-1 was probably not even the first published genome, there's two sequences at GISAID with a publication date on January 10th, and GISAID said that they released the first genomes on January 10th 2020 at 00:41 UTC. [https://gisaid.org/resources/in-focus-archive/]

Bacterial pneumonia is a common cause of death in children but COVID is not

Another problem with the theory that COVID was caused by misdiagnosed bacterial pneumonia is that COVID deaths are rare in children, but Our World in Data says that "2.5 million people died from pneumonia in 2019. Almost a third of all victims were children younger than 5 years, it is the leading cause of death for children under 5." [https://ourworldindata.org/pneumonia]

Claim that a high PCR positivity rate means that an increase in COVID-19 cases was caused by increased testing

Neil et al. wrote: "Furthermore, given that these tests generated exceptionally high positivity rates, that climbed to 70% and higher, it should be clear that the observed covid-19 case count was dominated by testing rather than a genuine respiratory illness." [https://wherearethenumbers.substack.com/p/whodunnit-unabridged] However if they would've tested a bunch of people who didn't actually have COVID, then wouldn't you expect the PCR positivity rate to be low, because isn't a high positivity rate rather a sign of a low number of test performed relative to the number of people who were infected with the virus?

I made heatmaps for counties of New York State which show COVID deaths per capita, PCR positivity rate, number of PCR tests performed per capita:

In many counties in upstate New York which didn't have high excess deaths in spring 2020, the positivity rate also remained below 10% in spring 2020, but in some counties of NYC, the positivity rate reached over 60% in March and April. In summer 2020 the PCR positivity rate fell below 1% in many counties, even though in all counties the number of PCR tests performed per capita was much higher in the summer 2020 than in spring 2020. But on the other hand in August 2023 which is the last month included in my heatmaps, some counties had over 30% PCR positivity rate because the monthly number of tests was 2-3 orders of magnitude lower than during the peak in testing in early 2021, so they're probably no longer doing as many tests for asymptomatic people who don't have COVID. In New York City, the number of PCR tests performed per capita was about an order of magnitude lower in April 2020 than in January 2022, which might partially explain the relatively high positivity rates in the spring.

But anyway, if PCR tests produce a huge number of false positives like some people claim, then why are there many counties of New York State where the percentage of positive tests fell below 1% in summer 2020 or summer 2021?

BTW from the heatmap above you can also see that in December 2020 or January 2021, the number of COVID deaths per capita was almost as high as in NYC in spring 2020 in some counties like Herkimer, Greene, Genesee, and Seneca. But they were all counties which had a low number of COVID deaths per capita in spring 2020, so maybe people in those counties did not yet have natural immunity.

Map of COVID deaths by US county divided into three approximately equal-sized groups

The post by Neil et al. featured the following map that was posted by Justin Hart on Twitter on May 23rd 2020 UTC, with the text "There are as many deaths in the green area as there are in the yellow area. They are as many deaths in the yellow area are there in the red area." [https://x.com/justin_hart/status/1264263301703168000]

The map used data for COVID deaths and cases by county that was published on the GitHub account of the New York Times. [https://github.com/nytimes/covid-19-data/blob/master/us-counties-2020.csv] I believe the map was based on data from May 15th or earlier, because if you aggregate the counties of New York City into a single county like in NYT's dataset, then the five counties with the highest number of deaths were the five counties that were colored red in Hart's map until May 15th:

> t=read.csv("https://github.com/nytimes/covid-19-data/raw/master/us-counties-2020.csv")
> t2=t[t$date=="2020-05-15",]
> t2[order(-t2$deaths),][1:10,c(2,3,6)]|>`rownames<-`(NULL)
          county         state deaths
1  New York City      New York  19972
2           Cook      Illinois   2762
3         Nassau      New York   2499
4          Wayne      Michigan   2194
5        Suffolk      New York   1757
6    Los Angeles    California   1755
7          Essex    New Jersey   1510
8         Bergen    New Jersey   1443
9    Westchester      New York   1392
10     Middlesex Massachusetts   1347
> sum(t2$deaths,na.rm=T)
[1] 87499

The total population of the five red counties in 2020 was about 18.5 million, or about 5.6% of the total US population in 2020 (if New York City is again treated as a single county).

Neil et al. included the following comment about Hart's map: "For instance, by May 2020 the 'pandemic' in the USA had only occurred around a few points that could have been pinned on a map, and everywhere else failed to experience it." However maybe a better way to find which counties were the most impacted by the pandemic would be to find counties with the highest number of COVID deaths per capita. If you aggregate counties of New York City like in NYT's dataset, then on May 15th the three counties with the highest number of COVID deaths per capita were all from Georgia:

> t=read.csv("https://github.com/nytimes/covid-19-data/raw/master/us-counties-2020.csv")
> t2=t[t$date=="2020-05-15",]
> t2[order(-t2$deaths),][1:10,c(2,3,6)]|>`rownames<-`(NULL)
> pop=read.csv("https://www2.census.gov/programs-surveys/popest/datasets/2020-2022/counties/totals/co-est2022-alldata.csv")
> pops=setNames(pop[,9],paste0(pop[,4],sprintf("%03d",pop[,5])))
> t2$pop=pops[as.character(t2$fips)]
> t2[t2$county=="New York City","pop"]=sum(pop[pop$STNAME=="New York"&grepl("^(Kings|Queens|New York|Bronx|Richmond) County",pop$CTYNAME),]$POPESTIMATE2020)
> t2$ratio=t2$deaths/t2$pop*1e5
> t2=t2[order(-t2$ratio),]
> head(t2[,c(2,3,5,6,7,8)],10)|>`rownames<-`(NULL)
                 county      state  cases deaths     pop    ratio
1              Randolph    Georgia    169     21    6368 329.7739
2               Terrell    Georgia    199     24    9138 262.6395
3                 Early    Georgia    233     28   10799 259.2833
4         New York City   New York 195472  19972 8740647 228.4957
5  St. John the Baptist  Louisiana    830     77   42355 181.7967
6                Nassau   New York  38864   2499 1390559 179.7119
7                 Essex New Jersey  15953   1510  859924 175.5969
8                 Union New Jersey  14492    939  573617 163.6981
9             Dougherty    Georgia   1662    134   85153 157.3638
10              Passaic New Jersey  14930    816  523406 155.9019

Below I made a map similar to Hart's map where I divided the counties to three approximately equal-sized groups based on the cumulative number of COVID deaths on May 15th 2020, except I sorted the counties based on COVID deaths per capita and not absolute COVID deaths. Now there's a total of 30 red counties, and there's also a bunch of red counties in southern states, and for example in Georgia there's a cluster where multiple neighboring countries are red:

Or here's an animation where you can see the gradual spread of COVID deaths from the initial clusters of counties to neighboring counties:

If the pandemic was fake and there was no viral spread and the deaths were all caused by the protocols, then did the health authorities have some kind of a system in place where they emulated viral spread so that they first introduced the protocols in a small number of counties, then next month they adopted the protocols in neighboring counties, and then the following month they adopted the protocols in further neighboring counties?

Here's R code for producing the maps above:

library(ggplot2)
library(usmap)

download.file("https://github.com/nytimes/covid-19-data/raw/master/us-counties-2020.csv","us-counties-2020.csv")
download.file("https://www2.census.gov/programs-surveys/popest/datasets/2020-2022/counties/totals/co-est2022-alldata.csv","co-est2022-alldata.csv")
download.file("https://health.data.ny.gov/api/views/xymy-pny5/rows.csv?accessType=DOWNLOAD","New_York_State_Statewide_COVID-19_Fatalities_by_County.csv")
download.file("https://data.ny.gov/api/views/krt9-ym2k/rows.csv?accessType=DOWNLOAD&sorting=true","Annual_Population_Estimates_for_New_York_State_and_Counties__Beginning_1970.csv")

enddate="2020-03-15"

t=read.csv("us-counties-2020.csv")
t2=t[t$date==enddate,]
pop=read.csv("co-est2022-alldata.csv")
pops=setNames(pop[,9],paste0(pop[,4],sprintf("%03d",pop[,5])))
t2$pop=pops[as.character(t2$fips)]

ny=read.csv("New_York_State_Statewide_COVID-19_Fatalities_by_County.csv")
ny2=ny[as.Date(ny[,1],"%m/%d/%Y")==enddate&ny[,2]%in%c("Kings","Queens","Manhattan","Bronx","Richmond"),]
nypop=read.csv("Annual_Population_Estimates_for_New_York_State_and_Counties__Beginning_1970.csv")
nypop=nypop[nypop$Year==2020,]
nypops=setNames(nypop$Population,sub(" County","",nypop$Geography))
ny2$County[ny2$County=="Manhattan"]="New York"
nyfips=setNames(c(36081,36085,36047,36061,36055),c("Kings","Bronx","Queens","Richmond","New York"))
nydf=data.frame(date=t2[1,1],county=ny2$County,state="New York",fips=nyfips[ny2$County],cases=NA,deaths=ny2$Deaths.by.County.of.Residence,pop=nypops[ny2$County])
t2=rbind(t2,nydf)
t2=t2[t2$county!="New York City",]

t2$ratio=t2$deaths/t2$pop*1e5
t2=t2[order(-t2$ratio),]
last=head(which(cumsum(t2$deaths)>=sum(t2$deaths,na.rm=T)/3),1)
last2=head(which(cumsum(t2$deaths)>=sum(t2$deaths,na.rm=T)/3*2),1)

df=data.frame(fips=t2[1:last,]$fips,values="1")
df=rbind(df,data.frame(fips=t2[(last+1):last2,]$fips,values="2"))

plot_usmap(data=df,linewidth=.03)+
scale_fill_manual(values=c(hcl(15,90,60),hcl(75,70,90)),na.value=hcl(115,60,70))+
ggtitle(stringr::str_wrap(paste0("Counties sorted by cumulative COVID deaths per capita on ",enddate," and divided to three approximately equal-sized groups. Counties in red with highest COVID deaths per capita had ",sum(t2[1:last,]$deaths)," deaths, counties in yellow with intermediate COVID deaths per capita had ",sum(t2[(last+1):last2,]$deaths)," deaths, and counties in green with lowest COVID deaths per capita had ",sum(tail(t2,-last2)$deaths,na.rm=T), " deaths."),110))+
geom_polygon(data=usmapdata::us_map(regions="states"),aes(x,y,group=group),fill=NA,linewidth=.1,color="white")+
theme(
  legend.position="none",
  panel.background=element_rect(color=NA,fill="white"),
  plot.background=element_rect(color=NA,fill="white"),
  plot.title=element_text(size=8)
)

ggsave("1.png",width=6,height=6)
system("mogrify -gravity center -trim -border 32 -bordercolor white 1.png")

Compared to Hart's map, a better way to visualize which states were the most impacted by COVID might be to just make a table of monthly COVID deaths per capita for each state:

In April 2020, the number of COVID deaths per capita was the highest in New Jersey, followed by Connecticut, Massachusetts, New York, Michigan, and Louisiana, but Hart's map didn't even have any red counties from the first three states. According to the data by CDC that I used, in April 2020 even Louisiana had almost as many COVID deaths per capita as New York State. The number of COVID deaths per 100,000 was about 303 in New York State in April 2020, but it was higher in November 2020 in North Dakota and South Dakota, in December 2020 in South Dakota, Ohio, Iowa, and Indiana, in January 2021 in Arizona, Alabama, and Pennsylvania, in September 2021 in Florida, in October 2021 in Oklahoma, and in December 2021 in Tennessee.

Here's R code for producing the heatmap above:

# install.packages("BiocManager")
# BiocManager::install("ComplexHeatmap")
# install.packages("circlize"
# install.packages("colorspace")
library(ComplexHeatmap)
library(circlize) # for colorRamp2
library(colorspace)

download.file("https://data.cdc.gov/api/views/pwn4-m3yp/rows.csv?accessType=DOWNLOAD","Weekly_United_States_COVID-19_Cases_and_Deaths_by_State_-_ARCHIVED.csv")
download.file("https://www2.census.gov/programs-surveys/popest/datasets/2020-2022/state/totals/NST-EST2022-ALLDATA.csv","NST-EST2022-ALLDATA.csv")

pop=read.csv("NST-EST2022-ALLDATA.csv")
pops=setNames(pop[,7],pop[,5])

t=read.csv("Weekly_United_States_COVID-19_Cases_and_Deaths_by_State_-_ARCHIVED.csv")

statecode=read.csv("https://raw.githubusercontent.com/jasonong/List-of-US-States/master/states.csv",row.names=2)
t2=data.frame(statecode[t$state,],as.Date(t$start_date,"%m/%d/%Y")+3,t$new_deaths)
colnames(t2)=c("x","y","z")

m=t(sapply(split(t2,t2[,1]),\(x){d=rbind(x,data.frame(x=x[1,1],y=seq(min(x[,2]),max(x[,2]),"1 day"),z=NA));d=d[!duplicated(d[,2]),];d=d[order(d[,2]),];tapply(zoo::na.approx(d[,3]),sub("...$","",d[,2]),sum)}))
m=m[rownames(m)%in%names(pops),]
m=m/pops[rownames(m)]*1e5
m=m[order(-rowSums(m)),]
m=m[,-ncol(m)]

disp=round(m)

rowmax=t(apply(m,1,\(x)x==max(x,na.rm=T)))
rowmax[is.na(rowmax)]=F

hc=as.hclust(reorder(as.dendrogram(hclust(dist(m))),prcomp(m)$x[,1]))

png("1.png",w=ncol(m)*30+1000,h=nrow(m)*30+1000,res=72)

ht_opt$COLUMN_ANNO_PADDING=unit(0,"mm")
ht_opt$ROW_ANNO_PADDING=unit(0,"mm")

m[m<0]=0
m=m^.6

maxcolor=max(m)*.9

Heatmap(
  m,
  show_heatmap_legend=F,
  show_column_names=F,
  show_row_names=F,
  width=unit(ncol(m)*30,"pt"),
  height=unit(nrow(m)*30,"pt"),
  row_dend_width=unit(200,"pt"),
  cluster_columns=F,
  cluster_rows=hc,
  clustering_distance_rows="euclidean",
  column_title="Monthly COVID deaths per 100,000. [https://data.cdc.gov/Case-Surveillance/Weekly-United-States-COVID-19-Cases-and-Deaths-by-/pwn4-m3yp]",
  column_title_gp=gpar(fontsize=22),
  rect_gp=gpar(col="gray80",lwd=0),
  top_annotation=columnAnnotation(text=anno_text(gt_render(colnames(m),padding=unit(c(3,3,3,3),"mm")),just="left",rot=90,location=unit(0,"npc"),gp=gpar(fontsize=17,border="gray70",lwd=1))),
  bottom_annotation=columnAnnotation(text=anno_text(gt_render(colnames(m),padding=unit(c(3,3,3,3),"mm")),just="left",rot=270,gp=gpar(fontsize=17,border="gray70",lwd=1))),
  left_annotation=rowAnnotation(text=anno_text(gt_render(rownames(m),padding=unit(c(3,3,3,3),"mm")),just="right",location=unit(1,"npc"),gp=gpar(fontsize=17,border="gray70",lwd=1))),
  right_annotation=rowAnnotation(text=anno_text(gt_render(rownames(m),padding=unit(c(3,3,3,3),"mm")),just="left",location=unit(0,"npc"),gp=gpar(fontsize=17,border="gray70",lwd=1))),
  col=colorRamp2(seq(0,maxcolor,,16),hex(HSV(c(210,210,210,210,150,100,60,45,30,15,0,0,0,0,0,0),c(0,.166,.333,rep(.5,9),.7,.9,1,1),c(rep(1,12),.75,.5,.25,0)))),
  cell_fun=\(j,i,x,y,w,h,fill)grid.text(disp[i,j],x,y,gp=gpar(fontface=ifelse(rowmax[i,j],4,"plain"),fontsize=16,col=ifelse(abs(m[i,j])>=maxcolor*.75,"white","black")))
)

dev.off()
system("mogrify -gravity center -trim -border 16 -bordercolor white 1.png")

The metagenomic sequencing run of Wuhan-Hu-1 has a large number of Prevotella reads

In order to find which bacteria are present in lung samples of COVID patients, you can search the NCBI's Sequence Read Archive for metagenomic sequencing runs for samples of COVID patients. The runs at the SRA have been analyzed with STAT (SRA Taxonomical Analysis Tool), which provides an estimate of how many sequencing reads match each organism in a taxonomical tree. You can see a graphical representation of the STAT results by going to the "Analysis" tab at the SRA and clicking "Show Krona View". [https://trace.ncbi.nlm.nih.gov/Traces/?view=run_browser&acc=SRR10971381&display=analysis] For example in the metagenomic run from the Wu et al. paper where they described sequencing the Wuhan-Hu-1 reference genome, the four most abundant leaf nodes in the STAT tree are all different species of Prevotella (even though in the Wu et al. paper they didn't mention anything about a Prevotella coinfection):

$ curl 'https://trace.ncbi.nlm.nih.gov/Traces/sra-db-be/run_taxonomy?cluster_name=public&acc=SRR10971381'>wu.stat
$ jq -r '[.[]|.tax_table[]|.parent]as$par|[.[]|.tax_table[]|select(.tax_id as$x|$par|index($x)|not)]|sort_by(-.total_count)[]|((.total_count|tostring)+";"+.org)' wu.stat|head
171042;Prevotella salivae F0493
155602;Prevotella veroralis F0319
89078;Prevotella scopos JCM 17725
57886;Prevotella melaninogenica D18
54238;Severe acute respiratory syndrome coronavirus 2
51814;Leptotrichia sp. oral taxon 212
41272;Prevotella nanceiensis DSM 19126 = JCM 15639
33716;Homo sapiens
28813;Prevotella veroralis DSM 19559 = JCM 6290
23601;Leptotrichia hongkongensis

Sandeep Chakraborty had already spotted the Prevotella reads in early February 2020, and he has been saying since then that coinfections with anaerobic bacteria like Prevotella may have contributed to COVID deaths. [https://x.com/search?q=from%3Asanchak74+prevotella]

In a paper titled "Metatranscriptomic Analysis Reveals Disordered Alterations in Oropharyngeal Microbiome during the Infection and Clearance Processes of SARS-CoV-2: A Warning for Secondary Infections", the authors wrote the following: [https://www.mdpi.com/2218-273X/13/1/6]

Interestingly, we found that the relative abundance of Prevotella in the PDG was significantly higher than that in the HCG, indicating that SARS-CoV-2 infection is related to Prevotella perturbation, which is consistent with previous findings showing that Prevotella was the main bacterium in the URT of patients with COVID-19 [28]. The relative abundance of Prevotella in the CG was also higher than that in the HCG and PDG, indicating that Prevotella dysbiosis persisted after SARS-CoV-2 clearance in the patients who had recovered from COVID-19, suggesting that exposure to SARS-CoV-2 infection may have a long-term effect on the alterations in oropharyngeal bacteria. This is possibly because the oral cavity is one of the first entry points into the body, and oral pathogens in the lungs can cause pulmonary co-infections; respiratory viral infections increase susceptibility to secondary bacterial infections of the lungs [29,30].

And also in a paper titled "Metatranscriptomic analysis revealed Prevotella as a potential biomarker of oropharyngeal microbiomes in SARS-CoV-2 infection", the authors wrote: [https://www.frontiersin.org/articles/10.3389/fcimb.2023.1161763/full]

One of the most exciting findings of our study is that the relative abundance of Prevotella varied significantly among COVID-19 patients (Pos), patients infected with other viruses (Sus), and healthy volunteers (Ctr). The AUC of 0.669 between the Pos and Sus groups and the AUC of 0.762 between the Pos and Ctr groups indicated that Prevotella could function as a biomarker in distinguishing between patients infected with SARS-CoV-2 and patients infected with other viruses. Previous findings showing that Prevotella was the main bacterium in the URT of COVID-19 patients (Wang et al., 2020) and the decreased abundance of Prevotella in patients with viral respiratory tract infections (influenza A, influenza B, rhinovirus, metapneumovirus, and respiratory syncytial virus) (Edouard et al., 2018) could support our findings. In addition, the relative abundance of Gram-negative bacteria in the Pos group was slightly higher than that in the Sus and Ctr groups. The major bacteria contributing to this phenotype were Prevotella and Bacteroides. The oropharyngeal bacteria in samples with SARS-CoV-2 infection are mainly Gram-negative bacteria, especially Prevotella. This observation is consistent with previous findings showing that Gram-negative pathogens are the major cause of bacterial pneumonia in critical COVID-19 patients (Dudoignon et al., 2021). More importantly, the abundance of Prevotella in the Pos group was significantly and positively correlated with the value of CRP (R = 0.55, p < 0.01), which indicated that Prevotella could function as a biomarker in host immune response evaluation in SARS-CoV-2 infection.

Bacteria in STAT results of metagenomic sequencing runs of early COVID patients

Out of millions of SARS2 sequencing runs at the SRA, the two earliest runs I have found are metagenomic sequencing runs for the WHU01 and WHU02 samples, which were published on January 18th and submitted by Wuhan University. [https://www.ncbi.nlm.nih.gov/bioproject/PRJNA601736]

In the STAT results for the run for WHU01, the fifth most abundant leaf node is Klebsiella pneumoniae, which is the most common cause of bacterial pneumonia, even though the number of Klebsellia pneumoniae reads relative to the number of SARS2 reads is about three orders of magnitude lower than the number of Prevotella reads in the run for Wuhan-Hu-1 ((233/48437)/(654784/54238)). The second most abundant leaf node is Capnocytophaga ochracea which a bacterium that causes sepsis in immunocompromised patients. The third most abundant leaf node is Lautropia mirabilis which is a bacterium that seems fairly harmless based on its Wikipedia page:

48437;Severe acute respiratory syndrome coronavirus 2
1208;Capnocytophaga ochracea
439;Lautropia mirabilis
274;Clostridioides difficile
233;Klebsiella pneumoniae
205;Mycoplasma hominis
133;Escherichia coli
131;Citrus yellow vein clearing virus
106;Veillonella parvula
79;Prevotella salivae F0493

The run for WHU02 also has such a small number of bacterial reads that maybe the WHU01 and WHU02 patients didn't have bacterial pneumonia (or I don't know if the WHU01 and WHU02 samples were sequenced using targeted sequence enrichment, which can result in a huge increase in the ratio of SARS2 reads to other reads):

12459;Severe acute respiratory syndrome coronavirus 2
424;Salmonella enterica
245;Prevotella salivae
196;Clostridioides difficile
193;Lautropia mirabilis
176;Klebsiella pneumoniae
91;Homininae
88;Escherichia coli
60;Pseudomonas viridiflava
48;Veillonella parvula

The WIV04 sample is supposed to have collected on December 30th 2019 from a retailer who worked at the Huanan Seafood Market. [https://trace.ncbi.nlm.nih.gov/Traces/?view=run_browser&acc=SRR11092057&display=metadata] WIV04 has an identical set of mutations to the Wuhan-Hu-1 reference genome, and GISAID actually uses WIV04 as the standard reference genome instead of Wuhan-Hu-1. The STAT results of the metagenomic sequencing run for WIV04 are really weird though, because apart from humans and apes, the most abundant leaf node is Bacillus thuringiensis, which is a soil-dwelling bacterium that is the most commonly used bacterial pesticide worldwide. The next most common species of bacteria is Mycobacterium tuberculosis, which is the cause of tuberculosis, and the fifth most common species of bacteria is Streptococcus pneumoniae, which is a major cause of bacterial pneumonia:

$ curl 'https://trace.ncbi.nlm.nih.gov/Traces/sra-db-be/run_taxonomy?cluster_name=public&acc=SRR11092057'>SRR11092057.stat
$ jq -r '[.[]|.tax_table[]|.parent]as$par|[.[]|.tax_table[]|select(.tax_id as$x|$par|index($x)|not)]|sort_by(-.total_count)[]|((.total_count|tostring)+";"+.org)' SRR11092057.stat|head -n16
1427260;Homo sapiens
11144;Pan troglodytes (chimpanzee; misclassified human reads)
6905;Gorilla gorilla gorilla
5141;Pongo abelii
2844;Pan paniscus
2339;Bacillus thuringiensis (soil bacteria which is the most commonly used pesticide worldwide)
1536;Severe acute respiratory syndrome coronavirus 2
1316;Nomascus leucogenys (gibbon; misclassified human reads)
760;Cercopithecinae (subfamily of monkeys; misclassified human reads)
636;Mycobacterium tuberculosis (cause of TB)
515;Isoptericola variabilis (anaerobic bacterium which was originally isolated from thermites)
276;Colobinae (subfamily of primates; misclassified human reads)
276;Escherichia coli (this was a BALF sample but E. coli is a species of intestinal bacteria)
269;Streptococcus pneumoniae (major cause of bacterial pneumonia)
265;Aegilops tauschii subsp. tauschii (Tausch's goatgrass; often appears as a spurious match in STAT results)
146;Laurasiatheria (suborder of mammals)

I next noticed that Bacillus thuringiensis is also found in WIV02 (SRR11092058), so maybe it's just a contaminant. Here's the most abundant leaf nodes for WIV02 with non-human primates excluded (however the number of bacterial reads is fairly low like in the case of the WIV04, WHU01, and WHU02 samples):

2078070;Homo sapiens
5108;Bacillus thuringiensis (soil bacteria; most common bacterial pesticide in the world)
669;Streptococcus pneumoniae (major cause of bacterial pneumonia)
662;Escherichia coli
193;Severe acute respiratory syndrome coronavirus 2
146;Clostridioides difficile (intestinal bacteria which causes diarrhea)
101;Capnocytophaga (bacteria found in oropharyngeal tract of mammals)
90;Campylobacter concisus (found in human oral cavity)
64;Pelomonas saccharophila (soil bacteria)
51;Cutibacterium acnes (skin bacterium; cause of acne)

There's also a second run for WIV02 (SRR11092063), but it also contains a fairly large number of reads from Bacillus thuringiensis, and when non-human primates are excluded, the 10th most abundant leaf node is Mycobacterium tuberculosis:

21290748;Homo sapiens
22142;Escherichia coli
21021;Gossypium hirsutum (cotton)
18521;Bacillus thuringiensis
10612;Acinetobacter baumannii (opportunistic pathogen which invades people with a weakened immune system; common in hospital-acquired infections)
9731;Spodoptera litura (tobacco cutworm)
5950;Gossypium arboreum (tree cotton)
5649;Stenotrophomonas maltophilia (uncommon bacterium sometimes found in opportunistic infections associated with cystic fibrosis, cancer, or HIV)
5078;Zea mays (maize)
3887;Mycobacterium tuberculosis (cause of TB)
3274;Gossypium raimondii (species of cotton plant)
2518;Saccharomyces cerevisiae S288C
2395;Aegilops tauschii subsp. tauschii (Tausch's goatgrass; commonly included as a spurious match in STAT results)
2302;Succinivibrio dextrinosolvens (anaerobic mesophilic human pathogen)
1405;Clostridium sp. ASBs410
1129;Severe acute respiratory syndrome coronavirus 2 (16th most abundant leaf node when non-human primates are excluded)

It's interesting that WIV02 and WIV04 both matched Mycobacterium tuberculosis which is the cause of TB. The matches be genuine matches because there is estimated to be approximately a million cases of tuberculosis per year in China.

Steve Massey ran Metaxa2 for metagenomic sequencing runs of WIV02, WIV04, WIV05, WIV06, and WIV07, and out of seven groups of respiratory bacteria he checked, Prevotella was dominant in WIV05, WIV06, and WIV07: [https://x.com/stevenemassey/status/1501922742907686912]

However in the STAT results for WIV07-2 (SRR11092059), the most abundant bacterial leaf nodes were all from genera that were missing from Massey's table (I looked at WIV07-2 because it has about 10 times as many reads as WIV07):

3107899;Homo sapiens
1045236;Saccharomyces cerevisiae S288C (brewer's yeast)
949284;Stenotrophomonas maltophilia (uncommon bacterium; also found in WIV02-2 and WIV06-2)
204222;Clostridium sp. ASBs410 (also found in WIV02)
116677;Comamonas terrigena (also one of the most common bacterial leaf nodes in WIV06-2)
94043;Anaerocolumna jejuensis DSM 15929
53919;Clostridium intestinale URNW
49940;Clostridium intestinale DSM 6191
39927;Enterobacter kobei
31257;Acinetobacter sp. ETR1
[... 55 lines omitted ...]
2426;Severe acute respiratory syndrome coronavirus 2

In WIV06-2 (SRR11092060), Stenotrophomonas maltophilia was again the most abundant bacterial leaf node, so it might just be a contaminant (and in the WIV06 run, there were zero STAT hits for Stenotrophomonas maltophilia):

7773456;Homo sapiens
86052;Stenotrophomonas maltophilia (uncommon bacterium; also found in WIV02-2 and WIV07-2)
54101;Saccharomyces cerevisiae S288C (brewer's yeast)
18354;Clostridium sp. ASBs410
10642;Comamonas terrigena (also one of the most common bacterial leaf nodes in WIV07-2)
9373;Bacillus thuringiensis (also found in WIV02-2 and WIV06-2)
9211;Spodoptera litura (tobacco cutworm; also found in WIV02-2)
8578;Anaerocolumna jejuensis DSM 15929
7501;Acinetobacter baumannii
4943;Clostridium intestinale URNW
[... 11 lines omitted ...]
340;Severe acute respiratory syndrome coronavirus 2

Martin Neil's emails about PCR from the Cigarette Smoking Man

Martin Neil posted a Substack article about emails that he received from his anonymous guru in 2020. He introduced the post by writing the following: [https://wherearethenumbers.substack.com/p/the-smoking-man-emails]

Those of you familiar with the cult 90s TV series the X-files will recall the role of the smoking man, who like 'deep throat' in the Watergate scandal, would reveal snippets of the truth to Mulder and Scully at critical points in their shared adventures.

Back in 2020 I had my very own smoking man. He was anonymous but I called him "The Cleric". We started conversing by email around September 2020, after I published some articles in Toby Young's Lockdown Sceptics (LDS) website.

He sent me some long emails about the origins story of the so-called pandemic with a special focus on the virus and PCR testing.

However the emails were full of errors, and Neil introduced some further errors in his Substack post by misinterpreting the emails.

The German Instand report didn't show an overall 9% false positivity rate for PCR tests

Neil linked to a German report from 2020 where they took samples of human cells that had been infected with either SARS2, the human betacoronavirus OC43, the human alphacoronavirus 229E, or that were not infected with a virus, and the samples were sent to different labs which did PCR tests for the samples using COVID tests by various manufacturers. [https://www.instand-ev.de/System/rv-files/340%20EN%20SARS-CoV-2%20Genom%20April%202020%2020200502j.pdf]

Neil wrote that the report showed that the PCR tests had an overall false positivity rate of 9%, but he got the figure of 9% from a table on page 50, which showed that out a total of 182 PCR tests for SARS2 which targeted the RdRp gene, 16 tests returned a positive result for a sample of human cells that had been infected with the human alphacoronavirus 229E:

So just because they got a false positive for a single gene doesn't mean that the whole test would result in a false positive, since most testing kits require a positive result for at least two or three primer and probe sets. And the false positivity rate of samples that contain another coronavirus is probably not indicative of the overall false positivity rate for typical human samples.

On pages 28-31 of the report, there's results for samples of cells that were negative for SARS2 but positive for the human betacoronavirus OC43, and their false positivity rates for different genes were 3/373, 1/46, 2/48, 0/181, 0/100, and 0/64, which gives a total of about 1.0%.

On pages 36-39, there's also results for samples that contained human cells that had not been infected with SARS2 or other viruses, where the false positive ratios for different genes were 2/373, 2/167, 0/46, 0/48, 3/182, 0/100, and 0/64, which gives a total of about 0.7%. (But I believe the Instand report didn't mention how many samples got a false positive for two or more genes so that the overall test would've been positive based on the number of positive genes required by each testing kit.)

And anyway, if PCR tests would have a false positivity rate of 9%, then why has the percentage of positive tests often fallen below 1% in entire countries? The percentage of false positives cannot be higher than the percentage of all positive tests.

Purpose of pansarbecovirus assays in the Corman-Drosten protocol

Cigarette Smoking Man wrote that "the E gene and N gene assays are controls against relatives of SARS-CoV-2 in the larger family of bats". However they were not used as controls but for some reason Corman-Drosten's protocol was designed to detect both SARS2 and other sarbecoviruses. Corman-Drosten wrote that they grew the Frankfurt-1 strain of SARS1 in culture to test their protocol, and they wrote: "Following the rationale that SARS-CoV RNA can be used as a positive control for the entire laboratory procedure, thus obviating the need to handle 2019-nCoV RNA, we formulated the RdRp assay so that it contains two probes: a broad-range probe reacting with SARS-CoV and 2019-nCoV and an additional probe that reacts only with 2019-nCoV." In the preliminary version of their paper, Corman et al. also wrote: "All assays can use SARS-CoV genomic RNA as positive control. Synthetic control RNA for Wuhan virus will be provided shortly." [https://www.who.int/docs/default-source/coronaviruse/wuhan-virus-assay-v1991527e5122341d99287a1b17c111902.pdf?sfvrsn=d381fc88_2] So I don't know if part of the rationale of designing assays that detected both SARS1 and SARS2 was that they were unable to obtain synthetic RNA of SARS2 when they tested their assays.

The Cigarette Smoking Man also wrote: "Including results for E gene, N gene primers, and ORF1a(b) primers (for SARS-CoV-1 RNA), i.e. control primers that detect relatives of SARS-CoV-2, is skewing the statistics, of course." However I don't think SARS1 or other sarbecoviruses have been in circulation in humans during the COVID pandemic, so they won't result in a skew in the statistics either.

The Cigarette Smoking Man also wrote: "These are results for the negative sample, using the RdRP primers specific to SARS-CoV-2". However in the primer and probe set which targets the RdRp gene, the primers were meant to match both SARS2 and SARS1 (even though the reverse primer actually matches only Tor2 but not Wuhan-Hu-1), but there's two different probes and the other probe was designed to only match SARS2 and not SARS1 (even though it also matches some SARS2-like bat viruses which were published after the Corman-Drosten protocol). So it's the probe and not primers that are specific to SARS2.

Claim that Corman-Drosten's primers don't match Wuhan-Hu-1

The Cigarette Smoking Man linked to a page for Wuhan-Hu-1 at GenBank and wrote: "The primer sequences that Dr Drosten chose, and which he claims are specific to SARS-CoV-2, are not found in that genome."

He may have been one of the many people who didn't understand that the primers and probes contain degenerate bases or that the reverse primers match the reverse complement of the genome. So for example in the RdRp_SARSr-F primer, the degenerate base R in GTGARATGGTCATGTGTGGCGG matches A, so the primer matches positions 15431 to 15452 of Wuhan-Hu-1. And the E_Sarbeco_R primer is ATATTGCAGCAGTACGCACACA, but it matches the minus strand, so you have to take the reverse complement by reversing the sequence and swapping A with T and C with G, and then the primer matches positions 26360 to 26381 of Wuhan-Hu-1. This shows you which part of Wuhan-Hu-1 is matched by each primer and probe:

$ printf %s\\n RdRp_SARSr-F:GTGARATGGTCATGTGTGGCGG RdRp_SARSr-P2:CAGGTGGAACCTCATCAGGAGATGC RdRP_SARSr-P1:CCAGGTGGWACRTCATCMGGTGATGC RdRp_SARSr-R:CARATGTTAAASACACTATTAGCATA E_Sarbeco_F:ACAGGTACGTTAATAGTTAATAGCGT E_Sarbeco_P1:ACACTAGCCATCCTTACTGCGCTTCG E_Sarbeco_R:ATATTGCAGCAGTACGCACACA N_Sarbeco_F:CACATTGGCACCCGCAATC N_Sarbeco_P:ACTTCCTCAAGGAACAACATTGCCA N_Sarbeco_R:GAGGAACGAGAAGAGGCTTG|tr : \ >cormandrosten
$ curl -s 'https://eutils.ncbi.nlm.nih.gov/entrez/eutils/efetch.fcgi?db=nuccore&rettype=fasta&id=MN908947.3'>sars2.fa
$ brew install seqkit
[...]
$ tr \  \\t<cormandrosten|while read l;do seqkit tab2fx<<<$l|seqkit locate -idf- sars2.fa;done|sed '1n;/^seqID/d'|column -t
seqID       patternName    pattern                     strand  start  end    matched
MN908947.3  RdRp_SARSr-F   GTGARATGGTCATGTGTGGCGG      +       15431  15452  GTGAAATGGTCATGTGTGGCGG
MN908947.3  RdRp_SARSr-P2  CAGGTGGAACCTCATCAGGAGATGC   +       15470  15494  CAGGTGGAACCTCATCAGGAGATGC
MN908947.3  E_Sarbeco_F    ACAGGTACGTTAATAGTTAATAGCGT  +       26269  26294  ACAGGTACGTTAATAGTTAATAGCGT
MN908947.3  E_Sarbeco_P1   ACACTAGCCATCCTTACTGCGCTTCG  +       26332  26357  ACACTAGCCATCCTTACTGCGCTTCG
MN908947.3  E_Sarbeco_R    ATATTGCAGCAGTACGCACACA      -       26360  26381  ATATTGCAGCAGTACGCACACA
MN908947.3  N_Sarbeco_F    CACATTGGCACCCGCAATC         +       28706  28724  CACATTGGCACCCGCAATC
MN908947.3  N_Sarbeco_P    ACTTCCTCAAGGAACAACATTGCCA   +       28753  28777  ACTTCCTCAAGGAACAACATTGCCA
MN908947.3  N_Sarbeco_R    GAGGAACGAGAAGAGGCTTG        -       28814  28833  GAGGAACGAGAAGAGGCTTG

The Corman-Drosten protocol includes 13 primer and probe sequences, but 2 of them actually don't match Wuhan-Hu-1, because RdRp_SARSr-R has one mismatch from Wuhan-Hu-1 and RdRP_SARSr-P1 has two mismatches from Wuhan-Hu-1, even though both of them have zero mismatches from Tor2:

$ egrep 'RdRp_SARSr-R|RdRP_SARSr-P1' cormandrosten|tr \  \\t|seqkit tab2fx|seqkit locate -f- -m4 sars2.fa|cut -f2-|column -t
patternName    pattern                     strand  start  end    matched
RdRP_SARSr-P1  CCAGGTGGWACRTCATCMGGTGATGC  +       15469  15494  CCAGGTGGAACCTCATCAGGAGATGC
RdRp_SARSr-R   CARATGTTAAASACACTATTAGCATA  -       15505  15530  CAAATGTTAAAAACACTATTAGCATA
$ curl -s 'https://eutils.ncbi.nlm.nih.gov/entrez/eutils/efetch.fcgi?db=nuccore&rettype=fasta&id=NC_004718.3'>sars1.fa
$ egrep 'RdRp_SARSr-R|RdRP_SARSr-P1' cormandrosten|tr \  \\t|seqkit tab2fx|seqkit locate -df- sars1.fa|cut -f2-|column -t
patternName    pattern                     strand  start  end    matched
RdRP_SARSr-P1  CCAGGTGGWACRTCATCMGGTGATGC  +       15399  15424  CCAGGTGGAACATCATCCGGTGATGC
RdRp_SARSr-R   CARATGTTAAASACACTATTAGCATA  -       15435  15460  CAAATGTTAAAGACACTATTAGCATA

(In seqkit the -d flag which matches degenerate bases cannot be used together with the -m flag which allows mismatches, so I used -m4 which allows 4 mismatches in the first command above because the degenerate bases are treated as mismatches even though there's actually only 2 mismatches.)

It's an unsolved mystery why the RdRp reverse primer and first probe for RdRp don't match Wuhan-Hu-1, and I don't know if it was simply a mistake in the design of the assay. But it should rather result in false negative test results and not false positives.

Did Corman et al. design their protocol based on Wuhan-Hu-1 or other early sequences from GISAID?

Cigarette Smoking Man was wondering where Corman et al. obtained the sequence of SARS2 they used to design the primers, but then he noticed that on a list of acknowledgements in the preliminary version of the paper by Corman et al. which was dated January 13th, they first listed Chinese institutes which had submitted SARS2 sequences to GISAID: "We acknowledge the originators of sequences in GISAID (www.gisaid.org): National Institute for Viral Disease Control and Prevention, China, Institute of Pathogen Biology, Chinese Academy of Medical Sciences, Peking Union Medical College, China, and Wuhan Jinyintan Hospital Wuhan Institute of Virology, Chinese Academy of Sciences, China). We acknowledge Professor Yong-Zhen Zhang, Shanghai Public Health Clinical Center & School of Public Health, Fudan University, Shanghai, China for release of another sequence (MN908947)."

So therefore Cigarette Smoking Man concluded that "the virus RNA of, allegedly, SARS-CoV-2 was therefore derived from a database upload in GISAID by Chinese researchers". However Corman et al. actually wrote that the protocol was initially designed based on Wuhan-Hu-1 (which was sequenced by Zhang's team and which was published on the virological.org forum before GISAID), and Corman et al. wrote that sequences uploaded to GISAID were later used to confirm the protocol: "Upon release of the first 2019-nCoV sequence at virological.org, three assays were selected based on how well they matched to the 2019-nCoV genome (Figure 1). The alignment was complemented by additional sequences released independently on GISAID [https://www.gisaid.org], confirming the good matching of selected primers to all sequences." So just because Corman et al. acknowledged the people who submitted the sequences to GISAID first and Zhang later, it doesn't imply that the protocol wasn't designed primarily based on Zhang's sequence.

Matches to primers in metagenomic reads from Aral Sea soil samples

The Cigarette Smoking Man wrote: "A research team from the University of Graz collected random sea water from the Aral sea in Kazakhstan, and ran popular RT-PCR screening kits against the sea water." However it wasn't seawater but samples from the dried-out basin of the Aral Sea. And they didn't run PCR kits against the samples but they checked which sequencing reads matched the primers by using the Bowtie2 short read aligner.

The paper about the Aral Sea samples included the table below, where the caption said: "Two exact WH-NIC N-P alignments were detected, all other alignments were reported with one mismatch." [https://digital.csic.es/bitstream/10261/217720/1/Highly%20matching_Mora.pdf] So most of the primers didn't even have an exact match. And the WH-NIC N-P probe which had two exact matches is only 16 bases long.

One of the two samples from the Aral Sea was called A53, and the sequencing run for the sample has 112,791,242 reads that are all 150 bases long. In the simplified scenario where we assume that the reads and the probe both consist of random nucleotide sequences, the likelihood that a single 150-base read has an exact match to the 16-base probe is 2*(150-(16-1))/4^16, or about 7e-8, since the number of 16-base subsegments of the 150-base read is 135, and each subsegment can match the probe on either the forward or reverse strand. And because there are about 100 million reads, the likelihood that any of them matches the 16-base probe is 112791242*2*(150-(16-1))/4^16 or about 7.1.

In 2020 people were making a big deal out of how in a PCR protocol developed by Institut Pasteur, an 18-base reverse primer matched human chromosome 8 (CTCCCTTTGTTGTGTTGT). However 4^18 is only about 7e10, and the length of the human genome is about 3.1 billion bases, then the likelihood that a random 18-base sequence would match a random sequence of 3.1 billion bases on either strand would be 2*(3.1e9-17)/4^18 or about 9%.

In order for the PCR test to yield a positive result, it's not enough that there's only a match for the reverse primer, but the forward primer also needs to match, and the forward primer has to be located fairly close to the reverse primer, and the probe between the two primers also has to match. So therefore it doesn't matter that the single primer sequences are fairly short because the combined length of the two primers and probe is much longer. It's explained in a series of two YouTube videos about the Institut Pasteur reverse primer from 2020. [https://www.youtube.com/watch?v=O2TTKM1NWDA, https://www.youtube.com/watch?v=qOhqy-cxL0Y] (Or actually if only the reverse primer matches but not the forward primer, I believe the PCR test typically doesn't produce enough copies of the amplicon for the probe to be detected since the number of copies won't get doubled on each cycle, but I don't know if the probe might in some cases be detected.)

You can run the following code to download the reads for the A53 sample and find reads which have an exact match to the 16-base WH-NIC N-P probe:

$ curl -s 'https://www.ebi.ac.uk/ena/portal/api/filereport?accession=ERR4194679&result=read_run&fields=fastq_ftp'|sed 1d|cut -f2|tr \; \\n|sed s,^,ftp://,|xargs wget -q
$ seqkit locate -p CAACTGGCAGTAACCA ERR4194679_1.fastq.gz|cut -f1,3-|column -t
seqID                pattern           strand  start  end  matched
ERR4194679.13720275  CAACTGGCAGTAACCA  -       62     77   CAACTGGCAGTAACCA
ERR4194679.14269050  CAACTGGCAGTAACCA  -       100    115  CAACTGGCAGTAACCA
ERR4194679.14269069  CAACTGGCAGTAACCA  -       100    115  CAACTGGCAGTAACCA
ERR4194679.30611989  CAACTGGCAGTAACCA  +       123    138  CAACTGGCAGTAACCA
ERR4194679.43340398  CAACTGGCAGTAACCA  +       128    143  CAACTGGCAGTAACCA
ERR4194679.44791000  CAACTGGCAGTAACCA  -       106    121  CAACTGGCAGTAACCA
$ seqkit locate -p CAACTGGCAGTAACCA ERR4194679_2.fastq.gz|cut -f1,3-|column -t
seqID                pattern           strand  start  end  matched
ERR4194679.3661133   CAACTGGCAGTAACCA  -       88     103  CAACTGGCAGTAACCA
ERR4194679.11248038  CAACTGGCAGTAACCA  -       15     30   CAACTGGCAGTAACCA
ERR4194679.15359392  CAACTGGCAGTAACCA  -       73     88   CAACTGGCAGTAACCA
ERR4194679.36444002  CAACTGGCAGTAACCA  -       15     30   CAACTGGCAGTAACCA
ERR4194679.36756083  CAACTGGCAGTAACCA  +       74     89   CAACTGGCAGTAACCA
ERR4194679.43340398  CAACTGGCAGTAACCA  -       75     90   CAACTGGCAGTAACCA
ERR4194679.44029797  CAACTGGCAGTAACCA  +       28     43   CAACTGGCAGTAACCA
ERR4194679.47817108  CAACTGGCAGTAACCA  -       87     102  CAACTGGCAGTAACCA
ERR4194679.52144769  CAACTGGCAGTAACCA  -       11     26   CAACTGGCAGTAACCA
ERR4194679.53599231  CAACTGGCAGTAACCA  -       88     103  CAACTGGCAGTAACCA

So I actually found 6 exact matches in the forward reads and 10 exact matches in the reverse reads, so I don't know why Mora et al. wrote that they found only two exact matches for the WH-NIC N-P probe. So they may have actually found an exact match for other primers and probes as well, even though their Table 1 showed that they only found an exact match for the WH-NIC N-P probe.

Rancourt's paper about southern-hemisphere and equatorial countries

In September 2023, Denis Rancourt and his coauthors published a paper titled "COVID-19 vaccine-associated mortality in the Southern Hemisphere". [https://correlation-canada.org/covid-19-vaccine-associated-mortality-in-the-southern-hemisphere/]

All-cause mortality before vaccine rollout

Rancourt wrote: "Nine of the 17 countries have no detectable excess ACM in the period of approximately one year after a pandemic was declared on 11 March 2020 by the World Health Organization (WHO), until the vaccines are rolled out (Australia, Malaysia, New Zealand, Paraguay, Philippines, Singapore, Suriname, Thailand, Uruguay)." [https://denisrancourt.substack.com/p/covid-19-vaccine-associated-mortality]

However according to OWID which uses excess mortality data from the World Mortality Database, Paraguay had about 30% excess mortality in February 2021 even though only about 0.2% of people were listed as vaccinated at the end of the month, and two months later in April 2021 Paraguay had about 136% excess mortality even though only about 1.8% of people were listed as vaccinated at the end of the month. And Philippines had about 37% excess mortality in April 2021 even though only about 1.4% of people were listed as vaccinated at the end of the month. And conversely in Singapore the first big increase in excess mortality came only in October 2021, but 50% of people had already been vaccinated by June 18th.

In Australia the PCR positivity rate remained below 2% until the week ending December 26th 2021, and three weeks later the positivity rate had jumped up to about 45%, but in Australia the weekly excess mortality percent also remained below 10% until January 2022 when it peaked at about 27%. So the first big increase in excess mortality came almost almost a year after the jabs were rolled out but at the same time when there was the first big increase in PCR positivity rate (just like what happened later in 2022 in Hong Kong and Taiwan).

In Malaysia, Thailand, and Uruguay, the first big increase in excess mortality also coincided with the first big increase in PCR positivity rate (R code):

Out of the countries which already had high excess mortality in 2020, for example in Bolivia excess mortality peaked at about 245% in July 2020 the same month when PCR positivity rate peaked at about 58%, in Chile excess mortality peaked at about 52% in June 2020 the same month when PCR positivity rate peaked at about 31%, in Colombia excess mortality peaked at about 61% in August 2020 the same month when PCR positivity rate peaked at about 31%, and in South Africa excess mortality peaked at about 42% the same month when the PCR positivity rate peaked at about 25% (R code):

Mortality by age group in Peru

On pages 86-91 of Rancourt's paper which display the weekly number of deaths and vaccines in Peru by age group, you can see that the peak in deaths in early 2021 occurs around the same time in all age groups, even though older age groups got vaccinated earlier so the peak in the number of new vaccines was around April in the age group 90+ but around September for the age group 30-39. So it appears to indicate that the deaths were not caused by the vaccines, especially since in younger age groups there were almost no new vaccines given at the time when the deaths peaked. And next around January-February 2022 there was another spike in deaths in Peru which also occurred around the same time in all age groups, and even though it roughly conincided with a wave of vaccinations in younger age groups, the wave of vaccinations occurred much earlier in older age groups:

From the plot below you can see that in early 2021 when Peru had a large wave in excess mortality with two dintict peaks, the curves for COVID deaths and PCR positivity rate also had similar shape with two peaks. And around January-February 2022 when there was a short-lived spike in excess deaths which soon returned back to around zero, there were similar short-lived spikes in PCR positivity rate and COVID deaths:

Excess mortality has higher correlation with daily PCR positivity rate than daily number of new vaccines

I also selected countries from Rancourt's paper which had data at OWID for all three variables out of excess mortality, PCR positivity rate, and daily number of new vaccines, which only resulted in Brazil and New Zealand in being excluded. Then I extrapolated weekly and monthly variables into daily variables and I applied a 7-day moving average to all variables. Then I calculated the correlation coefficient of excess mortality with both PCR positivity rate and with the daily number of new vaccines, so that I ignored days where either of the two variables being compared were missing data (so that I did not treat the daily number of new vaccines before the vaccine rollout as zero).

The correlation between excess deaths and PCR positivity rate was above 0.4 for all countries except Argentina, where it was a bit under 0.4, and the correlation was over 0.7 in 8 different countries with the highest being Uruguay (0.83). But the correlation between excess mortality and the daily number of new vaccines was negative for 7 countries and positive for 8 countries, and it was over 0.7 for only a single country which was Malaysia (R code):

Plots for all 17 countries that include PCR positivity rate and COVID deaths

The plots for each country in Rancourt's paper only displayed excess mortality and new vaccine doses given, but here's plots which also show COVID deaths and PCR positivity rate:

The spikes in excess deaths coincide with spikes in COVID deaths, but if the COVID deaths were actually caused by the vaccines, then why would people get a COVID diagnosis because of a vaccine injury? Was it that they just got a positive PCR test when they were hospitalized for their vaccine injury, in the case that the tests result in a large percentage of false positives? But then why do many countries have periods when the positivity rate has fallen close to zero? And if the PCR tests are not picking up any real virus but they just randomly return false positives, then why is the percentage of positive tests not more uniform across time?

In many Southern American countries, the COVID deaths, excess deaths, and PCR positivity rate all fell close to zero around September 2021, even though some of the countries had a large number of new vaccines given around the same time. For example in Chile the PCR positivity rate went from less than 1% in September 2021 to about 32% in February 2022, and at the same time excess mortality went from about 3% in September 2021 to about 63% in February 2022. And a similar pattern was also followed by Peru, Bolivia, Paraguay, Uruguay, and Argentina.

Countries with a lower percentage of vaccinated population had higher excess mortality in 2021

The plot below shows that countries that had a lower average percentage of vaccinated population in 2021 tended to have higher average excess mortality in 2021, with a correlation coefficient of about -0.47 (R code). Out of the four Asian countries, Singapore had both the highest vaccinated percent and the lowest excess mortality but Philippines had both the lowest vaccinated percent and highest excess mortality. And in South America the two countries with the highest vaccinated percent were Uruguay and Chile, but they were also the two countries with the lowest excess mortality. (I only looked at data from 2021 because OWID is missing vaccination data for many countries in 2022.)

I also tried making similar plots for the whole world, but I also looked at the correlation between PCR positivity rate and excess mortality, so I only included countries that had data in 2021 for excess mortality, PCR positivity rate, and cumulative number of vaccine doses per hundred. I only included countries with population over 5 million. From the plots below you can see that out of the South American countries which met my criteria, Chile had the lowest percentage of positive PCR tests, lowest excess mortality, and highest number of vaccine doses per 100. Countries and jurisdictions where both the PCR positivity rate and excess mortality percent were close to zero were Australia, Hong Kong, Taiwan, and South Korea, but their average cumulative number of vaccine doses per hundred was around 40-60. Countries where the average cumulative vaccine doses per hundred was below 30 are South Africa, Guatemala, Ukraine, Palestine, Philippines, and Bulgaria, but they all had above 20% excess mortality in 2021. So it seems like low excess mortality was rather caused by a low PCR positivity rate than a low number of vaccines.

Article by Children's Health Defense

Children's Health Defense published an article about Rancourt's paper. [https://childrenshealthdefense.org/defender/covid-vaccine-rollouts-all-cause-mortality/]

The article said: "They also found that all 17 countries, which make up 10.3% of the global population, had an unprecedented rise in all-cause mortality that corresponded directly to vaccine and booster rollouts." However in Ecuador and Bolivia the highest excess mortality was in 2020 before the jabs were rolled out. So if Ecuador and Bolivia had further spikes in excess deaths after the jabs were rolled out, then were the spikes "unprecedented" since there had already been a bigger spike in 2020?

The article also repeated the claim that in 9 out of 17 countries there was "no detectable excess mortality in the year or so between when a pandemic is announced on 11 March 2020 and the starting time of the first vaccine rollout in each country". However one of the 9 countries was Paraguay, where the excess mortality reported by OWID increased from about -13% in June 2020 to about 22% in September 2020, and around the same time the PCR positivity rate increased from about 2% to about 30% and the daily number of COVID deaths increased from about 0 to about 20. And another of the 7 countries was Suriname, which also had an increase in excess deaths around August 2020 which coincided with bumps in both PCR positivity rate and COVID deaths.

The article said: "However, the researchers said, 'In all 17 countries, vaccination is associated with a regime of high mortality, and there is no association in time between COVID-19 vaccination and proportionate reduction in ACM.'" However for example in Peru, there were two huge spikes in excess mortality before the jabs were rolled out, but in January-February 2022 when the percentage of vaccinated people had reached about 70-80%, there was a third spike in excess mortality, but the third spike ended up being much lower than the two previous spikes even though the maximum PCR positivity rate was higher than during the two previous spikes. (It might be that people in Peru already had natural immunity at the time of the third spike, but the reduced magnitude of the spike would still be "associated" with a higher vaccination rate even if the association would not be causal.)

The article also said: "Also, all 17 countries showed a strong correlation with higher rates of ACM in early 2021, following the initial vaccine rollout and in early 2022, when the boosters were rolled out." However in Australia, New Zealand, and Singapore, the excess mortality remained flat for most of 2021, and in New Zealand it even decreased steadily from January 2021 until September 2021.

(But apparently the author of the CHD article had a Ph.D. in "human geography". Someone with an education in mathematics or hard sciences would be more wary of claiming that some statement is true for all 17 elements in a set, since the claim will be false if there is even one element in the set for which the statement is false.)

Claim that no COVID measures or responses were performed synchronously all over the world around January-February 2022

Rancourt et al. blamed the excess deaths around January-February 2022 on the vaccines, but on page 121 there's a list where they dismiss alternative explanations for the deaths. One entry on the list says: "The peaks are due to aggressive Covid measures, treatments or responses (other than vaccine booster administration) applied in January-February 2022." For which the answer is: "Unlikely. Covid measures, treatments or responses vary widely from jurisdiction to jurisdiction, as do the demographics of the populations at highest risk (e.g., Johnson and Rancourt, 2022). No measures, treatments or responses were uniformly and synchronously applied in January-February 2022 in the equatorial regions and the Southern Hemisphere."

Out of the 17 countries in Rancourt's paper, there's only 5 countries that have data at OWID in early 2022 for either the number of patients hospitalized for COVID or the number of new hospital admissions for COVID. The five countries are Australia, Bolivia, Chile, Malaysia, and South Africa, but all of them had a spike in the number of patients hospitalized for COVID around January or February 2022. (In Malaysia the peaks for hospitalized patients, excess deaths, PCR positivity, and COVID deaths only occurred in early March, but there had already been a large increase in all statistics in Malaysia in February, so I think you can still say that the peaks occurred "around" February 2022.)

For example in Chile the peak in the weekly number of hospital admissions was about 3,500 in February 2022 and about about 4,500 in June 2020, but the peak in weekly excess mortality was about 63% in both June 2020 and February 2022. And since Rancourt presumably blames the deaths in June 2020 on the "protocols", then how can he know that the deaths in February 2022 were not also caused by the protocols?

When I asked Joel Smalley why spikes in PCR positivity rate coincided with spikes in excess mortality, he said it was because people received deadly treatment as a result of a positive PCR test. So in Rancourt's model couldn't that also explain the wave of deaths that occurred all over the world around January or February 2022? Apart from Malaysia and Brazil which don't have data for PCR positivity rate at OWID, all countries in Rancourt's paper had a spike in PCR positivity rate around January or February 2022.

Dismissing the possibility of a deliberate release of Omicron

Rancourt et al. dismissed the following explanation for why there was a global spike in deaths around January and February 2022: "The peaks are due to the emergence of one or more variant(s) of SARS-CoV-2 causing synchronous mortality peaks in January-February 2022, across the equatorial regions and the Southern Hemisphere." To which the answer was: "Unlikely. Epidemiological theory of a contact-spreading viral respiratory disease predicts a wide range of delay (months, years) between seeding of a new variant and measurable exponential growth of mortality (or peak of new infections), depending sensitively on characteristics of the society (e.g., Parham and Michael, 2011; Hasegawa and Nemoto, 2016; Ma et al., 2022)." And next Rancourt et al. wrote: "Regarding the theory of emergence of one or more variant(s) of SARS-CoV-2, this emergence would have to cause simultaneous peaks and surges of mortality in 17 countries across 4 continents (Figure 1, Figure 2, Figure 4, Figure 11, Figure 14, Figure 18), which is a statistically impossible occurrence if we accept the theories of spontaneous viral mutations and contact spreading of viral respiratory diseases; and all the resulting peaks of mortality would have the remarkable coincidence of occurring precisely when vaccine boosters were rolled out."

However Rancourt et al. failed to address the scenario that there was a deliberate release of Omicron all over the world.

The dominant strain of Omicron in 2023 has been XBB.1.5, but if you compare a consensus sequence of XBB.1.5 spike proteins to Wuhan-Hu-1, there's 40 nonsynonymous mutations but only one synonymous mutation, which results in a dN/dS ratio of 40:

$ curl -s https://data.nextstrain.org/files/ncov/open/global/metadata.tsv.xz|gzip -dc>global.tsv # use `xz -dc` if not on macOS
$ curl -s https://data.nextstrain.org/files/ncov/open/global/aligned.fasta.xz|gzip -dc>global.fa
$ brew install seqkit
[...]
$ wget -q https://www.hiv.lanl.gov/repository/aids-db/PROGS/Snap/SNAP.pl
$ awk -F\\t '$21~/XBB.1.5$/' global.tsv|cut -f1|seqkit grep -f- global.fa|seqkit seq -s|awk -F '' '{for(i=1;i<=NF;i++)a[i][$i]++}END{for(i in a){max=0;for(j in a[i])if(a[i][j]>max){max=a[i][j];o=j}printf"%s",o};print""}'|cat - <(seqkit grep -nrp Wuhan-Hu global.fa|seqkit seq -s)|cut -c21563-25384|awk '{print NR,$0}'|perl SNAP.pl -
[...]
$ awk 'NR>2{s+=$7;n+=$8}END{print n,s}' $(ls -t codons.*|sed 1q)
40 1

However the plot below shows that in my multiple sequence alignment of the spike proteins of SARS2-like sarbecoviruses, the spike protein of BANAL-52 has 175.5 synonymous mutations but only 19.5 nonsynonymous mutations, which results in a dN/dS ratio of about 0.11. So relative to Wuhan-Hu-1, XBB.1.5 has 369 times higher dN/dS ratio than BANAL-52. And XBB.1.5 has already around twice as many nonsynonymous spike mutations as BANAL-52.

And here's also SNAP results for pairwise alignments of Wuhan-Hu-1 against the XBB.1.5 consensus and BANAL-20-52:

In contrast, when I compared 99 sequences of SARS1 to the Tor2 reference genome of SARS1, there were a total of 805 nonsynonymous mutations and 226 nonsynonymous mutations, which results in a total dN/dS ratio of about 3.6. [https://cdn.discordapp.com/attachments/1093243194231246934/1118529476079403162/sars-1-spike-syn-nonsyn.png] And when I downloaded sequences of HA proteins of H1N1 samples from 2009-2010 from Finland and I compared one randomly selected sample to other samples, the dN/dS ratios ranged from about 0.2 to 1.2. [https://cdn.discordapp.com/attachments/1093243194231246934/1119605287440097280/h1n1-swine-flu-finland-snap-syn-nonsyn.png] In 2017 in China there was an outbreak of swine acute diarrhea syndrome coronavirus (SADS-CoV) which was supposed to have jumped from bats to pigs, so SADS-CoV is supposed to have recently jumped from one host to another like what's the official story about SARS-CoV-2, but when I compared the spike protein of one randomly selected SADS-CoV sample to 31 other samples, there were a total of 47 nonsynonymous mutations and 24 synonymous mutations which resulted in a total dN/dS ratio of about 1.96. [https://media.discordapp.net/attachments/1093243194231246934/1132016833994694767/sads-snap-spike-syn-nonsyn.png] And when I compared spike proteins of the human betacoronavirus OC43 to one randomly selected OC43 sample, I got dN/dS ratios of around 1-3. [https://media.discordapp.net/attachments/1093243194231246934/1115983869980717136/oc43-spike-syn-nonsyn.png]

In a Twitter thread in 2021, NextStrain's lead developer Trevor Bedford wrote: "Focusing on S1, we calculate a common metric called dN/dS that compares nonsynonymous mutations to synonymous mutations. We find that dN/dS in S1 increases through time during the pandemic with the most recent timepoint showing dN/dS of ~2.1. This is a fast pace of adaptive evolution and it's rare to observe such a strong signal. HA1 in influenza H3N2 as the canonical example of an adaptively evolving viral protein shows dN/dS of ~0.4, or about 5 times lower than what's currently being observed in SARS-CoV-2." [https://x.com/trvrb/status/1437519259765075970] However if you look at the whole spike instead of just the S1 subunit, XBB.1.5 variants have dN/dS ratios of 40 or higher, which is about two orders of magnitude higher than the ratio of H3N2 that Bedford mentioned in his tweet.

The Alpha, Delta, BA.1, and BA.2 variants all emerged in a "saltation event" where there was a genetic jump where multiple new spike mutations appeared simultaneously out of nowhere. There's tens of millions of published sequences of SARS2, so it's unusual that the evolutionary missing links between new VOCs and earlier variants have not been found. One of the people on Twitter who is specialized in researching variants is Shay Fleishon, who said that "All variants shaping this pandemic (except D614G) were evolved in a genetic jump (saltation)". [https://x.com/shay_fleishon/status/1523568918149070848] Trevor Bedford has suggested that the BA.1, BA.2, and BA.3 variants all developed inside the body of a single immunocompromised individual over the course of approximately a year. [https://x.com/trvrb/status/1349774308202094594] Ryan Hisner also wrote about the sample EPI_ISL_15829108 that "It's not uncommon to see very high percentages of non-synonymous mutations in chronic-infection sequences. A recent chronic-infection sequence had 36 nucleotide mutations in spike, and 34 were non-synonymous." [https://x.com/LongDesertTrain/status/1635062054473306112]

However I believe there may have been a program where they released a series of VOCs deliberately to extend the lifespan of the COVID pandemic, so the story about Omicron-like strains emerging out of chronic infections may have been put out as a cover story, so that there would be some explanation why new VOCs had extremely high dN/dS ratios and why they had multiple new mutations that appeared simultaneously out of nowhere.

Valentin Bruttel has pointed out that before Omicron emerged, the new mutations in Omicron had either appeared in variants that were not ancestral to Omicron or they had been described in papers about subjects like vaccine development, so Bruttel suggested that Omicron may have been a strain that was developed for a pan-variant vaccine. [https://x.com/search?q=from%3Avbruttel%20nonsynonymous] Alexandros Marinos has suggested that the major new variants that appeared in early 2021 and late 2020 all emerged near locations where there was an Astra-Zeneca vaccine trial. [https://x.com/alexandrosM/status/1677100005772132354]

One overlooked anomaly in the genome of SARS2 is that in the nucleocapsid protein of B.1.1, Alpha, BA.1, and BA.2, there's an unusual series of three consecutive nucleotide changes at positions 28881-28883. A similar phenomenon was not previously known to occur in nature, so the author of a Japanese paper had to coin a new term to describe the phenomenon: "In the present study, the presence of a possible new type of gene mutation, an en bloc exchange of short consecutive bases, was reported at two sites in the SARS-CoV-2 N gene. The possibility of coincidental accumulation of single nucleotide substitutions or overlapping indels was ruled out in the present study by performing a comprehensive BLAST sequence search and GISAID database search for each conceivable intermediating sequence linking the original strain and mutants with trinucleotide substitutions. Consequently, the observed trinucleotide substitutions in the SARS-CoV-2 N gene may imply a novel type of mutation, which is different from previously known traditional mutations, such as point mutations, insertions, deletions, inversions, duplications, translocations, or recombinations (Gu et al. 2008; Lee et al. 2012)." [https://www.jstage.jst.go.jp/article/tjem/260/1/260_2023.J010/_html/-char/en]

There's also 2 spike deletions in Alpha (21765-21770 and 21992-21994), 1 in Delta (22029-22034), 3 in BA.1 (21765-21770, 21987-21995, 22194-22196), and 1 in BA.2 (21633-21641). Apart from one deletion in BA.1 which is shared with Alpha, the other deletions were all novel when the VOC emerged. In the same 4 variants, there's a total of only 1 unique synonymous mutation in the spike, so there's 6 times as many deletions as synonymous mutations. But in contrast if you compare the spike protein BANAL-52 to Wuhan-Hu-1, there's 176 synonymous mutations but only one block of inserted or deleted bases.

However I'm not sure if the mainstream theory that VOCs emerged out of chronic infections is correct or not. One thing that makes it seem more plausible is that Shay Fleishon has compiled a table of about 40,000 suspected cases of a chronic infection at GISAID, where there are two or more submissions at GISAID which appear to represent different stages of a chronic infection because the later submissions contain sets of mutations which are included in the earlier submissions, and because the personal metadata like age and gender of the later submissions matches the earlier submissions. [https://docs.google.com/spreadsheets/d/1GqukNJV_J2hB-O5lNySYawEhRr2l1yB1WAePQX1PoTo/] (But then again the submissions at GISAID could have been faked in order to support the theory that the VOCs had a natural origin.)

Even in the scenario where there was no deliberate release of Omicron, Omicron could've spread around the world faster than the Wuhan strain because it had a higher R₀ value. In a spreadsheet where Charles Rixey compiled R₀ estimates of viruses from different sources, he listed the R₀ value for Omicron as 9.5 compared to 5.6 for the Wuhan strain. [https://rumble.com/v3m7w9r-sars-aerosol-dynamics-and-swarm-stability-mechanisms-for-human-spread-charl.html?start=2211, time 36:58] (Initial estimates for the R₀ value of the Wuhan strain in 2020 were lower, but the R₀ value has later been revised upwards.)

Claim that spikes in excess mortality in January-February 2022 were unprecedented

Rancourt's paper said: "Unprecedented peaks in ACM occur in the summer (January-February) of 2022 in the Southern Hemisphere, and in equatorial-latitude countries, which are synchronous with or immediately preceded by rapid COVID-19-vaccine-booster-dose rollouts (3rd or 4th doses). This phenomenon is present in every case with sufficient mortality data (15 countries). Two of the countries studied have insufficient mortality data in January-February 2022 (Argentina and Suriname)."

I don't know if the reason why the peaks are supposed to be "unprecedented" is that they occurred in the southern-hemisphere summer. But I don't know how unprecedented the peaks were, because in Colombia, Peru, and South Africa, there was a higher peak in excess deaths in January-February 2021 than in January-February 2022 (at least according to OWID's excess mortality data from the World Mortality Dataset). And Bolivia also had higher excess mortality in January 2021 than January 2022 even though Bolivia is missing data for February 2022 at OWID:

Plots for age-stratified mortality in Chile

Rancourt et al. wrote that there was a peak in excess mortality in Chile in July-August 2021: "Detailed mortality and vaccination data for Chile and Peru allow resolution by age and by dose number. It is unlikely that the observed peaks in all-cause mortality in January-February 2022 (and additionally in: July-August 2021, Chile; July-August 2022, Peru), in each of both countries and in each elderly age group, could be due to any cause other than the temporally associated rapid COVID-19-vaccine-booster-dose rollouts."

However in the plots by age group for Chile on pages 72 to 75, I don't see any peak in all-cause mortality in July-August 2021 that coincides with a vaccine rollout. The peak in weekly deaths occurs around July or late June 2021, but a new vaccine dose is introduced only about 2 months later in August or September, and there is a sharp decrease in excess mortality around the time when the new vaccine dose is introduced:

In Chile the 4th dose coincided with a spike in deaths caused by Omicron. The 4th dose was given a bit later to younger age groups than older age groups, but the spike peak in deaths caused by Omicron occurred around the same time in all age groups, so the number of 4th doses given peaked before deaths in older age groups but after deaths in younger age groups.

At OWID the peak in excess mortality in 2021 in Chile occurs a few month earlier than in Rancourt's plot, but I think it's because OWID's excess mortality data is adjusted for seasonality but Rancourt's plots just display the raw number of weekly deaths, so at OWID there's lower seasonality-adjusted excess mortality during the winter:

Rancourt's paper included a series of age-stratified plots for two countries, which were Chile and Peru, but he included plots for all age groups in Peru but only for ages 60 and above in Chile. The reason why Rancourt omitted the plots for younger age groups in Chile may have been if the deaths in younger age groups occurred before the vaccine doses in mid-2021 or early 2022 were rolled out, because then he wouldn't have been able to blame the deaths on the vaccines. I asked him why he omitted the plots but he didn't answer me.

I couldn't figure out how to download data from the website of the Chile DEIS which Rancourt cited as the source of his age-stratified data for Chile. [https://deis.minsal.cl/] When I try to click on the links on the website, it just loads indefinitely or times out, and nothing happens when I click on the "open data" link. I didn't have better luck trying to access the website through the Wayback Machine either.

High vaccine dose fatality rate in Chile for the fourth dose

Rancourt calculates his "vaccine dose fatality rate" metric by looking at the number of all-cause deaths after a new vaccine dose is introduced without attempting to account for COVID deaths. His paper included the plot below which showed that the ratio of the vaccine dose fatality rate between the fourth and third dose was much higher in Chile than in Peru:

However the fourth dose was rolled out earlier in Chile than Peru, so it coincided with the spike in deaths caused by Omicron in Chile but not Peru.

Neil, Engler, and Fenton: The puzzle of Australia's respiratory mortality season 2020

Why was the outbreak around July 2020 mostly limited to Victoria?

The Three Stooges wrote: [https://wherearethenumbers.substack.com/p/the-puzzle-of-australias-respiratory]

The first explanation is not credible given that Victoria state in Australia suffered a covid peak in July - August 2020, yet the state next door, New South Wales, did not. For this to make sense we would have to believe viruses stop at borders or that the lockdowns and border restrictions are dramatically effective. Evidence to date is overwhelming that neither of these can be true. Where did this highly infectious virus go after 'landing' in Victoria in 2020?

Taiwan is somewhat similar to Australia in the sense that they were almost free of COVID until 2022, but they had a minor outbreak in the summer of 2021, which may have started among the crew members of an airline company according to Wikipedia: "However, an outbreak among Taiwanese crew members of the state-owned China Airlines in late April 2021 led to a sharp surge in cases, mainly in the Greater Taipei area, from mid May. In response, the closure of all schools in the area from kindergarten to high schools was mandated for two weeks, and national borders were closed for at least a month to those without a residence permit, among other measures.[26]" [https://en.wikipedia.org/wiki/COVID-19_pandemic_in_Taiwan] When I searched for GISAID submissions from Taiwan from May-August 2021, 154 out of 176 submissions were classified under B.1.1.7, and the region of almost all submissions was either Hsinchu or not listed, so it indicates that the outbreak was localized and it mostly consisted of a single strain. [https://cov-spectrum.org/explore/Taiwan/AllSamples/from%3D2021-04-06%26to%3D2021-07-16/variants] So since Taiwan is a much smaller country than Australia, if it was possible for a COVID outbreak to be localized to a single region of Taiwan then why wasn't it possible in Australia?

However actually if you count the number GISAID submissions by collection month, the outbreak in July 2021 is also visible to a minor degree in New South Wales and Australian Capital Territory. In Victoria the number of submissions increased from 252 in May 2020 to 6886 in July 2020, but New South Wales also had an increase from 28 submissions in May to 223 in July:

The plots below also show that around September 2021, there was another minor COVID wave in Australia which showed up as a bump in the PCR positivity rate in Victoria, New South Wales, and Australian Capital Territory, but not in other regions of Australia. (Australian Capital Territory is a small region landlocked inside NSW.) So again if one wave was mostly restricted to two neighboring state then is it so unfeasible that another wave would be mostly restricted to only one of the states?

Another thing that Taiwan has in common with Australia is that their PCR positivity rate was close to 0% until 2022, and their first big increase in PCR positivity rate coincided with the first big increase in excess mortality:

In Taiwan there were also several months in 2021 when the PCR positivity rate remained below 0.1%:

$ wget covid.ourworldindata.org/data/owid-covid-data.csv
$ csvtk grep -f location -p Taiwan owid-covid-data.csv|csvtk cut -f date,positive_rate|awk -F, 'NR>1&&$2!=""{x=substr($1,1,7);a[x]+=$2;n[x]++}END{for(i in a)print i,100*a[i]/n[i]}'|sort
2020-01 1.0925
2020-02 0.417586
2020-03 0.934839
2020-04 0.489
2020-05 0.10129
2020-06 0.120333
2020-07 0.340645
2020-08 0.435862
2020-09 0.377667
2020-10 0.506129
2020-11 1.059
2020-12 1.12129
2021-01 0.447419
2021-02 0.235357
2021-03 0.5
2021-04 0.515667
2021-05 1.52903
2021-06 0.931333
2021-07 0.137419
2021-08 0.0535484
2021-09 0.0333333
2021-10 0.0329032
2021-11 0.0373333
2021-12 0.0780645
2022-01 0.226774
2022-02 0.275
2022-03 0.379032
2022-04 3.582
2022-05 60.8381
2022-06 81.0591

Strain which spread from Victoria to New South Wales

The Substack post said: "The first explanation is not credible given that Victoria state in Australia suffered a covid peak in July - August 2020, yet the state next door, New South Wales, did not. For this to make sense we would have to believe viruses stop at borders or that the lockdowns and border restrictions are dramatically effective. Evidence to date is overwhelming that neither of these can be true. Where did this highly infectious virus go after 'landing' in Victoria in 2020?" [https://wherearethenumbers.substack.com/p/the-puzzle-of-australias-respiratory]

In a nearly complete set of GISAID submissions with a collection date in 2020, among samples from New South Wales with a collection date in August 2020, the most common set of mutations is the set of 15 mutations shown on the first line here:

$ curl -Ls sars2.net/f/gisaid2020.tsv.xz|xz -dc>gisaid2020.tsv
$ awk -F\\t '$4~/2020-08/&&$7=="New South Wales"{a[$12]++}END{for(i in a)print a[i],i}' gisaid2020.tsv|sort -rn|head
57 A1163T,C3037T,T7540C,C8950T,C14408T,G16647T,C18555T,C22480T,G22992A,G23401A,A23403G,G24764T,G28881A,G28882A,G28883C
45 A1163T,C3037T,T7540C,C14408T,G16647T,C18555T,C22480T,G22992A,G23401A,A23403G,G28881A,G28882A,G28883C
7 A1163T,C3037T,T7540C,C14408T,G15535T,G16647T,C18555T,C22480T,G22992A,G23401A,A23403G,G28881A,G28882A,G28883C
6 C241T,A1163T,C3037T,T7540C,C8950T,C14408T,G16647T,C18555T,C22480T,G22992A,G23401A,A23403G,G24764T,G28881A,G28882A,G28883C
6 A1163T,C3037T,T7540C,C8950T,C14408T,G16647T,C18555T,C22480T,G22992A,G23401A,A23403G,G24764T,G28373T,G28881A,G28882A,G28883C
3 C1059T,T1927C,C3037T,C10319T,C11308T,C14408T,A18424G,C21304T,A22255T,A23403G,G25563T,G25907T,C27964T,C28472T,C28869T
3 A1163T,C3037T,T7540C,C8950T,C14358T,C14408T,G16647T,C18555T,C22480T,G22992A,G23401A,A23403G,G24764T,G28881A,G28882A,G28883C
3 A1163T,C3037T,T7540C,C8950T,C11152A,C14408T,G16647T,C18555T,C22480T,G22992A,G23401A,A23403G,G24764T,G28881A,G28882A,G28883C
3 A1163T,C3037T,T7540C,C14408T,G16647T,C17491T,C18555T,G22992A,G23401A,A23403G,G28881A,G28882A,G28883C
2 C3037T,G8371T,C10039T,A10115G,C14408T,G15543T,G21468T,A23403G,G28881A,G28882A,G28883C

This code select submissions which contain some subset of the 15 mutations but no other mutations, and it displays the number of samples from each combination of country and region:

$ awk -F\\t 'NR==FNR{a[$0];next}!$19{n=0;split($12,b,",");for(i in b){if(b[i]in a)n++;else next}if(n>=7)o[n FS$6 FS$7 FS$12]++}END{for(i in o)print o[i]FS i}' <(tr , \\n<<<A1163T,C3037T,T7540C,C8950T,C14408T,G16647T,C18555T,C22480T,G22992A,G23401A,A23403G,G24764T,G28881A,G28882A,G28883C) gisaid2020.tsv|sort -rnk2|csvtk -t pretty -s\ |sed 2d
90  15 Australia  New South Wales   A1163T,C3037T,T7540C,C8950T,C14408T,G16647T,C18555T,C22480T,G22992A,G23401A,A23403G,G24764T,G28881A,G28882A,G28883C
5   14 Australia  New South Wales   A1163T,C3037T,T7540C,C8950T,C14408T,G16647T,C18555T,C22480T,G22992A,G23401A,A23403G,G28881A,G28882A,G28883C
117 13 Australia  New South Wales   A1163T,C3037T,T7540C,C14408T,G16647T,C18555T,C22480T,G22992A,G23401A,A23403G,G28881A,G28882A,G28883C
1   13 Australia  Western Australia A1163T,C3037T,T7540C,C14408T,G16647T,C18555T,C22480T,G22992A,G23401A,A23403G,G28881A,G28882A,G28883C
1   13 Australia  Victoria          A1163T,C3037T,T7540C,C14408T,G16647T,C18555T,C22480T,G22992A,G23401A,A23403G,G28881A,G28882A,G28883C
5   12 Australia  Western Australia A1163T,C3037T,T7540C,C14408T,G16647T,C18555T,G22992A,G23401A,A23403G,G28881A,G28882A,G28883C
2   12 Australia  Victoria          A1163T,C3037T,T7540C,C14408T,G16647T,C18555T,C22480T,G23401A,A23403G,G28881A,G28882A,G28883C
2   12 Australia  New South Wales   A1163T,C3037T,T7540C,C14408T,G16647T,C18555T,G22992A,G23401A,A23403G,G28881A,G28882A,G28883C
11  12 Australia  Victoria          A1163T,C3037T,T7540C,C14408T,G16647T,C18555T,G22992A,G23401A,A23403G,G28881A,G28882A,G28883C
46  11 Australia  Victoria          A1163T,C3037T,T7540C,C14408T,G16647T,C18555T,G23401A,A23403G,G28881A,G28882A,G28883C
1   11 Australia  Western Australia A1163T,C3037T,C14408T,G16647T,C18555T,G22992A,G23401A,A23403G,G28881A,G28882A,G28883C
1   11 Australia  Victoria          A1163T,T7540C,C14408T,G16647T,C18555T,C22480T,G23401A,A23403G,G28881A,G28882A,G28883C
1   11 Australia  Victoria          A1163T,C3037T,T7540C,C14408T,G16647T,G22992A,G23401A,A23403G,G28881A,G28882A,G28883C
1   11 Australia  Victoria          A1163T,C3037T,T7540C,C14408T,C18555T,G22992A,G23401A,A23403G,G28881A,G28882A,G28883C
5   10 Australia  Victoria          A1163T,C3037T,C14408T,G16647T,C18555T,G23401A,A23403G,G28881A,G28882A,G28883C
2   10 Australia  Western Australia A1163T,C14408T,G16647T,C18555T,G22992A,G23401A,A23403G,G28881A,G28882A,G28883C
2   10 Australia  Victoria          A1163T,C3037T,T7540C,C14408T,G16647T,G23401A,A23403G,G28881A,G28882A,G28883C
2   10 Australia  Victoria          A1163T,C3037T,C14408T,C18555T,G22992A,G23401A,A23403G,G28881A,G28882A,G28883C
1   10 Australia  Victoria          A1163T,C3037T,C14408T,C22480T,G22992A,G23401A,A23403G,G28881A,G28882A,G28883C
2   9  Australia  Victoria          A1163T,C3037T,T7540C,C14408T,G16647T,C18555T,G22992A,G23401A,A23403G
11  9  Australia  Victoria          A1163T,C3037T,C14408T,G22992A,G23401A,A23403G,G28881A,G28882A,G28883C
1   9  Australia  Victoria          A1163T,C3037T,T7540C,G16647T,G23401A,A23403G,G28881A,G28882A,G28883C
3   8  Australia  Victoria          A1163T,C3037T,T7540C,C14408T,G16647T,C18555T,G23401A,A23403G
1   8  Australia  Victoria          C14408T,G16647T,C18555T,G23401A,A23403G,G28881A,G28882A,G28883C
1   8  Australia  Victoria          A1163T,C3037T,T7540C,G16647T,G23401A,A23403G,G28881A,G28883C
1   8  Australia  Victoria          A1163T,C3037T,C14408T,G23401A,A23403G,G28881A,G28882A,G28883C
1   8  Australia  Victoria          A1163T,C3037T,C14408T,G16647T,C18555T,G22992A,G23401A,A23403G
4   7  Bangladesh Dhaka             A1163T,C3037T,C14408T,A23403G,G28881A,G28882A,G28883C
1   7  Bangladesh                   A1163T,C3037T,C14408T,A23403G,G28881A,G28882A,G28883C
1   7  Australia  Victoria          A1163T,C3037T,C14408T,G16647T,C18555T,G23401A,A23403G

So basically all samples with 8 or 9 mutations are from Victoria. All samples with 10 or 11 mutations are also from Victoria apart from 3 samples from Western Australia. For 12 mutations there's 2 samples from NSW, 13 from Victoria, and 5 from Western Australia. But 117 out of 119 samples with 13 mutations are from NSW, and all samples with 14 or 15 mutations are from NSW.

So it seems like the strain jumped from Victoria to New South Wales around the time it gained its 12th or 13th mutation. The samples with 12 mutations have collection dates ranging from July 6th to August 12th, and the samples with 13 mutations have collection dates ranging from July 8th to August 20th.

Table of influenza and pneumonia deaths

The Three Stooges posted a table of influenza and pneumonia deaths in Australia and wrote that it showed that "there was no significant change in respiratory mortality and hence no pandemic":

However their table didn't even include deaths where the underlying cause of death was COVID. The spreadsheet they got the table from showed that in 2020 there were 2,157 deaths where the underlying cause of death was J09-J18 (influenza and pneumonia), but the same spreadsheet had 898 COVID deaths in 2020, even though Australia didn't even have that many COVID deaths in 2020. [https://www.abs.gov.au/statistics/health/causes-death/causes-death-australia/2020#data-downloads]

And if you look at the same data for 2022, there's 9,856 deaths where the underlying cause of death is listed as COVID, which was almost 4 times the number of deaths under J09-J18 (influenza and pneumonia). [https://www.abs.gov.au/statistics/health/causes-death/causes-death-australia/latest-release#data-downloads]

On CDC WONDER in 2020, the underlying cause of death was listed as J09-J19 (influenza and pneumonia) for about 1.6% of deaths but COVID for about 10.4% of deaths. So the ratio of COVID to J09-J19 deaths was even higher than in Australia in 2022, as you might guess by comparing the yearly excess mortality percentages:

25% specificity rate for PCR tests based on a paper about the BGI RT-PCR kit

The Three Stooges wrote: "The PCR test's sensitivity and specificity are assumed to be respectively 99% and 25%, as reported here." However in their previous post which they linked to, 25% was the rate of false positives, so wouldn't the specificity rate be 75%?

In the previous post they wrote: [https://wherearethenumbers.substack.com/p/does-unacceptably-high-cross-reactivity]

The report he is referring to is written by the Doherty institute in Australia by Tran et al. They tested the use of the Beijing Genomics Institute (BGI) PCR test at three laboratories in June 2020 looking to determine cross reactivity and found that the first laboratory was 100% specific with zero cross reactions found (no surprises here - it was the Doherty institute laboratory). The two other laboratories had specificities reported as 99.1% and 97.5% respectively (and a cross reactivity of 0.9% and 2.5% respectively):

[...]

Furthermore, four samples from laboratory three were discounted because they breached cycle threshold cutoffs, that only applied to these tests. Here is the extract from the report describing this:

"All samples were negative for SARS-CoV-2 by Laboratory 1. For Laboratory 2, sample 253 (influenza virus A in saliva matrix) and sample 260 (coronavirus-229E in saliva matrix), were excluded from analysis after returning invalid results (internal reference target Ct>32 or not detected). The remaining 22 samples were negative for SARS-CoV-2 by Laboratory 2. For Laboratory 3, sample 259 (coronavirus-OC43 in saliva matrix) and sample 260 (coronavirus 229E in saliva matrix) were excluded from analysis due to their internal reference target having a Ct>32. The remaining 22 samples were negative for SARS-CoV-2 by Laboratory 3. Of note were 4 samples from laboratory 3: sample 236 (parainfluenza type-1 in saliva matrix), sample 246 (adenovirus type-5 in saliva matrix, sample 181 (rhinovirus in VTM matrix) and sample 191 (influenza virus A in VTM matrix) that generated a Ct value above 38 for SARS-CoV-2. These were interpreted as not SARS-CoV-2 positive as per manufacturer's IFU."

From the test report we have no idea what an internal reference control target is but, taken at face value, it presents itself as a convenient way to re-categorise false positives as true negatives, and thus improve test performance by subterfuge. When these discounted false positives are included the FPR-Presence, for laboratory 2 [sic; actually laboratory 3], rises to 6 false positives from 24 samples - a whopping 25%.

So basically in the study that was quoted above, they were testing a PCR protocol developed by the Beijing Genomics Institute. They had 24 samples that contained non-COVID viruses which they sent to three different laboratories. [https://www.health.gov.au/sites/default/files/documents/2020/06/post-market-validation-of-the-beijing-genomics-institute-bgi-sars-cov-2-real-time-pcr-platform.pdf] All three laboratories returned all 24 samples as negative. However in the case of both laboratory 2 and laboratory 3, there were 2 samples that were rejected because the internal reference target was not detected or it was only detected at a cycle threshold of 32 or higher. And in the case of laboratory 3, there were a further 4 samples which yielded a postitive result but at a cycle threshold above 38, which meant that they were classified as negatives according to the instructions of the manufacturer.

So the Three Stooges derived the figure of 25% by ignoring two out of three laboratories and by treating 25% of samples from one laboratory as false positives, even though none of them were actually positive. They should've at least pooled together the results from all three labs which would've given them a false positive rate of 6/72 using their rules (even though actually it was 0/72).

The Three Stooges wrote that "we have no idea what an internal reference control target is". But in the BGI PCR kit, an assay which targets the human beta-actin gene is used as the internal control, so that it is designed to always yield a positive result for a sample which contains a sufficient amount of human DNA. [https://www.bgi.com/wp-content/uploads/sites/2/2021/04/IFU-Real-Time-Fluorescent-RT-PCR-Kit-for-Detecting-SARS-CoV-2.pdf] The cycle threshold at which the internal control gets a positive result can be used as an indication of the amount of human genetic material in the sample.

Thomas Verduyn: Substack article about the Johns Hopkins dashboard

In April 2024 PANDA published a blog post about the theory that the JHU's COVID dashboard somehow presented simulated data instead of real data for COVID cases and deaths. [https://pandauncut.substack.com/p/the-dashboard-that-ruled-the-world] The theory had earlier been proposed by Jockthedog2 and Jikkyleaks, which I addressed in another section of this HTML file.

Number of feature requests per day

Verduyn wrote: "Within two months of its launch, the website was reportedly being 'accessed 1.2 billion times per day,' [10] or nearly half the traffic of the internet giant Google."

However in the video he linked as his source, 1.2 billion didn't refer to the number of visits to the website but to the number of "feature requests per day":

The documentation for ArcGIS Online says: "For hosted web layers (feature, imagery, tile, and scene), the number of requests, rather than views, is provided on the Usage tab. Requests refers to the number of times a request is made for the data in a hosted web layer. This gives the item owner and administrators an idea of how much the layer is used. For example, a user may open an app that contains a hosted feature layer. Opening the app counts as one view, but multiple requests may be necessary to draw all the features in the hosted layer and are counted individually." [https://doc.arcgis.com/en/arcgis-online/manage-data/monitor-item-usage.htm]

In the JHU dashboard, each country and region within a country is listed as an individual "feature": [https://www.arcgis.com/home/item.html?id=c0b356e20b30490c8b8b4c7bb9554e7c#data]

I don't know if the number of "feature requests" counts the number of features requested or the number of requests performed, because I guess multiple features can be served in a single request like in this example response that was posted by someone on the ArcGIS support community: [https://community.esri.com/t5/arcgis-online-questions/agol-usage-dates-question/td-p/450213]

{
  "startTime": 1603843200000,
  "endTime": 1604534400000,
  "period": "1d",
  "data": [{
    "etype": "svcusg",
    "name": "World_Countries_Pop_and_Annual_Electricity",
    "stype": "features",
    "num": [["1603843200000", "7"], ["1603929600000", "7"], ["1604016000000", "5"], ["1604102400000", "7"], ["1604188800000", "3"], ["1604275200000", "75"], ["1604361600000", "11"], ["1604448000000", "175"]]
    }
  ]
}‍‍‍‍‍‍‍‍‍‍‍‍

Did Lauren Gardner's modeling work refer to simulating the data at the JHU dashboard?

Verduyn wrote:

Lacking verbal confirmation, and having thus far only found circumstantial evidence, it was necessary to keep digging for perhaps better evidence as to whether or not JHU used computer models to obtain their data. Not surprisingly, the evidence exists. For example, on 13 March 2020 Professor Lauren Gardner spoke at a congressional hearing on Capitol Hill to explain the dashboard. During the presentation she expressly mentioned "modelling efforts that we are doing behind the scenes" [10].

Furthermore, on the JHU website it says:

"Gardner is a specialist in modelling infectious disease risk, including COVID-19....Gardner leads COVID-19 modelling efforts in partnership with U.S. cities to develop customized models to estimate COVID-19 risk at the local level." [28]

When these two quotes are combined with the fact that Gardner was reported to be so busy managing the dashboard in early 2020 that she had no time to do anything else, it is certain that the modelling work was for the dashboard. Indeed, and as one article pointed out, "working around the clock for 10 weeks straight, they've been so consumed with dashboard maintenance that they've had little time to analyze the data it actually shows" [6].

However when I looked up the bio by Gardner which he quoted at the Wayback Machine, the text about how she Gardner was leading COVID modeling efforts wasn't even included in her bio until January 2023, but it was missing from the previous snapshot from October 2022. [https://web.archive.org/web/20230130111145/https://systems.jhu.edu/lauren_gardner/, https://web.archive.org/web/20221001234719/https://systems.jhu.edu/lauren_gardner/]

And in any case the modeling Gardner did wouldn't have necessarily referred to the JHU dashboard, because she was also the senior author of a preprint published in May 2020 where they modeled the effects of social distancing, titled "Social Distancing is Effective at Mitigating COVID-19 Transmission in the United States". [https://www.medrxiv.org/content/10.1101/2020.05.07.20092353v1] In June 2020 she tweeted a link to the paper and said that she was going to use a similar approach in another modeling project: "We will be actively looking for evidence of this using this a similar modeling approach to: https://medrxiv.org/content/10.1101/2020.05.07.20092353v1". [https://twitter.com/TexasDownUnder/status/1268250335870672896]

How long does it take for countries to produce mortality data?

Verduyn wrote that "it typically takes ten years to get accurate data on a specific illness". It was probably based on his earlier comment where he wrote that "the Human Mortality Database, which tracks mortality by country, is regularly ten years behind for many countries [15]", and he linked to HMD's data for Russia which ended in 2014. [https://www.mortality.org/Country/HCDCountry?cntr=RUS]

However that's not because it takes 10 years for Russia to report mortality data but because the source that Human Mortality Database used for Russia only extended up to 2014. The main HMD database provides long-term yearly mortality data that sometimes extends back to the 1800s. However HMD also publishes the Short-Term Mortality Fluctuations dataset, which includes weekly data for Russia up to the end of the year 2020. [https://mortality.org/Data/STMF] And Dmitry Kobak has published monthly data for deaths in Russia up to June 2023. [https://github.com/dkobak/excess-mortality/blob/main/russian-data/russia-monthly-deaths-preliminary.csv]

The HMD database also has data for Ukraine only up to 2013, Israel up to 2016, and Belarus up to 2018, but for all other countries the data extends at least up to 2019. But there's of course more up-to-date data available from other sources, and in any case I wouldn't say that a 10-year delay is typical.

Verduyn also wrote: "It has already been established, however, that neither Canada nor the US could produce either mortality or influenza data within a six month time frame." However CDC WONDER has influenza deaths even for March 2024: in section 1 set "Group Results By" to "Month", in section 6 set the underlying cause to J10 ("Influenza due to identified influenza virus"), and click send. [https://wonder.cdc.gov/mcd-icd10-provisional.html] The WHO's influenza dashboard has influenza case data for Canada up to the week ending April 7th 2024, and for the US up to the previous week. [https://app.powerbi.com/view?r=eyJrIjoiYWU4YjUyN2YtMDBkOC00MGI1LTlhN2UtZGE5NThjY2E1ZThhIiwidCI6ImY2MTBjMGI3LWJkMjQtNGIzOS04MTBiLTNkYzI4MGFmYjU5MCIsImMiOjh9]

Verduyn also wrote: "For example, the latest year for which official all-cause mortality figures are available in Canada is still only 2020." However there's also provisional data for weekly all-cause mortality which currently ends on February 3rd 2024. [https://open.canada.ca/data/en/dataset/2eac6167-e40c-47b1-ab7e-36bbc4c0cdbf] (The reason why later weeks are not included might be because there's too many deaths missing due to a registration delay.)

Verduyn also asked: "If it currently takes two or three years for a federally funded organisation such as StatsCan to publish mortality data, how was it possible for JHU to get Covid death data in real time?" However even deaths from MERS were reported in the media with little delay. Before MERS-CoV was named, it used to be known as "novel coronavirus" or nCoV or even "novel SARS-like coronavirus". So if you search Twitter for until:2012-12-31 novel coronavirus deaths, you can find reports about early MERS deaths. [https://twitter.com/search?q=until%3A2012-12-31%20novel%20coronavirus%20deaths&src=typed_query&f=live] The WHO published reports about MERS cases and deaths. [http://web.archive.org/web/20130913011723/https://www.who.int/csr/don/2013_09_07/en/index.html] The Saudi MOH also published press releases about new MERS cases and deaths. [http://web.archive.org/web/20131001141127/http://www.moh.gov.sa/en/CoronaNew/PressReleases/Pages/default.aspx] So if someone would've wanted to make a MERS dashboard in 2012, they could've just checked tweets about MERS or the reports by the WHO or the Saudi MOH.

Was it anomalous that JHU was able to launch the dashboard on January 22nd?

Verduyn wrote: "The January 22 launch happened so early on in the Covid timeline that the first WHO situation report had only been released the preceding day, and the term 'Covid' had not even been coined yet. In that first WHO report it was announced that '282 confirmed cases of 2019-nCoV have been reported from four countries including China' [3]. Total cases outside of China were only four, and there had been zero deaths. In fact, only six deaths were officially linked to the virus by this date, and all of them were from Wuhan. For comparison purposes and to put things into perspective, the norovirus is estimated to infect 685 million people and cause 212,000 deaths every year [4]. We are not aware of a norovirus dashboard anywhere in the world."

However when I googled for norovirus dashboard, one of the first results was a norovirus dashboard hosted at ArcGIS Online: [https://www.arcgis.com/apps/dashboards/f3477f6a4ebb4b6f9c6de688b3dffdfd]

Even though there weren't that many cases yet on January 22nd, COVID was already big news that day. That was the first day when Alex Jones and Mike Adams made COVID into the main topic of their shows. That day Mike Adams was already saying that the coronavirus was a genetically engineered bioweapon, and he talked about Neil Ferguson's modeling study which had been published earlier the same day, he mentioned the case of the Snohomish County man, and he talked about how the Pirbright Institute issued a patent for a coronavirus vaccine in 2015 (even though actually it was a patent for avian infectious bronchitis virus, but I think that story was deliberate disinfo which originated from the Qtard Jordan Sather). [https://www.brighteon.com/3ab86f6b-24a5-4125-bdbb-814baaaa791a]

Before January 22nd, Chinese websites were publishing daily maps which showed the number of COVID cases and deaths in different administrative divisions of China. [https://www.163.com/dy/article/F3EP00E40519DDQ2.html]

There's also a Chinese interactive COVID dashboard at sy72.com. [https://www.sy72.com/newpneumonia.asp] The front page of the website said this in Chinese: "The epidemic data system has been running for 1547 days". [https://www.sy72.com/] I viewed the website on April 16th 2024 Chinese time, and 1547 days before it would be January 21st (even though the current day would be the 1547th day starting from January 22nd inclusive). So regardless of which date it means, the sy72 dashboard may have even launched before the JHU's dashboard.

How were JHU able to scale up the dashboard to account for increased traffic?

Someone posted this comment to the Substack post: "A software engineer, it seems unlikely that something like that was built and scale to scale in such a short timescale. I don't remember any glitches in it for a product rushed out so quickly." [https://pandauncut.substack.com/p/the-dashboard-that-ruled-the-world/comment/53986014]

However the dashboard was hosted at ArcGIS Online and not on JHU's own servers. Now if you go to coronavirus.jhu.edu/map.html, the dashboard no longer even works but it just says "Please sign in to ArcGIS Online."

At the Wayback Machine, the earliest snapshot of the coronavirus.jhu.edu website is only from March 4rd UTC. On Twitter early links to the dashboard go to arcgis.com directly and not to the page on JHU's website where the ArcGIS dashboard was embedded. [https://twitter.com/search?q=until%3A2020-3-1%20hopkins%20dashboard&f=live]

In a blog post about the dashboard dated January 23rd, a link to the dashboard also went to the page at arcgis.com. [https://hub.jhu.edu/2020/01/23/coronavirus-outbreak-mapping-tool-649-em1-art1-dtd-health/]

It wouldn't really be much of a product if you shared a map at Google Maps which had pins for different administrative divisions of China and a couple of other countries, so that it would show a box for the number of COVID cases and deaths when you clicked the pin. And even if your shared map became really popular, it wouldn't crash Google Maps. But that's essentially what the first version of the JHU dashboard was, except it was hosted at ArcGIS Online and not Google Maps. And it also had a sidebar which showed the total number of cases and deaths and the latest updates to the data. Here's an early screenshot of the dashboard from January 22nd UTC: [https://twitter.com/greg_folkers/status/1220081577327153152]

Other dashboards at ArcGIS Online

When I searched for other dashboards about viral epidemiology at ArcGIS Online, I found dashboards for Ebola cases by region in the DRC, Ebola cases and deaths in Uganda, influenza, RSV, and COVID cases in Sacramento County, avian influenza in wildlife in Canada, and so on: [https://www.arcgis.com/apps/dashboards/55a8dd4873884812806d882a157db09f, https://www.arcgis.com/apps/dashboards/923cc1ef86f84472be87953ae2ebff50, https://www.arcgis.com/apps/dashboards/4173dee87aa644ddbaec7ba6546561e3, https://www.arcgis.com/apps/dashboards/89c779e98cdf492c899df23e1c38fdbc]

It's really not hard to make these dashboards. On Twitter WelcomeTheEagle88 and OS51388957 have made similar interactive dashboards with Tableau.

The lead author of the JHU's dashboard was Ensheng Dong, who was probably familiar with ArcGIS before COVID, because his LinkedIn says that worked as a GIS specialist from 2018-2019 before he started working at JHU, and that in 2015 he worked as an internee for Esri which is the company that develops ArcGIS, and in 2013-2016 he worked as a teaching assistant for college courses about GIS. [https://www.linkedin.com/in/enshengdong/details/experience/]

Verduyn was also wondering how the JHU were able to publish the dashboard so quick, or if it really took them only a couple of hours to make it.

But for example about 34 hours after Steve Kirsch had published the New Zealand vaccination data that was given to him by Barry Young, WelcomeTheEagle had already published a Tableau dashboard for browsing the data, which was more complex than the first version of the JHU dashboard. [https://twitter.com/welcometheeagle/status/1731244507696714058] Also the monkeypox outbreak was announced by WHO on May 22nd 2022, but by May 25th UTC someone had made a dashboard of monkeypox cases as a one-day coding project. [https://twitter.com/PMolignini/status/1529583727667564545]

Language barriers

Verduyn wrote: "Two of the three people involved in designing the JHU dashboard were native to China, the third was American. This would have enabled them to read the Chinese reports published on the DXY website. But not every country in the world publishes data in either Chinese or English. The difficulties of extracting data from websites in foreign languages are significant even with automated translation tools. Automating this globally is almost inconceivable. Scraping the internet is nigh impossible when the websites being searched are in a language unknown to the researcher. Challenges of this sort are commonly experienced by anyone doing global research, and as a result researchers often confine themselves to countries that use a language known to them. How then did the JHU team do it?"

However it's easy to just translate something like "COVID cases Italy CSV" to Italian and then google for the translated text. (Often even if data is published in some other format than CSV, you'll get results for data downloads if you add "CSV" to the search phrase.)

People were also suggesting new sources of data at the GitHub issue tracker. For example here some Italian guy suggested a new source of data for Italy: https://github.com/CSSEGISandData/COVID-19/issues/119. And here someone from Singapore linked to a source of data published by the Singapore MOH: https://github.com/CSSEGISandData/COVID-19/issues/38. Here someone from Iran showed a source for regional data from Iran: https://github.com/CSSEGISandData/COVID-19/issues/133. In this issue someone notified about the first reported case in New Zealand: https://github.com/CSSEGISandData/COVID-19/issues/152. In this case someone notified about the first case in Romania which was then added: https://github.com/CSSEGISandData/COVID-19/issues/138. And here someone notified about the first case in Brazil: https://github.com/CSSEGISandData/COVID-19/issues/136. Here someone notified that the 7th case was missing for Finland which was then added: https://github.com/CSSEGISandData/COVID-19/issues/243. Here someone showed an official source of data for Sweden: https://github.com/CSSEGISandData/COVID-19/issues/224. In this thread someone posted links to new cases in Germany as they were published by various regional authorities: https://github.com/CSSEGISandData/COVID-19/issues/126.

And if it would've been too much work to find sources of data for each country, then why does the JHU's GitHub repository have a list of sources like this they used for 65 different countries? [https://github.com/CSSEGISandData/COVID-19]

Verduyn also wrote: "The difficulties of extracting data from websites in foreign languages are significant even with automated translation tools. Automating this globally is almost inconceivable." However in the second paper about the dashboard that was published in Lancet, Appendix B of the supplementary PDF says: "Practically all scrappers use some element of natural language processing (NLP) to identify, collect, and store the correct data type. As of June 1, 2022, about 30% of deployed scrappers use HTML text parsing approaches through the re (Regular Expression) or BeautifulSoup python libraries. Only 2% of sources require manual collection." [https://www.thelancet.com/cms/10.1016/S1473-3099%2822%2900434-0/attachment/18c37da8-53f2-45ee-aed1-31cc408f9498/mmc1.pdf] So if they used AI methods like natural language processing to extract the data, then they didn't necessarily even need to machine translate the data so it could be understood by humans.

Updates every 15 minutes

Verduyn asked: "More crucially, how did they possibly update their dashboard 'every 15 minutes'? [1, 16]"

However the paper he linked just said that JHU fetched the Chinese regional data from DXY every 15 minutes: "Every 15 min, the cumulative case counts are updated from DXY for all provinces in China and for other affected countries and regions."

On a website which JHU listed as one of their sources for Australia, for example on March 29th 2020, the daily new cases were updated at 11:23 AM for Victoria, 11:38 AM for New South Wales, and 8:19 PM for Tasmania. But the cases for each region were only updated once that day: [https://covidlive.com.au/last-updated]

So if JHU wanted to update their regional data for Australia soon after it got added to the COVID LIVE website, they could've checked website every 15 minutes for new updates. So then they would've been able to add new cases for Victoria at 11:30 AM Australian time, for New South Wales at 11:45 AM, and so on (or maybe one or two minutes later depending on what kind of delays their processing pipeline had).

But that wouldn't mean that new cases for Australia would be added within 15 minutes of when they first occurred.

So similarly the reason why JHU checked for updates to DXY every 15 minutes might have been if DXY updated their data for different administrative divisions of China at different times of the day.

Worldometers

Worldometers says: "Effective February 1, 2023, the Coronavirus Tracker had switched from LIVE to Daily Updates. As a number of major countries had transitioned to weekly updates, there was no need anymore for immediate updates throughout the day as soon as a new report is released." [https://www.worldometers.info/coronavirus/] So I believe live data didn't mean that they added individual cases in real time, but just that they added daily reports for each country soon after they were published. The list of daily new reports added can be seen here: https://www.worldometers.info/coronavirus/#news. For example on April 12th 2024 their list of updates shows that they added 16 new deaths for Germany, which matches the number of deaths in the file they cited as their source. [https://github.com/robert-koch-institut/COVID-19-Todesfaelle_in_Deutschland/blob/main/COVID-19-Todesfaelle_Deutschland.csv]

Verduyn wrote that a full list of sources used by Worldometers was not available. But under the heading "Latest news" they show the sources they used for updates within the past 2 weeks. [https://www.worldometers.info/coronavirus/#news] So you might be able to compile a complete or near complete list of their news updates through the Wayback Machine. Archives of the updates are only available for January and February 2020, but they generally include links to the source of the data. [https://www.worldometers.info/coronavirus/feb-2020-news-updates-covid19/]

But anyway, if the data at Worldometers was simulated, then why would they bother exhaustively linking to the sources of new cases they aded each day? And how would they be able to get the simulated number of cases to match the number of cases mentioned in the sources they linked? Wouldn't it be easier to just report real the data?

The about page at Worldometers says (https://www.worldometers.info/about/):

For the COVID-19 data, we collect data from official reports, directly from Government's communication channels or indirectly, through local media sources when deemed reliable. We provide the source of each data update in the "Latest Updates" (News) section. Timely updates are made possible thanks to the participation of users around the world and to the dedication of a team of analysts and researchers who validate data from an ever-growing list of over 5,000 sources.

For the live counters on the home page, we elaborate instead a real-time estimate through our proprietary algorithm which processes the latest data and projections provided by the most reputable organizations and statistical offices in the world.

So they indicated that they used different methodology to produce their live counters and their COVID statistics. I didn't find any live counter for COVID data at Worldometers, but I don't know if they earlier had similar live counters for COVID as the world population counter on their front page where the numbers change every second. But in any case the projected data would've probably been extrapolated from real data just like the other live counters.

I also don't know if Worldometers was an important source of data for the JHU dashboard, because on their list of sources they only include Worldometers under a section titled "Aggregated data sources" but not under the sources for any specific country or region: https://github.com/CSSEGISandData/COVID-19.

Curve for COVID deaths in NYC looks too smooth

Verduyn wrote:

We next plot Covid death data (including "probable deaths") from only NYCH (Fig. 2 below). The smoothness of the curve is remarkable, and almost certainly reflects the use of an SIRD epidemiological model as the underlying source of the data. Naturally, since the JHU curve is identical in shape (only with smaller numbers), it too reflects an SIRD model. Since we have already established that a simple equation exists for "probable deaths," it is fairly convincing evidence that models were used for all the data: confirmed, probable, and total.


Figure 2: Covid deaths in NYC. Source: NYC Health: https://github.com/nychealth/coronavirus-data/blob/master/trends/deaths-by-day.csv

To drive this last point home, and for comparison purposes, we next plot the graph of Covid deaths in Hubei province during the first three months of 2020 (Figure 3 below). Despite the fact that the population of Hubei province (58 million) is seven times that of NYC (8.3 million), the number of deaths in Hubei (peak: 147, sum: 3,164) was significantly less than in NYC (peak: 831, sum: 23,338 ). For these numbers to be correct, it would mean that what happened in NYC was 51 times worse than what happened in the province where Covid supposedly originated. That scenario is so unlikely that it borders on preposterous, and lends support to the notion that the NYC data was not based on observed facts.


Figure 3: Covid deaths in Wuhan China, by day of reporting, Jan to Mar 2020. Two day rolling average was used for Feb 12 & 13, Feb 21 & 22, and Feb 23 & 24. This was done to keep the shape of the graph observable. Originally, reported deaths were zero on Feb 12, 21, and 23; and the peak was 242 on Feb 13. Source: JHU CSSE COVID-19 Data. https://github.com/CSSEGISandData/COVID-19

It is also observed that the graph for Hubei province (Fig. 3) is more consistent with what empirical data typically looks like (jagged), while the graph for NYC (Fig. 2) resembles what a computerised model would produce (smooth).

However NYC had much more reported deaths than Hubei, so there's less day-to-day noise because of a bigger sample size.

Hong Kong has a similar population size as NYC, and it had about 170% excess deaths in March 2022 according to OWID, so the peak excess mortality was much higher than in Hubei in spring 2020. At Worldometers the curve for COVID deaths in February to April 2022 in Hong Kong looks smooth like the curve for NYC, and it also has a similar shape where it goes from zero to maximum and back to zero within about two months, and it takes about twice as long to fall down from the maximum as it takes to rise up to the maximum: [https://www.worldometers.info/coronavirus/country/china-hong-kong-sar/]

I used the Wayback Machine to look up the source of data that Worldometers used for Hong Kong in March 2022. [http://web.archive.org/web/20220331000040/https://www.worldometers.info/coronavirus/#news] On March 30th 2020 they added 135 new deaths and the source was listed as a dashboard website which is not functional at the Wayback Machine. [https://web.archive.org/web/20220330135151/https://chp-dashboard.geodata.gov.hk/covid-19/zh.html] However I also found data for daily COVID deaths in CSV files published by the Hong Kong government. [https://www.coronavirus.gov.hk/eng/5th-wave-statistics.html] The cumulative number of deaths was listed as 7358 on March 29th and 7493 on March 30th, so 7493 minus 7358 is 135 which matches the figure at Worldometers.

In the plot below where I used data from the Hong Kong government website, the curve for COVID deaths in Hong Kong looks more smooth than the curve for Hubei but maybe slightly less smooth than the curve for NYC, but it might be because the peak number of COVID deaths per day was over twice as high in NYC as Hong Kong, so the sample size was a bit bigger in NYC: [https://i.ibb.co/1XKwzqY/hong-kong-covid-deaths-march-2022.png]

mkdir hong;cd hong
wget https://www.coronavirus.gov.hk/files/5th_wave_statistics/breakdown/Breakdown_by_age%20group_2022{03{01..31},04{01..30},05{01..31}}.csv
for x in *.csv;do grep ^Total "$x"|cut -d, -f2|sed s/^/$(sed 's/\(....\)\(..\)\(..\).*/\1-\2-\3/'<<<"${x##*_}"),/;done|(echo date,dead;cat)>hongdeath.csv
Rscript -e 't=read.csv("hongdeath.csv");t$date=as.Date(t$date);t$dead=c(NA,diff(t$dead));png("1.png",1800,1100,res=300);par(mar=c(2.2,2.3,1.1,1.4),mgp=c(0,.6,0));plot(t$date,t$dead,type="l",xlab=NA,ylab=NA,lwd=1.5)'

Live counter for world population at Worldometers

Someone in the comments wrote: [https://pandauncut.substack.com/p/the-dashboard-that-ruled-the-world/comment/54040209]

And what about world population data?

Are there really 8.1 billion people in the world?

Or is it just modelling?

Look at the way this Worldometers population page ticks over: https://www.worldometers.info/

Worldometers says that the data they use for their live counter of world population comes from the 2022 UN World Population Prospects dataset "The above world population clock is based on the latest estimates released in July of 2022 by the United Nations." [https://www.worldometers.info/world-population/]

So of course Worldometers doesn't have live second-to-second data of the world population, but they might just interpolate the world population number in their live counter from the yearly population estimates in the UN WPP dataset (except sometimes their population is lower the next second than the previous second, so they might add some random noise to the interpolated population numbers).

When I interpolated the midyear population estimates in the WPP dataset, I got 8109566164 as the world population on 2024-04-16 18:53:58 UTC:

curl https://population.un.org/wpp/Download/Files/1_Indicators%20%28Standard%29/CSV_FILES/WPP2022_Demographic_Indicators_Medium.zip>temp.zip;unzip temp.zip;rm temp.zip
> t=read.csv("WPP2022_Demographic_Indicators_Medium.csv")
> t=subset(t,LocTypeName=="World"&Time!=2101)
> date=as.POSIXct(paste0(t$Time,"-7-1"))
> d1=Sys.time()
> d1
[1] "2024-04-16 21:53:58 EEST"
> predict(smooth.spline(date,t$TPopulation1July,spar=.5),as.numeric(d1))$y*1000
[1] 8109566164