
Other parts: ethical.
Jeffrey Morris posted this plot by Truth in Numbers where the ASMR in
2024 was below the 2018-2019 average baseline: [https://
Ethical Skeptic posted this tweet in response, where he got about
7.1% excess deaths in 2024: [https://
From practitioner experience:
1. Regression is applied to stable troughs, not all data points, which may include volatile isolated surges - otherwise it is Gaussian blindness paltering (using a dishonest baseline).
2. If 1.6 million EXCESS old persons die over a couple years, you must lower the anticipated death rate in subsequent years, or you are doing torfuscation (hiding the dead bodies).
Both are dishonest and/or incompetent.

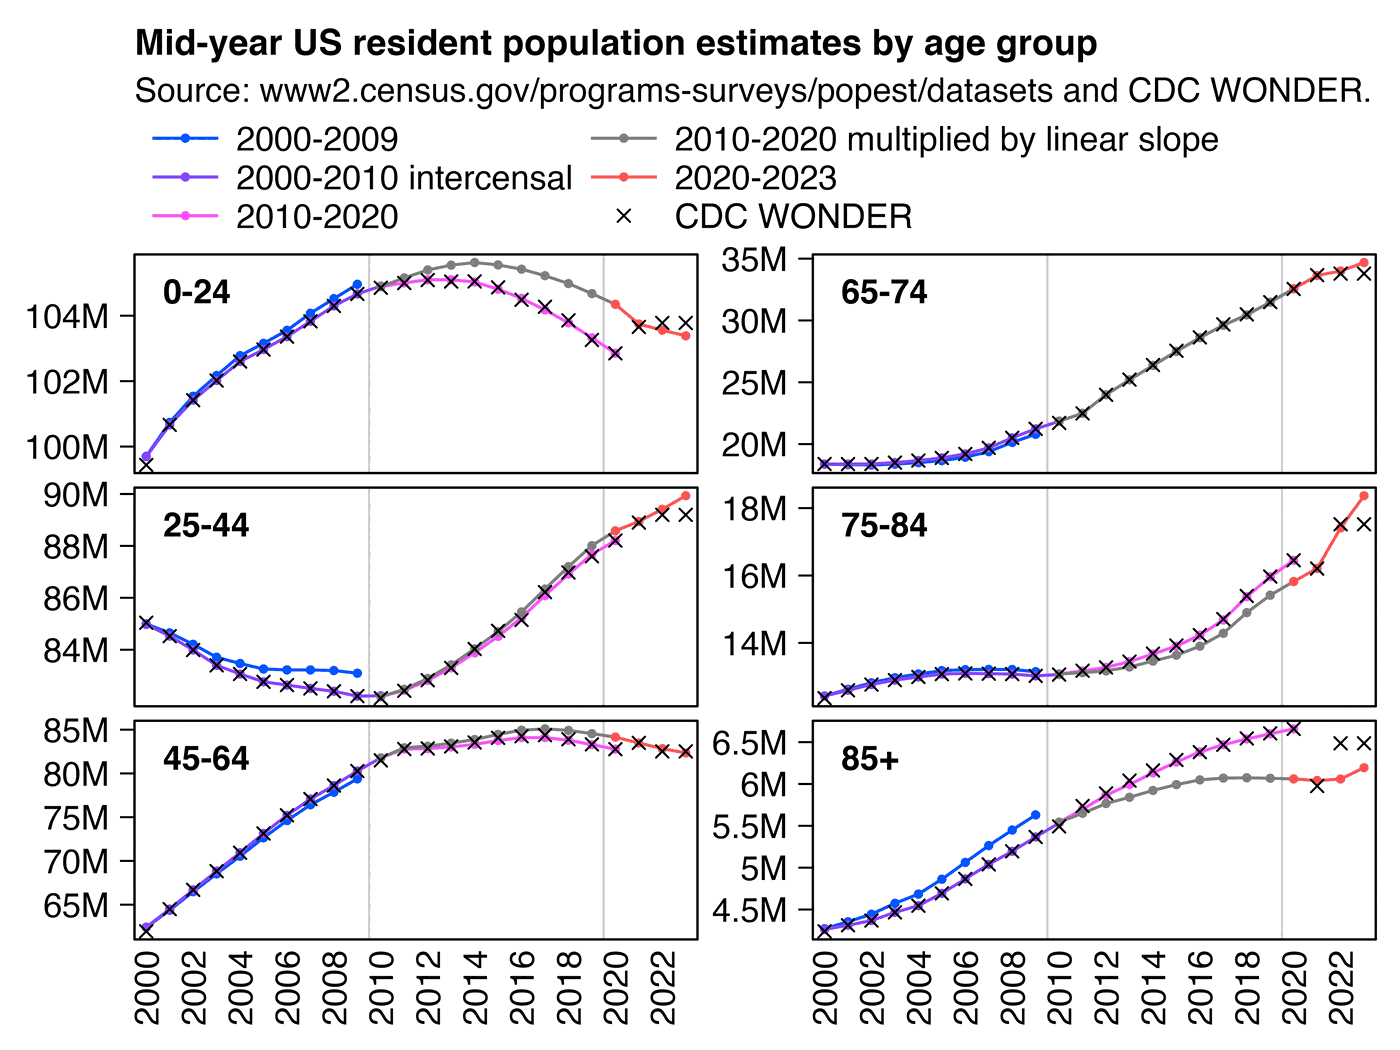
In the plot by Truth in Numbers, the average ASMR on weeks 40 of 2018 and 2019 was drawn as a baseline, but if he would've used a prepandemic linear regression as the baseline then he might have gotten positive excess ASMR in 2024. He used 2010-based population estimates up to 2020 and 2020-based population estimates from 2021 onwards, which exaggerated his ASMR in 2024 relative to 2018 and 2019, because the population sizes of the oldest age groups dropped dramatically between the 2010-based and 2020-based population estimates:
library(data. table); library( ggplot2) agecut=\( x, y) cut( x, c( y, Inf), paste0( y, c( paste0( "- ", y[- 1]- 1), "+ ")), T, F) kim=\( x) ifelse( x> =1e3, ifelse( x> =1e6, paste0( x/ 1e6, " M"), paste0( x/ 1e3, " k")), x) new=fread( " https:// www2. census. gov/ programs- surveys/ popest/ datasets/ 2020- 2023/ national/ asrh/ nc- est2023- agesex- res. csv") old=fread( " https:// www2. census. gov/ programs- surveys/ popest/ datasets/ 2010- 2020/ national/ asrh/ nc- est2020- agesex- res. csv") old=old[ SEX==0& AGE! =999,.( age=AGE, pop=unlist(. SD[,-( 1: 4)]), year=rep( 2010: 2020, each=. N))] new=new[ SEX==0& AGE! =999,.( age=AGE, pop=unlist(. SD[,-( 1: 3)]), year=rep( 2020: 2023, each=. N))] older=fread( " https:// www2. census. gov/ programs- surveys/ popest/ tables/ 2000- 2010/ intercensal/ national/ us- est00int- 01. csv") older=older[ 6: 26, c( 1, 3: 12, 14)][,.( age=as. numeric( sub( "\\ D*(\\ d+).* ", "\\ 1", sub( " Under 5", 0, V1))), pop=as. numeric( gsub( ", ", " ", unlist(. SD[,- 1]))), year=rep( 2000: 2010, each=. N))] oldest=fread( " https:// www2. census. gov/ programs- surveys/ popest/ tables/ 2000- 2009/ national/ asrh/ nc- est2009- 01. csv") oldest=oldest[ 6: 26, c( 1, 2: 11)][,.( age=as. numeric( sub( "\\ D*(\\ d+).* ", "\\ 1", sub( " Under 5", 0, V1))), pop=as. numeric( gsub( ", ", " ", unlist(. SD[,- 1]))), year=rep( 2009: 2000, each=. N))] mult=merge( old[ year==2020], new[ year==2020,.( age, new=pop)])[,.( ratio=new/ pop, age)] mult=merge( old, mult)[, mult: =( year- 2010)/ 10] mult=mult[,.( age, year, pop=(( 1- mult)* 1+ mult* ratio)* pop)] won=fread( " http:// sars2. net/