
In April 2024 Carlos Alegria and Yuri Nunes from Dowd's company
Phinance Technologies published a preprint about cancer deaths in ages
75 to 84 at CDC WONDER. [https://
When I tried replicating the plot by using the population sizes returned by CDC WONDER, my mortality rate for 2022 was about 1009 and not about 1090 like in Dowd's paper, like you can see from the green crosses here:
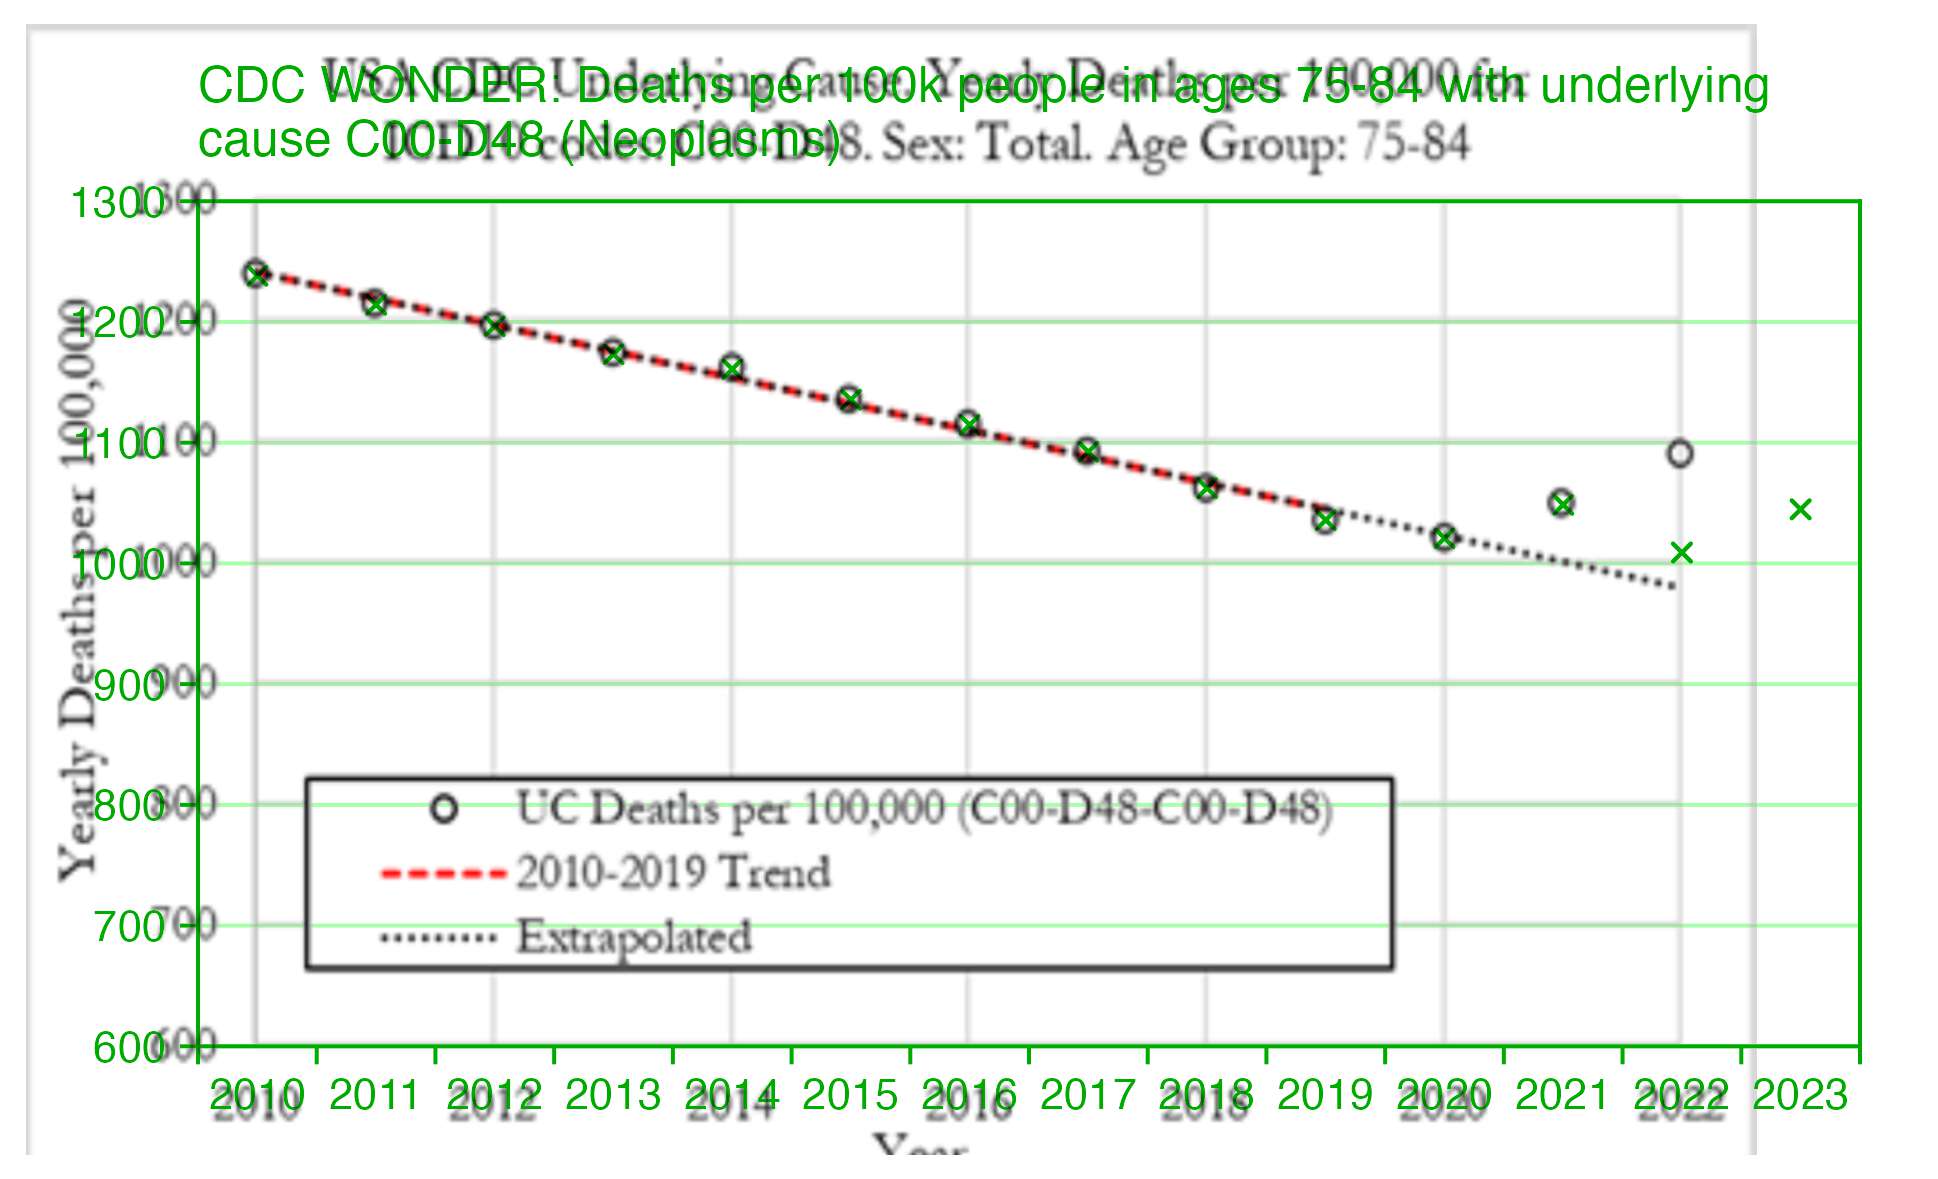
But then I realized the difference was because Alegria and Nunes wrote that they downloaded the data from CDC WONDER in December 2023, so at the time CDC WONDER still used the 2021 population estimates for 2022, in the same way that in March 2024 when I took the screenshot below, CDC WONDER still used the 2022 population estimates for 2023 and 2024:
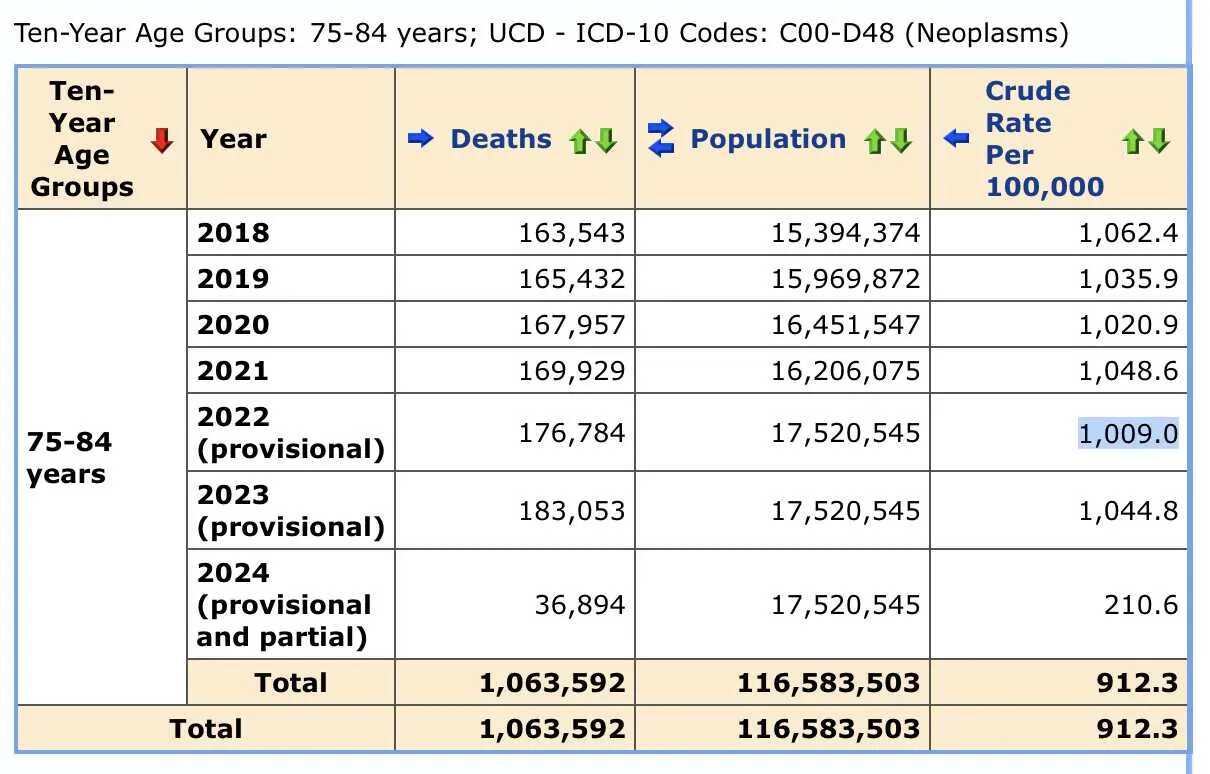
In the screenshot above if you calculate the mortality rate for 2022 by dividing the deaths in 2022 by the population size in 2021, you get about 1091, which matches the plot in Dowd's preprint.
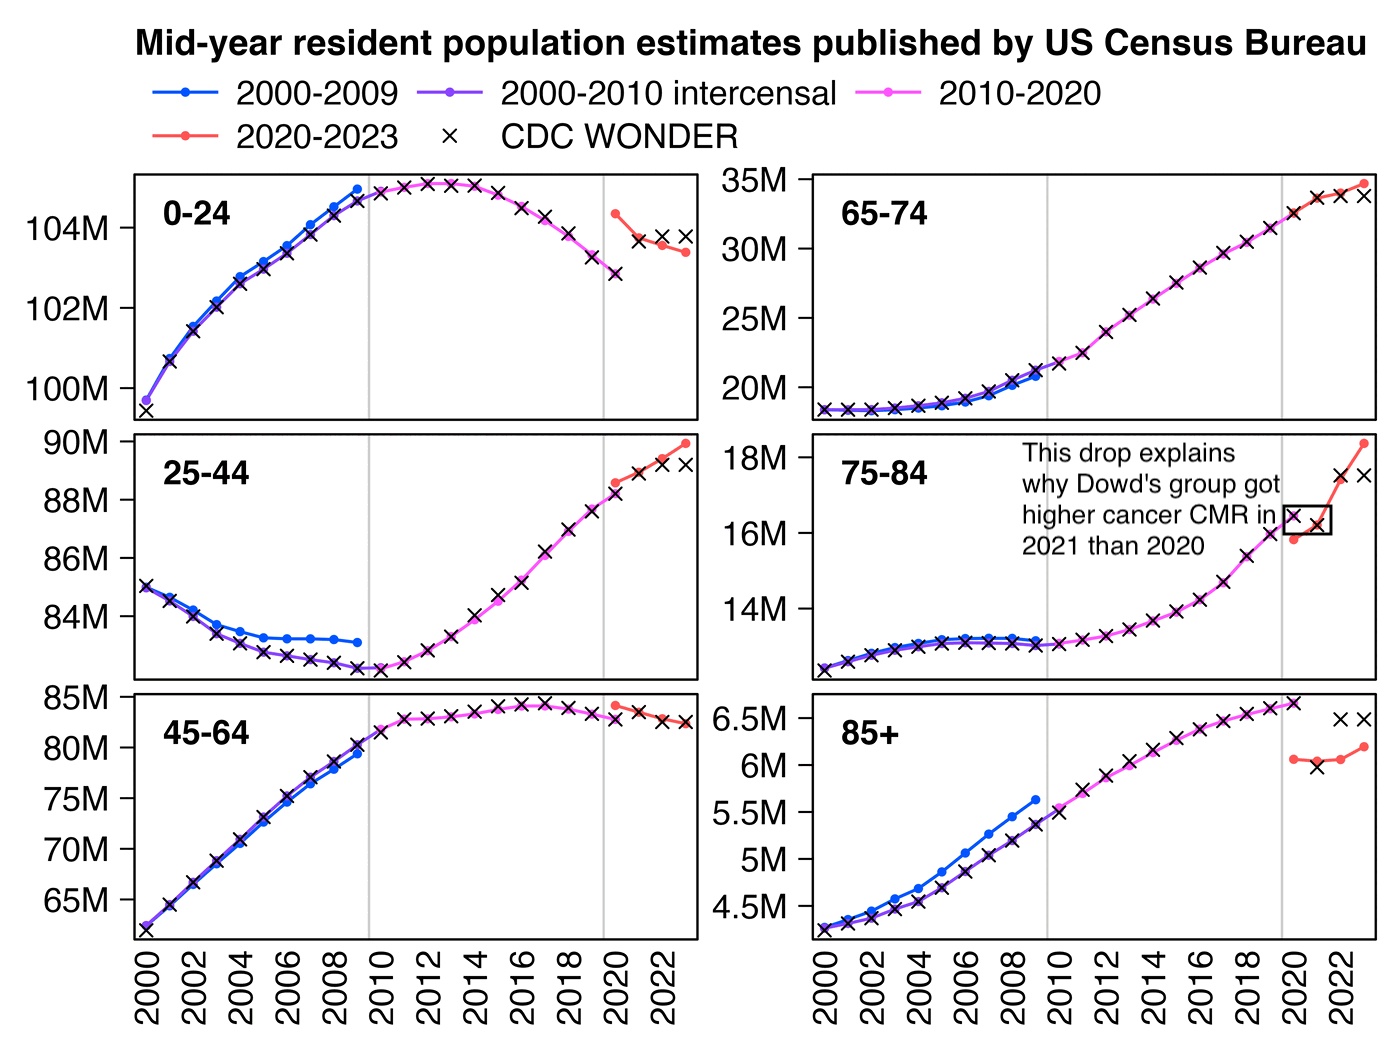
Next I figured out why Dowd's team got higher CMR in 2021 than 2020, which is that CDC WONDER uses population estimates based on the 2010 census for 2020 but population estimates based on the 2020 census from 2021 onwards. And if you look at the mid-2020 resident population estimate for ages 75 to 84, it was about 4% lower in the 2020-based vintage 2023 release than in the 2010-based vintage 2020 release:
#vintage 2020 release based on 2010 census (used by CDC WONDER for 2020) old=fread(" https:// www2. census. gov/ programs- surveys/ popest/ datasets/ 2010- 2020/ national/ asrh/ nc- est2020- agesex- res. csv") old[ AGE% in% 75: 84& SEX==0, sum( POPESTIMATE2020)] # 16451547 #vintage 2023 release based on 2020 census new=fread(" https:// www2. census. gov/ programs- surveys/ popest/ datasets/ 2020- 2023/ national/ asrh/ nc- est2023- agesex- res. csv") new[ AGE% in% 75: 84& SEX==0, sum( POPESTIMATE2020)] # 15822264 (about 4% lower than vintage 2020 estimate)
The next plot shows how CDC WONDER switched to the 2020-based population estimates in 2021, so CDC WONDER has a drop in the population size of ages 75-84 between 2020 and 2021:
library(data. table); library( ggplot2) agecut=\( x, y) cut( x, c( y, Inf), paste0( y, c( paste0( "- ", y[- 1]- 1), "+ ")), T, F) kim=\( x) ifelse( x> =1e3, ifelse( x> =1e6, paste0( x/ 1e6, " M"), paste0( x/ 1e3, " k")), x) new=fread( " https:// www2. census. gov/ programs- surveys/ popest/ datasets/ 2020- 2023/ national/ asrh/ nc- est2023- agesex- res. csv") old=fread( " https:// www2. census. gov/ programs- surveys/ popest/ datasets/ 2010- 2020/ national/ asrh/ nc- est2020- agesex- res. csv") old=old[ SEX==0& AGE! =999,.( age=AGE, pop=unlist(. SD[,-( 1: 4)]), year=rep( 2010: 2020, each=. N))] new=new[ SEX==0& AGE! =999,.( age=AGE, pop=unlist(. SD[,-( 1: 3)]), year=rep( 2020: 2023, each=. N))] older=fread( " https:// www2. census. gov/ programs- surveys/ popest/ tables/ 2000- 2010/ intercensal/ national/ us- est00int- 01. csv") older=older[ 6: 26, c( 1, 3: 12, 14)][,.( age=as. numeric( sub( "\\ D*(\\ d+).* ", "\\ 1", sub( " Under 5", 0, V1))), pop=as. numeric( gsub( ", ", " ", unlist(. SD[,- 1]))), year=rep( 2000: 2010, each=. N))] oldest=fread( " https:// www2. census. gov/ programs- surveys/ popest/ tables/ 2000- 2009/ national/ asrh/ nc- est2009- 01. csv") oldest=oldest[ 6: 26, c( 1, 2: 11)][,.( age=as. numeric( sub( "\\ D*(\\ d+).* ", "\\ 1", sub( " Under 5", 0, V1))), pop=as. numeric( gsub( ", ", " ", unlist(. SD[,- 1]))), year=rep( 2009: 2000, each=. N))] won=fread( " http:// sars2. net/ f/ w o n d e r c a n c e r y e a r l y s i n g l e . csv")[ age<