Record-level Medicare data from Connecticut published by Steve Kirsch - sars2.net

Contents

Converting the data to CSV

In September 2024 Steve Kirsch published a spreadsheet for data from Connecticut that contains rows for a total of about 500,000 people who were enrolled on Medicare. The file has columns for sex, date of death, vaccine brand, the dates of the first 3 vaccine doses, and age at the time of the first dose: https://kirschsubstack.com/p/i-have-been-fully-vindicated-by-the. The vaccine brand is presumably the brand of the first dose.

Kirsch obfuscated the vaccine brand names in his spreadsheet in order to do his ChatGPT analysis, but this code converts the spreadsheet to a CSV file with unobfuscated vaccine brand names, and it also converts the dates to the ISO format and makes column names shorter:

download.file("https://www.skirsch.com/covid/ct_mortality.xlsx","ct_mortality.xlsx")
t=data.table(readxl::read_excel("ct_mortality.xlsx"))

t[BRAND=="PURPLE",BRAND:="Pfizer"]
t[BRAND=="MIXED",BRAND:="Moderna"]
t[BRAND=="CHERRY",BRAND:="Janssen"]
t[BRAND=="MODERNA",BRAND:="Moderna"] # the last two rows for Moderna were accidentally not obfuscated

o=t[,.(id=PERSON_ID,sex=Sex,dead=as.Date(`Date of death`),brand=BRAND,date1=as.Date(SHOTDATE_1),date2=as.Date(SHOTDATE_2),date3=as.Date(SHOTDATE_3),age=AGE_AT_DOSE1)]

fwrite(o,"ctmort.csv.gz",na="")

I uploaded the output here: f/ctmort.csv.gz.

Bucket analysis

The following script generates a file for the Connecticut data similar to the files generated by Kirsch's buckets.py script. The file shows the number of deaths and person-days grouped by the month of vaccination, ongoing month, weeks since vaccination, dose number, age, sex, and vaccine type. I assigned a random birthday to each person in order to account for the aging of people over time with daily precision:

library(data.table);library(lubridate)

# fast way to get difference in floored years for a pair of dates after 1900 and before 2100
age=\(x,y){class(x)=class(y)=NULL;(y-x-(y-789)%/%1461+(x-789)%/%1461)%/%365}

ct=fread("http://sars2.net/f/ctmort.csv.gz")

# exclude 30 people whose date of death is before the first dose
ct=ct[is.na(dead)|dead>=date1]

mindate=as.Date("2020-12-1");maxdate=as.Date("2024-07-31")

t=ct[,.(id,sex,dead,type=brand,date=c(date1,date2,date3),dose=rep(1:3,each=.N),age)]
t$vaxmonth=substr(t$date,1,7)
set.seed(0);t$birth=as.Date(t$date)-years(t$age)-sample(0:364,nrow(t),T)

buck=data.table()
for(day in as.list(seq(mindate,maxdate,1))){
  cat(as.character(day),"\n")
  ## buck=rbind(buck,unique(t[date<=day&(is.na(dead)|day<=dead)&day>=birth],by="id")[,.( # remove under earlier doses
  buck=rbind(buck,t[date<=day&(is.na(dead)|day<=dead)&day>=birth][,.( # keep under earlier doses
    month=substr(day,1,7),vaxmonth,week=as.numeric(day-date)%/%7,
    age=age(birth,day),dose,type,sex,alive=1,dead=dead==day)])[,.(
      alive=sum(alive),dead=sum(dead,na.rm=T)),by=.(month,vaxmonth,week,age,dose,type,sex)]
}

setorder(buck,month,vaxmonth,week,age,dose,type,sex)
fwrite(buck,"ctbucketskeep.csv.gz",quote=F)

I uploaded the output here: f/ctbucketskeep.csv.gz. In the file people are kept included under earlier doses after a new dose.

Ages below 65 have elevated mortality due to Medicare eligibility criteria

Medicare is managed by the U.S. Department of Health and Human Services (HHS). The website of HHS says: "Generally, Medicare is for people 65 or older. You may be able to get Medicare earlier if you have a disability, End-Stage Renal Disease (permanent kidney failure requiring dialysis or a transplant), or ALS (also called Lou Gehrig's disease)." [https://www.hhs.gov/answers/medicare-and-medicaid/who-is-eligible-for-medicare/index.html] So in the code below where I calculated a mortality rate within a year from the first dose, ages 60 to 64 had almost three times higher mortality rate than ages 65 to 69:

> ct=fread("http://sars2.net/f/ctmort.csv.gz")
> ct[,.(cmr=round(mean(!is.na(dead)&dead-date1<365)*1e5),people=.N),.(age=age%/%5*5)][order(age)]|>print(r=F)
 age    cmr people
  10      0      2
  15      0      1
  20    621    483
  25    190   1055
  30    306   1633
  35    934   2034
  40   1163   2494
  45   1333   3151
  50   2436   5624
  55   2675   9681
  60   2988  14925
  65   1169 121444
  70   1724 113601
  75   2911  87246
  80   5014  56220
  85   8739  35681
  90  15787  19168
  95  23483   5932
 100  32071    792
 105  41379     29
 110 100000      1
 115 100000      2
 age    cmr      N

In my subsequent analysis in this HTML file, I have generally excluded ages below 65.

Moderna-Pfizer ratio by month of vaccination and ongoing month

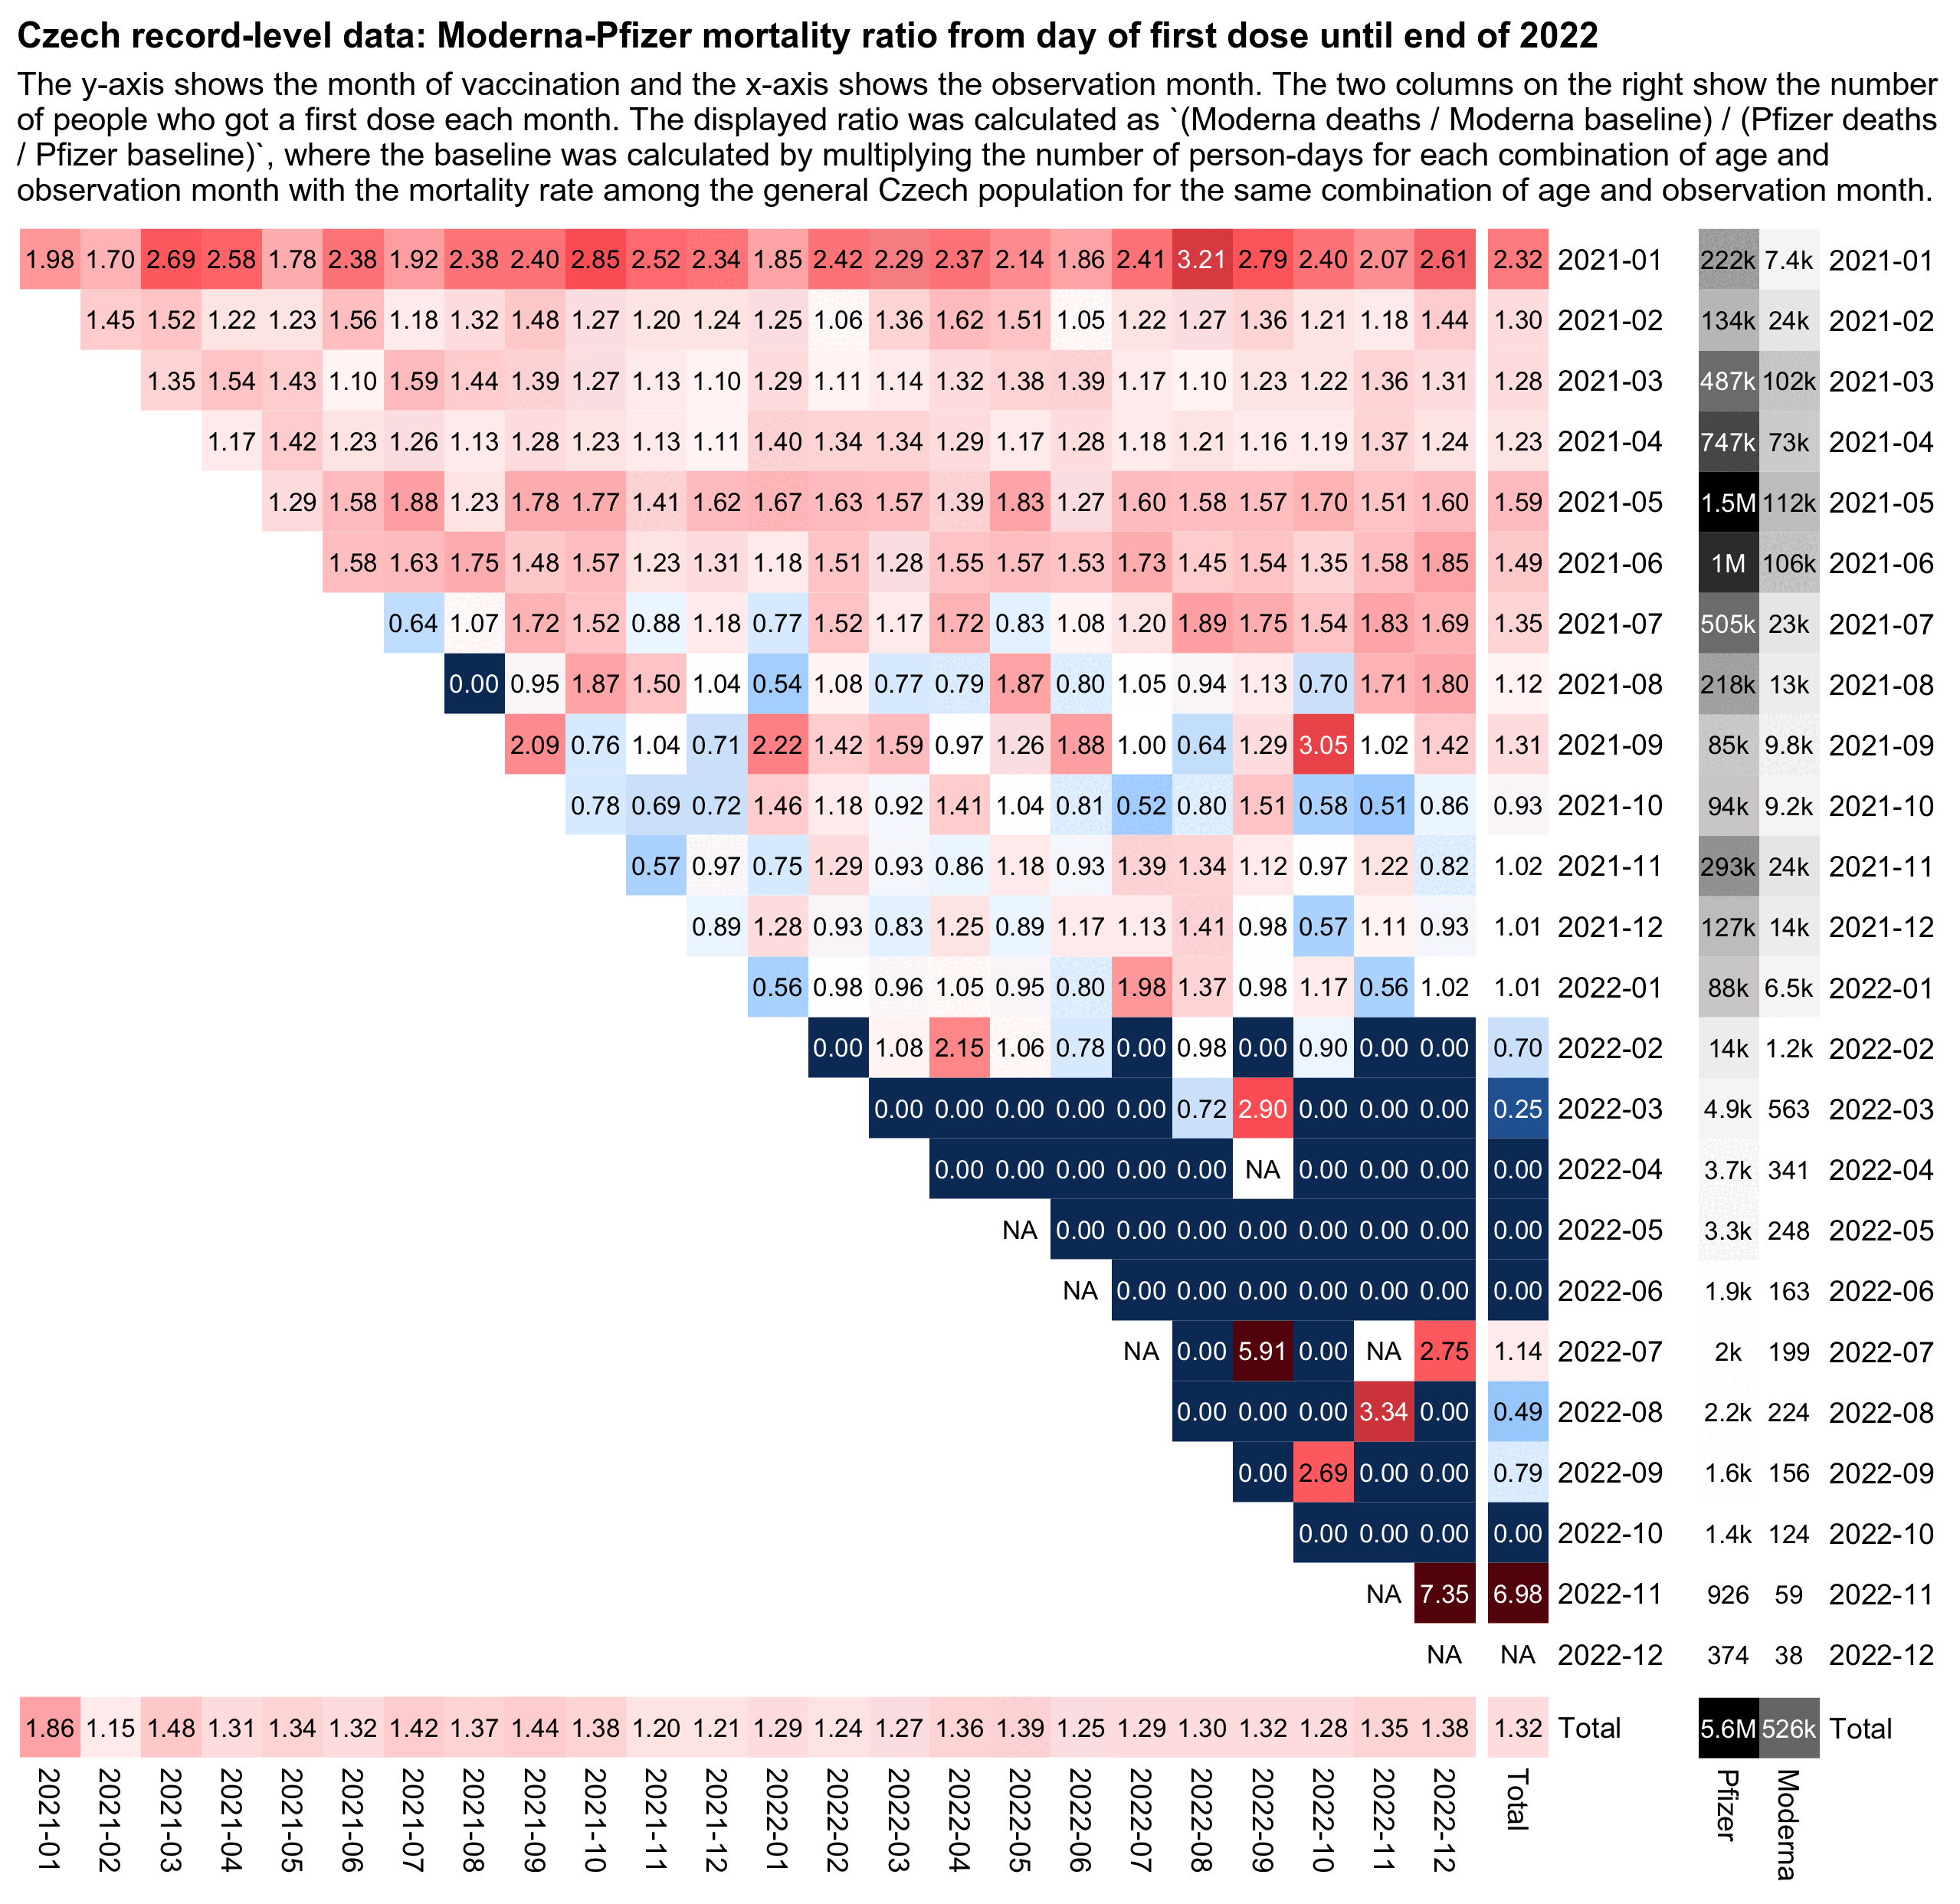
In Kirsch's analysis of the Czech record-level data, his main argument why Moderna vaccinese were unsafe than Pfizer vaccines was that when he calculated age-specific mortality rates during the first year from the first dose, Moderna got about 1.3 higher mortality rate than Pfizer across various age groups. However I pointed out to him that it might have been due to some confounders he didn't adjust for in his analysis. In the plot below where I calculated an age-normalized Moderna-Pfizer mortality ratio in the Czech data, my total ratio for all months of vaccination aggregated together was about 1.3 like in Kirsch's analysis, but my ratio fell close to 1.0 among people who were vaccinated in the fourth quarter of 2021: [czech2.html#Triangle_plot_of_Moderna_Pfizer_ratio]

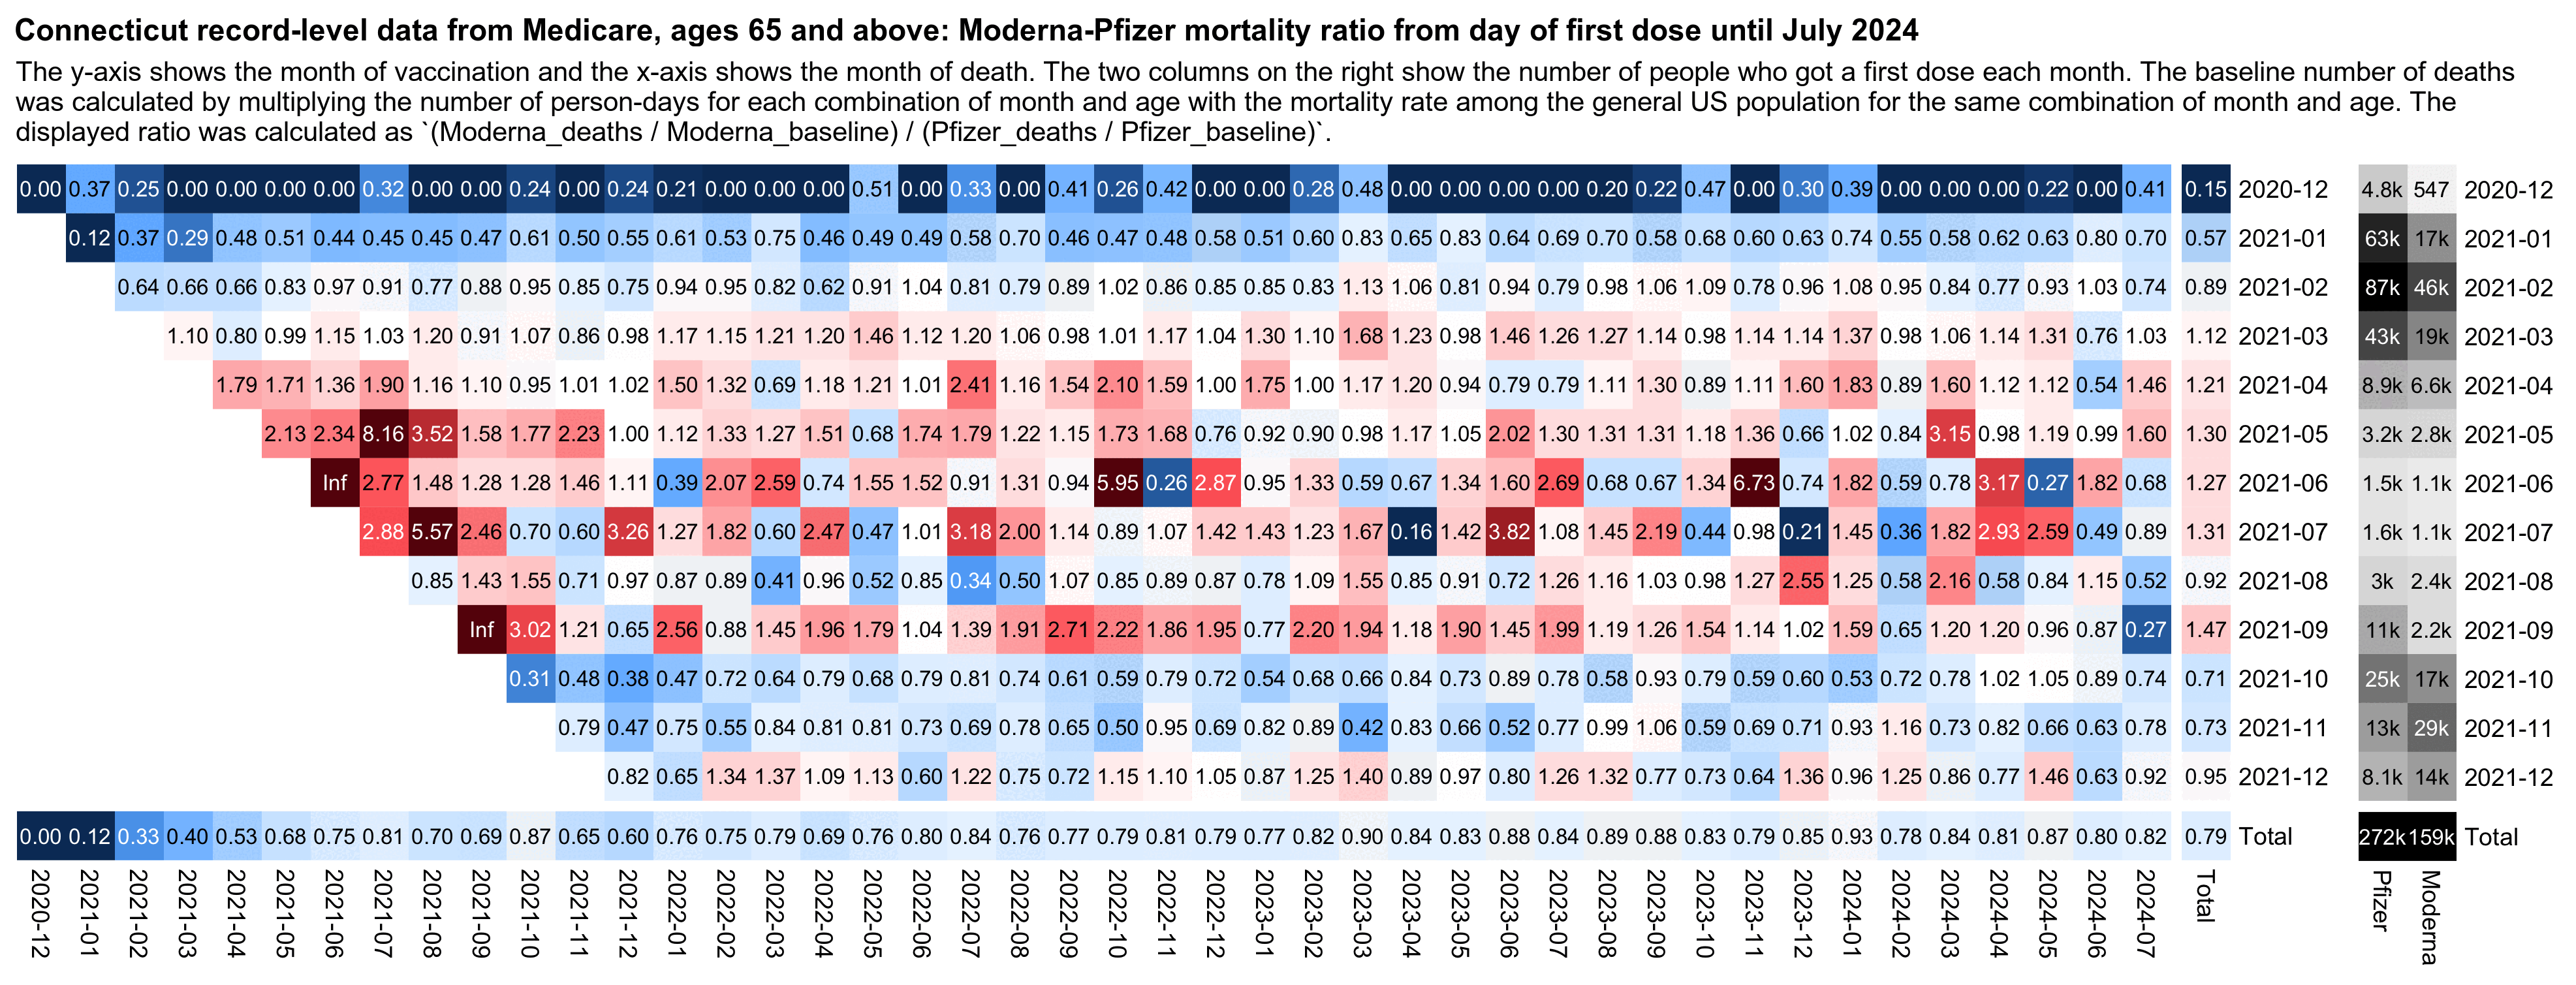
In the new Connecticut data Kirsch now got about 10% higher mortality rate for Pfizer than Moderna, but he again attributed the difference to a difference in vaccine safety, even though this time Pfizer got higher mortality rates than Moderna. When someone asked Kirsch to explain why his results were now different to the Czech data, Kirsch replied: "it's a QA issue. Moderna is more deadly, but the batches are even a greater problem." [https://kirschsubstack.com/p/i-have-been-fully-vindicated-by-the/comment/70688177]

Kirsch also posted this tweet: "This is in Connecticut only. Other states had completely the opposite numbers and it was statistically significant there as well." [https://x.com/stkirsch/status/1840121580405366903] But I think he hasn't published the data for the other states.

In the following code I calculated age-normalized mortality rates in the Connecticut data for each combination of vaccination month, ongoing month, and vaccine brand. And when I divided the rate for Moderna with the rate for Pfizer, the total ratio for all months of vaccination was about 0.79. Moderna got a higher rate among people who got the first dose in March, April, May, June, July, or September 2021, even though during other months the age-normalized rate was higher for Pfizer. So I think it shows that people who got Pfizer and Moderna vaccines had different profiles of confounders during different months of vaccination, even though I guess Kirsch might argue it was rather because some batches were more deadly than others:

library(data.table)

kimi=\(x){e=floor(log10(ifelse(x==0,1,abs(x))));e2=pmax(e,0)%/%3+1
  x[]=ifelse(abs(x)<10,round(x),paste0(round(x/1e3^(e2-1),ifelse(e%%3==0,1,0)),c("","k","M","B","T")[e2]));x}

type1="Moderna";type2="Pfizer"

b=fread("http://sars2.net/f/ctbucketskeep.csv.gz")

a=b[age>=65&dose==1,.(dead=sum(dead),alive=sum(alive)),.(type,month,vaxmonth,age=pmin(age,100))]

pop=fread("http://sars2.net/f/uspopdeadmonthly.csv")
a=merge(a,pop[,.(month=date,age,base=dead/persondays)])[,base:=base*alive]
a=a[month>="2020-12"&vaxmonth>="2020-12"&vaxmonth<="2021-12"]

a=rbind(a,a[,.(dead=sum(dead),alive=sum(alive),base=sum(base),month="Total"),.(age,vaxmonth,type)])
a=rbind(a,a[,.(dead=sum(dead),alive=sum(alive),base=sum(base),vaxmonth="Total"),.(age,month,type)])
a=a[,.(rat=sum(dead)/sum(base),alive=sum(alive)),.(type,vaxmonth,month)]

ar=tapply(a$rat,a[,1:3],c)
m1=ar[type1,,];m2=ar[type2,,]
m=(m1-m2)/ifelse(m1>m2,m2,m1)
disp=m1/m2;disp=ifelse(disp>=10,sprintf("%.1f",disp),sprintf("%.2f",disp))
disp[lower.tri(disp)&row(disp)!=nrow(disp)]=""
exp=.9;m=abs(m)^exp*sign(m)
maxcolor=4^exp
m[m==Inf]=maxcolor;m[m==-Inf]=-maxcolor

pheatmap::pheatmap(m,filename="mort.png",display_numbers=disp,
  gaps_col=ncol(m)-1,gaps_row=nrow(m)-1,cluster_rows=F,cluster_cols=F,legend=F,
  cellwidth=19,cellheight=19,fontsize=9,fontsize_number=8,border_color=NA,na_col="white",
  number_color=ifelse(!is.na(m)&abs(m)>.5*maxcolor,"white","black"),
  breaks=seq(-maxcolor,maxcolor,,256),
  colorRampPalette(hsv(rep(c(7/12,0),4:5),c(.9,.75,.6,.3,0,.3,.6,.75,.9),c(.4,.65,1,1,1,1,1,.65,.4)))(256))

mort=fread("http://sars2.net/f/ctmort.csv.gz")
pop=mort[age>=65&date1<"2022-1-1",table(format(date1,"%Y-%m"),brand)][,c("Pfizer","Moderna")]
pop=rbind(pop,Total=colSums(pop))

exp2=.6;maxcolor2=max(pop[-nrow(pop),])

pheatmap::pheatmap(pop^exp2,filename="pop.png",display_numbers=kimi(pop),
  gaps_row=nrow(m)-1,cluster_rows=F,cluster_cols=F,legend=F,
  cellwidth=19,cellheight=19,fontsize=9,fontsize_number=8,border_color=NA,na_col="white",
  number_color=ifelse(pop^exp2>maxcolor2^exp2*.45,"white","black"),
  breaks=seq(0,maxcolor2^exp2,,256),sapply(seq(1,0,,256),\(i)rgb(i,i,i)))

system("magick mort.png \\( pop.png -chop 14x -splice x5 \\) +append 0.png;w=`identify -format %w 0.png`;pad=22;magick -pointsize 46 -font Arial-Bold -interline-spacing -2 \\( -size $[w-pad*2]x caption:'Connecticut record-level data from Medicare, ages 65 and above: Moderna-Pfizer mortality ratio from day of first dose until July 2024' -splice $[pad]x20 \\) \\( -pointsize 42 -font Arial caption:'The y-axis shows the month of vaccination and the x-axis shows the month of death. The two columns on the right show the number of people who got a first dose each month. The baseline number of deaths was calculated by multiplying the number of person-days for each combination of month and age with the mortality rate among the general US population for the same combination of month and age. The displayed ratio was calculated as `(Moderna_deaths / Moderna_baseline) / (Pfizer_deaths / Pfizer_baseline)`.' -splice $[pad]x14 \\) 0.png -append 1.png")

For third doses the total Moderna-Pfizer ratio was also about 0.8, but for some reason the ratio temporarily shot up to about 1.44 among people who got a third dose in September 2021, even though it fell back down to about 0.60 in people who got the third dose in October 2021:

I wasn't able to include doses from 2022 in the plots above, because the Connecticut dataset only includes a total of 4 third doses with a date in 2022. I don't know if the dataset was meant to only include doses given before 2022 but a few doses from 2022 were accidentally included.

Deaths by weeks since vaccination

Kirsch has claimed that the temporal healthy vaccinee effect only lasts about 3 weeks, because in his old Medicare datasets when he has plotted the number of deaths as a function of weeks since vaccination, the period when there was clearly reduced mortality seemed to last only about 3 weeks like in this plot: [https://kirschsubstack.com/p/game-over-medicare-data-shows-the#%C2%A7the-medicare-data-that-i-received]

There's a bump in deaths around days 20 to 25 after vaccination in the old Medicare data for 2021, but a similar bump is missing from the old Medicare data for 2022:

Kirsch's old Medicare data only included the earliest vaccine dose for each person which was listed in the Medicare database, which was generally the first dose. And in the elderly age groups which account for most deaths, many people got the first dose in the first two months of 2021 when there was rapidly decreasing mortality in the United States because the COVID wave in the winter of 2020 to 2021 was passing by. So I think it explains why there's the bump around days 20 to 25 in 2021 but not 2022.

In the Czech Republic first doses were also rolled out in early 2021 when there was a rapidly decreasing trend in mortality rate because the COVID wave in the winter of 2020 to 2021 was passing by. In the plots below for Czech record-level data, I calculated the light gray baseline by multiplying the number of person-days for each combination of age and month by the mortality rate for the same combination of age and month among the general Czech population, so the there's a huge drop in the light gray baseline during the first 10 weeks from vaccination. But in the dark gray baseline I didn't use a different mortality rate for each month but I simply used the total mortality rate for each age in 2021-2022 as the baseline. Based on the dark gray baseline which is only normalized for age but not ongoing month, it would seem like the temporal healthy vaccinee effect only lasts about 2 or 3 weeks, but based on the light gray baseline the temporal HVE seems to last much longer: [czech.html#Deaths_by_weeks_after_first_dose]

Now when I reproduced the Czech plots above using the new Medicare data, there is in fact a massive drop in the light gray baseline during the first few weeks after vaccination, even though the light baseline started to increase after week 6, so when I calculated excess mortality relative to the light gray baseline, there wasn't a very long extension to the period that seems to be impacted by the temporal HVE:

b=fread("http://sars2.net/f/ctbucketskeep.csv.gz")[dose==1]

a=b[age>=65,.(dead=sum(dead),alive=sum(alive)),.(month,age,week)]

pop=fread("http://sars2.net/f/uspopdeadmonthly.csv")

a=merge(a,pop[,.(base=dead/persondays,month=date,age)])

rate1=a[,.(rate1=sum(dead)/sum(alive)),age]
rate2=a[,.(rate2=sum(dead)/sum(alive)),.(month,age)]
a=merge(rate2,merge(rate1,a),by=c("month","age"))

p=a[,.(excess1=(sum(dead)/sum(rate1*alive)-1)*100,excess2=(sum(dead)/sum(rate2*alive)-1)*100),week]

p=a[,.(dead=sum(dead),base1=sum(rate1*alive),base2=sum(rate2*alive)),week][order(week)]
p=p[week<=100]

leg=c("Deaths","Same baseline for each month","Different baseline for each month")
col=c("black","gray50","gray80")

png("1.png",1200,800,res=200)
par(mar=c(2.3,3,2.1,1.8),mgp=c(0,.6,0))
tit="CT: Deaths by weeks after first dose"
plot(p$week,p$dead,type="l",col=col[1],main=tit,xlab=NA,ylab=NA,lwd=1.5,xaxs="i",yaxs="i",las=1,ylim=c(0,500))
lines(p$week,p$base1,type="l",col=col[2],lwd=1.5)
lines(p$week,p$base2,type="l",col=col[3],lwd=1.5)
legend("bottom",legend=leg,col=col,lty=1,lwd=1.5)
dev.off()

png("2.png",1200,800,res=200)
par(mar=c(2.3,3,2.1,1.8),mgp=c(0,.6,0))
tit="CT: Excess mortality percent by weeks after first dose"
leg=leg[-1];col=col[-1]
plot(p$week,(p$dead/p$base1-1)*100,type="l",col=col[1],main=tit,xlab=NA,ylab=NA,lwd=1.5,xaxs="i",las=1)
lines(p$week,(p$dead/p$base2-1)*100,type="l",col=col[2],lwd=1.5)
abline(h=0,lwd=1.5,lty=2)
legend("bottom",legend=leg,col=col,lty=1,lwd=1.5)
dev.off()

In the plot for Connecticut data above there's close to 0% excess mortality from week 20 onwards if you look at the light gray line where each month has a different baseline. But in the plot for Czech data there was about -20% to -10% excess mortality from around week 20 onwards. In both plots the baseline was derived from the mortality rate of the general population which included both unvaccinated and vaccinated people, but in the US plot vaccinated people who were not included in the new Medicare dataset were included in the baseline but not in the actual deaths.

At first I thought the reason why the plots for Connecticut had close to 0% excess deaths might have been if vaccinated people who are on Medicare had higher ASMR than vaccinated people in the general US population, which might be if people on Medicare have lower SES than the general US population. However I confused Medicaid which is meant for low-income people with Medicare which includes almost the entire US population aged 65 and above. ChatGPT said that about 95-98% of the US population in ages 65 and above is enrolled on Medicare. And based on my calculation below, about 97% of the Connecticut population in ages 65 and above was enrolled on Medicare: [https://data.cms.gov/summary-statistics-on-beneficiary-enrollment/medicare-and-medicaid-reports/medicare-monthly-enrollment]

t=fread("Medicare Monthly Enrollment Data_May2024.csv",na.strings="*")
t[YEAR==2021&MONTH=="Year"&BENE_STATE_ABRVTN=="CT"&BENE_COUNTY_DESC=="Total",28:34]|>sum()
# 626640 # people enrolled to Medicare

pop=fread("https://www2.census.gov/programs-surveys/popest/datasets/2020-2022/state/asrh/sc-est2022-alldata6.csv")
pop[NAME=="Connecticut"&SEX==0&ORIGIN==0&AGE>=65,sum(POPESTIMATE2021)]
# 644196 # resident population estimate

fread("http://sars2.net/f/ctmort.csv.gz")[age>=65,.N]
# 440116 # people in Kirsch's dataset

Based on the calculation above Kirsch's dataset includes only about 70% of the Connecticut population enrolled on Medicare, so Kirsch's dataset seems to be missing some vaccinated people who are enrolled on Medicare, because the percentage of vaccinated people among people who are enrolled on Medicare is probably much higher than 70%.

But as another explanation for why I got close to 0% excess deaths in my plots for Connecticut but not the Czech Republic, the percentage of unvaccinated people is lower in the United States than the Czech Republic, and it's even lower in northeastern states like Connecticut than in the US as a whole. So even if unvaccinated people would have twice as high mortality as vaccinated people in both Connecticut and the Czech Republic, Connecticut has a smaller percentage of unvaccinated people so they have less impact on my baseline mortality rate which includes both vaccinated and unvaccinated people.

ASMR by vaccine brand and month

The Czech Republic had a wave of COVID deaths which peaked around December 2021. But the plot below shows that in the Czech record-level data in December 2021, unvaccinated people had a much more pronounced spike in ASMR than vaccinated people, which might mean that the vaccines were effective at preventing COVID deaths. However among vaccinated people, the spike was more pronounced for Janssen and AstraZeneca which are viral vector vaccines, but the spike was more flat for Moderna and Pfizer which are mRNA vaccines, which might mean that the mRNA vaccines had higher efficacy than the viral vector vaccines: [czech2.html#ASMR_by_month_and_vaccine_type]

Connecticut didn't have any major wave of COVID deaths after the winter of 2020-2021, even though there was a spike in COVID deaths around January 2022 which was smaller than the spike in the Czech Republic around December 2021. In the plot below the spike around January 2022 seems to be more pronounced for Jansssen than Moderna or AstraZeneca, which again might mean that Janssen had lower efficacy than the mRNA vaccines (even though it's hard to tell because Janssen also has wide confidence intervals because of a small sample size, and Janssen also has another fairly large spike in deaths in August 2021 which may have been due to random noise and not COVID because there was a low prevalence of COVID in August 2021):

library(data.table);library(ggplot2)

std=fread("https://www2.census.gov/programs-surveys/popest/datasets/2020-2022/national/asrh/nc-est2022-agesex-res.csv")
std=std[SEX==0&AGE!=999,.(std=POPESTIMATE2021,age=AGE)][,std:=std/sum(std)]

b=fread("http://sars2.net/f/ctbucketskeep.csv.gz")[dose==1&age>=65][,age:=pmin(age,100)]
a=b[,.(dead=sum(dead),alive=sum(alive)),.(type,month,age)]
a=rbind(a,a[,.(dead=sum(dead),alive=sum(alive),type="All vaccine types"),.(month,age)])
p=merge(a,std)[,.(pop=sum(alive),asmr=sum(dead/alive*std*365e5)),.(month,type)]

p[,month:=as.Date(paste0(month,"-1-15"))]

p$type=factor(p$type,c("All vaccine types","Pfizer","Moderna","Janssen"))

xstart=as.Date("2020-12-1");xend=as.Date("2024-7-1")
xbreak=sort(c(as.Date("2024-4-1"),seq(as.Date("2021-1-1"),xend,"6 month")))
xlab=c(rbind("",2021:2024),"")
ystart=0;ystep=500;yend=max(p$asmr);ybreak=seq(ystart,yend,ystep)

color=c("black",hsv(c(240,355,204)/360,c(.94,.75,.67),c(.76,.82,.87)))

ggplot(p,aes(x=month+15,y=asmr))+
geom_vline(xintercept=seq(as.Date("2021-1-1"),xend,"3 month"),color="gray85",linewidth=.3,lineend="square")+
geom_vline(xintercept=seq(as.Date("2021-1-1"),xend,"year"),color="gray65",linewidth=.3,lineend="square")+
geom_vline(xintercept=c(xstart,xend),linewidth=.3,lineend="square")+
geom_hline(yintercept=c(ystart,0,yend),linewidth=.3,lineend="square")+
geom_line(aes(color=type),linewidth=.4)+
geom_point(aes(color=type),stroke=0,size=1,show.legend=F)+
labs(title="Connecticut Medicare data, ages 65+: ASMR by month and brand of first vaccine dose",subtitle=paste0("People are kept included under the first dose after subsequent doses. The 2021 US resident population estimates were used as the standard population.")|>stringr::str_wrap(90),x=NULL,y="ASMR per 100,000 person-years")+
scale_x_date(limits=c(xstart,xend),breaks=xbreak,labels=xlab)+
scale_y_continuous(limits=c(ystart,yend),breaks=seq(ystart,yend,ystep))+
scale_color_manual(values=color)+
coord_cartesian(clip="off",expand=F)+
theme(axis.text=element_text(size=7,color="black"),
  axis.title=element_text(size=7),
  axis.ticks=element_line(linewidth=.3),
  axis.ticks.x=element_line(color=alpha("black",c(1,0))),
  axis.ticks.length=unit(3,"pt"),
  legend.direction="vertical",
  legend.background=element_rect(fill="white",color="black",linewidth=.3),
  legend.key.height=unit(11,"pt"),
  legend.key.width=unit(18,"pt"),
  legend.key=element_rect(fill="white"),
  legend.margin=margin(-1,6,4,4),
  legend.justification=c(1,1),
  legend.position=c(1,1),
  legend.spacing.x=unit(1.5,"pt"),
  legend.text=element_text(size=7),
  legend.title=element_blank(),
  panel.grid.major=element_blank(),
  panel.background=element_rect(fill="white"),
  plot.margin=margin(4,6,4,6),
  plot.subtitle=element_text(size=7,margin=margin(0,0,4,0)),
  plot.title=element_text(size=7.4,face="bold",margin=margin(2,0,4,0)))
ggsave("1.png",width=4.8,height=2.7,dpi=400)

Plot of excess deaths, COVID deaths and cases, PCR positivity, and vaccine doses in Connecticut

The next plot shows shows that in April 2021 when new vaccine doses peaked in Connecticut, the seasonality-adjusted excess mortality was negative. And spikes in excess deaths also coincided with spikes in PCR positivity rate, so it's difficult to blame the excess deaths on vaccines:

All lines in my plot are smoothed splines. My plot is based on these datasets:

Increase in people with a first dose in late 2021 pointed out by Uncle John Returns

Uncle John Returns posted this tweet: [https://x.com/UncleJo46902375/status/1840441446777683997]

Here's the Medicare uptake from Kirsch's substack and state uptake from http://ct.gov

During Oct-Dec 2021, the Medicare dose 1 uptake increased by more than the state total

That's impossible

However I suspect the new dataset has some third doses listed as first doses if they were the earliest known dose in the Medicare database. The old spreadsheet of Medicare data that Kirsch released in February 2023 included these comments: [https://kirschsubstack.com/p/game-over-medicare-data-shows-the#%c2%a7the-medicare-data-that-i-received]

The new Medicare data has no people with a first dose missing, which would be unusual if the new Medicare data would be missing people who got vaccinated outside the Medicare system like the old Medicare data, unless in fact the first dose means the earliest dose that was included in the Medicare database which was not always the actual first dose.

Deaths by weeks since vaccination and vaccine brand

Ulf Lorré published a Substack post about the Connecticut data, where he included these plots which appear to show that the temporal healthy vaccinee effect is much stronger for Moderna than Pfizer vaccines: [https://ulflorr.substack.com/p/more-about-steve-kirschs-medicare]

However he didn't take into account that in the first three months of 2021, all-cause mortality in Connecticut was falling rapidly because the COVID wave in the winter of 2020 to 2021 was passing by, but the percentage of doses administered by the end of March 2021 was about 70% for Pfizer but about 50% for Moderna. There was also an increasing trend in the background mortality rate during the last three months of 2021, but the percentage of first doses that were given in the last three months of 2021 was about 37% for Moderna and 17% for Pfizer (even though most of those were probably misclassified third doses):

library(data.table);library(ggplot2)

w=fread("Weekly_Provisional_Counts_of_Deaths_by_State_and_Select_Causes__2020-2023_20240930.csv")
w=w[`Jurisdiction of Occurrence`=="Connecticut"]
w=w[,.(date=`Week Ending Date`-6,dead=`All Cause`,covid=`COVID-19 (U071, Underlying Cause of Death)`)]

ct=fread("http://sars2.net/f/ctmort.csv.gz")
ct=ct[year(date1)<2022,.N,.(brand,date=date1)]
ct=rbind(ct,do.call(CJ,lapply(ct[,-3],unique))[,N:=0])|>unique(by=1:2)
p=ct[order(date)][,cum:=cumsum(N)/sum(N)*100,brand]

p$brand=factor(p$brand,c("Pfizer","Moderna","Janssen"))

xstart=as.Date("2020-12-1");xend=as.Date("2022-1-1")
xbreak=seq(xstart,xend,"month");xbreak=sort(c(xbreak,head(xbreak,-1)+15))
xlab=c(rbind("",format(seq(xstart,xend-1,"month"),"%b\n%y")),"")
ystart=0;yend=100;ystep=10;ybreak=seq(ystart,yend,ystep)

w=rbind(w[date<xstart][.N][,date:=as.IDate(xstart)],w)
w=w[date>=xstart&date<=xend]
w=rbind(w,tail(w,1)[,date:=as.IDate(xend)])
yend2=1000;ystep2=200;secmult=yend/yend2

color=hsv(c(240,355,204)/360,c(.94,.75,.67),c(.76,.82,.87))

ggplot(p,aes(x=date,y=cum))+
geom_vline(xintercept=c(xstart,xend),linewidth=.3,lineend="square")+
geom_hline(yintercept=c(ystart,0,yend),linewidth=.3,lineend="square")+
geom_line(aes(color=brand),linewidth=.4)+
geom_step(data=w,aes(y=dead*secmult),linewidth=.4)+
labs(title="CT Medicare data: Cumulative percentage of first doses administered by vaccine type"|>stringr::str_wrap(66),x=NULL,y="Cumulative first doses administered")+
scale_x_date(limits=c(xstart,xend),breaks=xbreak,labels=xlab)+
scale_y_continuous(limits=c(ystart,yend),breaks=seq(ystart,yend,ystep),labels=\(x)paste0(x,"%"),sec.axis=sec_axis(trans=~./secmult,breaks=seq(0,yend2,ystep2),name="Weekly deaths in Connecticut"))+
scale_color_manual(values=color)+
coord_cartesian(clip="off",expand=F)+
theme(axis.text=element_text(size=7,color="black"),
  axis.ticks=element_line(linewidth=.3),
  axis.ticks.x=element_line(color=alpha("black",c(1,0))),
  axis.text.x=element_text(vjust=1),
  axis.ticks.length=unit(3,"pt"),
  axis.title=element_text(size=7),
  legend.background=element_blank(),
  legend.box.spacing=unit(0,"pt"),
  legend.direction="horizontal",
  legend.key.height=unit(11,"pt"),
  legend.key.width=unit(18,"pt"),
  legend.key=element_blank(),
  legend.margin=margin(-2,,3),
  legend.position="top",
  legend.justification="left",
  legend.spacing.x=unit(1.5,"pt"),
  legend.text=element_text(size=7),
  legend.title=element_blank(),
  panel.grid=element_blank(),
  panel.background=element_blank(),
  plot.margin=margin(4,5,4,5),
  plot.title=element_text(size=7.4,face="bold",margin=margin(2,,4)))
ggsave("1.png",width=4,height=2.5,dpi=380*4)
system("magick 1.png -resize 25% 1.png")

In the next plot I plotted deaths by weeks since vaccination and vaccine type, but I calculated a baseline number of deaths by multiplying the number of person-days for each combination of month and age with the mortality rate in Connecticut for the same combination of month and age. I had to aggregate together ages 85 and above because I used population estimates published by the US Census Bureau where ages 85 and above were aggregated together. [https://www2.census.gov/programs-surveys/popest/datasets/2020-2022/state/asrh/sc-est2022-agesex-civ.csv] But anyway, during the first 10 weeks from vaccination, Pfizer had a sharp drop in the baseline but the baseline for Moderna remained roughly flat:

library(data.table);library(ggplot2)

base=fread("http://sars2.net/f/ctpopdeadmonthly.csv")
base=base[,.(age,month=date,base=dead/pop/lubridate::days_in_month(paste0(date,"-1")))]

b=fread("http://sars2.net/f/ctbucketskeep.csv.gz")[dose==1&age>=65][,age:=pmin(age,85)]
a=b[,.(dead=sum(dead),alive=sum(alive)),.(type,age,week,month)]
a=merge(a,base)[,base:=base*alive]
p=a[,.(dead=sum(dead),base=sum(base)),.(type,week)][week<=50]

p$type=factor(p$type,c("Pfizer","Moderna","Janssen"))

xstart=0;xend=50;xbreak=0:10*5
ystart=0;ystep=50;yend=300;ybreak=seq(ystart,yend,ystep)

color=hsv(c(240,355,204)/360,c(.94,.75,.67),c(.76,.82,.87))

ggplot(p,aes(x=week,y=dead))+
geom_vline(xintercept=c(xstart,xend),linewidth=.3,lineend="square")+
geom_hline(yintercept=c(ystart,0,yend),linewidth=.3,lineend="square")+
geom_line(aes(color=type),linewidth=.4)+
geom_point(aes(color=type),stroke=0,size=1,show.legend=F)+
geom_line(aes(color=type,y=base),linewidth=.4,linetype=2)+
labs(title="CT Medicare data, ages 65+: Deaths by weeks after vaccination and brand of first vaccine dose"|>stringr::str_wrap(70),subtitle="The dashed line is a baseline which was calculated by multiplying the number of person-days for each combination of month and age with the mortality rate for the same combination of month and age among the general population of Connecticut."|>stringr::str_wrap(80),x=NULL,y=NULL)+
scale_x_continuous(limits=c(xstart,xend),breaks=xbreak)+
scale_y_continuous(limits=c(ystart,yend),breaks=seq(ystart,yend,ystep))+
scale_color_manual(values=color)+
coord_cartesian(clip="off",expand=F)+
theme(axis.text=element_text(size=7,color="black"),
  axis.ticks=element_line(linewidth=.3),
  axis.ticks.length=unit(3,"pt"),
  legend.background=element_blank(),
  legend.box.spacing=unit(0,"pt"),
  legend.direction="horizontal",
  legend.key.height=unit(11,"pt"),
  legend.key.width=unit(18,"pt"),
  legend.key=element_blank(),
  legend.margin=margin(3,,1),
  legend.position="bottom",
  legend.spacing.x=unit(1.5,"pt"),
  legend.text=element_text(size=7),
  legend.title=element_blank(),
  panel.grid=element_blank(),
  panel.background=element_blank(),
  plot.margin=margin(4,10,4,6),
  plot.subtitle=element_text(size=7,margin=margin(0,0,4,0)),
  plot.title=element_text(size=7.4,face="bold",margin=margin(2,0,4,0)))
ggsave("1.png",width=4,height=2.7,dpi=400)

This shows excess mortality as a percentage of the baseline:

Moderna-Pfizer mortality ratio by age group and month of vaccination

Ulf Lorré got a higher risk ratio for Pfizer than Moderna in most ages which had a sufficiently large sample size: [https://x.com/ULorre/status/1841193612543213775]

However the Moderna-Pfizer mortality ratio also varies heavily depending on the month of vaccination. Here among people who got the first dose in March, April, May, June, July, or September 2021, Moderna got a higher normalized mortality rate than Pfizer in most age groups:

library(data.table)

kimi=\(x){e=floor(log10(ifelse(x==0,1,abs(x))));e2=pmax(e,0)%/%3+1
  x[]=ifelse(abs(x)<10,round(x),paste0(round(x/1e3^(e2-1),ifelse(e%%3==0,1,0)),c("","k","M","B","T")[e2]));x}

agecut=\(x,y)cut(x,c(y,Inf),paste0(y,c(paste0("-",y[-1]-1),"+")),T,F)
yemo=\(x,y){u=unique(x);p=as.POSIXlt(as.Date(u));sprintf("%d-%02d",p$year+1900,p$mon+1)[match(x,u)]}

type1="Moderna";type2="Pfizer"

b=fread("http://sars2.net/f/ctbucketskeep.csv.gz")

a=b[age>=65&dose==1,.(dead=sum(dead),alive=sum(alive)),.(type,month,vaxmonth,age=pmin(age,100))]

pop=fread("http://sars2.net/f/uspopdeadmonthly.csv")
a=merge(a,pop[,.(month=date,age,base=dead/persondays)])[,base:=base*alive]
a=a[vaxmonth>="2020-12"&vaxmonth<="2021-12"]

a=a[,.(dead=sum(dead),base=sum(base),alive=sum(alive)),.(type,vaxmonth,age=agecut(age,seq(65,95,5)))]
a=rbind(a,a[,.(dead=sum(dead),alive=sum(alive),base=sum(base),age="Total"),.(vaxmonth,type)])
a=rbind(a,a[,.(dead=sum(dead),alive=sum(alive),base=sum(base),vaxmonth="Total"),.(age,type)])

ar=tapply(a$dead/a$base,a[,1:3],c)
m1=ar[type1,,];m2=ar[type2,,]
m=(m1-m2)/ifelse(m1>m2,m2,m1)
disp=m1/m2;disp=ifelse(disp>=10,sprintf("%.1f",disp),sprintf("%.2f",disp))
exp=.9;m=abs(m)^exp*sign(m)
maxcolor=4^exp
m[m==Inf]=maxcolor;m[m==-Inf]=-maxcolor

pheatmap::pheatmap(m,filename="mort.png",display_numbers=disp,
  main="Moderna-Pfizer ratio",
  gaps_col=ncol(m)-1,gaps_row=nrow(m)-1,cluster_rows=F,cluster_cols=F,legend=F,
  cellwidth=18,cellheight=18,fontsize=9,fontsize_number=8,border_color=NA,na_col="white",
  number_color=ifelse(!is.na(m)&abs(m)>.5*maxcolor,"white","black"),
  breaks=seq(-maxcolor,maxcolor,,256),
  colorRampPalette(hsv(rep(c(7/12,0),4:5),c(.9,.75,.6,.3,0,.3,.6,.75,.9),c(.4,.65,1,1,1,1,1,.65,.4)))(256))

ct=fread("http://sars2.net/f/ctmort.csv.gz")
ct=ct[age>=65&year(date1)<2022,.N,.(brand,month=yemo(date1),age=agecut(pmin(age,95),seq(65,95,5)))]
maxcolor2=max(ct$N)
ct=rbind(ct,ct[,.(N=sum(N),month="Total"),.(age,brand)])
ct=rbind(ct,ct[,.(N=sum(N),age="Total"),.(month,brand)])
pop1=ct[brand=="Pfizer",xtabs(N~month+age)]
pop2=ct[brand=="Moderna",xtabs(N~month+age)]

exp2=.6

pheatmap::pheatmap(pop1^exp2,filename="pop1.png",display_numbers=kimi(pop1),
  main="Pfizer doses",
  gaps_row=nrow(m)-1,cluster_rows=F,cluster_cols=F,legend=F,
  cellwidth=18,cellheight=18,fontsize=9,fontsize_number=8,border_color=NA,na_col="white",
  number_color=ifelse(pop1^exp2>maxcolor2^exp2*.45,"white","black"),
  breaks=seq(0,maxcolor2^exp2,,256),sapply(seq(1,0,,256),\(i)rgb(i,i,i)))

pheatmap::pheatmap(pop2^exp2,filename="pop2.png",display_numbers=kimi(pop2),
  main="Moderna doses",
  gaps_row=nrow(m)-1,cluster_rows=F,cluster_cols=F,legend=F,
  cellwidth=18,cellheight=18,fontsize=9,fontsize_number=8,border_color=NA,na_col="white",
  number_color=ifelse(pop2^exp2>maxcolor2^exp2*.45,"white","black"),
  breaks=seq(0,maxcolor2^exp2,,256),sapply(seq(1,0,,256),\(i)rgb(i,i,i)))

cap="The x-axis shows age groups and the y-axis shows the month of vaccination. The displayed ratio was calculated as `(Moderna_deaths / Moderna_baseline) / (Pfizer_deaths / Pfizer_baseline)`. The baseline number of deaths was calculated by multiplying the number of person-days for each combination of month and single year of age with the mortality rate among the general US population for the same combination of month and age."
system(paste0("magick mort.png pop[12].png +append 0.png;w=`identify -format %w 0.png`;pad=22;magick -pointsize 46 -font Arial-Bold -interline-spacing -2 \\( -size $[w-pad*2]x caption:'Connecticut record-level data from Medicare, ages 65 and above: Moderna-Pfizer mortality ratio from day of first dose until July 2024' -splice $[pad]x20 \\) \\( -pointsize 42 -font Arial caption:'",cap,"' -splice $[pad]x26 \\) 0.png -append 1.png"))

Comparison of deaths by weeks since vaccination to other datasets

In March 2022 Clare Craig, Martin Neil, Norman Fenton, and Scott McLachlan published a preprint titled "Official mortality data for England reveal systematic undercounting of deaths occurring within first two weeks of Covid-19 vaccination". [https://www.researchgate.net/publication/358979921_Official_mortality_data_for_England_reveal_systematic_undercounting_of_deaths_occurring_within_first_two_weeks_of_Covid-19_vaccination] Craig et al. speculated that because the ONS dataset for deaths by vaccination status had a low number of non-COVID deaths in the first two weeks after vaccination, deaths that occurred soon after vaccination were somehow systematically omitted or misclassified.

However there is also a very low number of deaths in the first few weeks after vaccination in the old record-level datasets that Kirsch has published from New Zealand, the Maldives, and the United States. The datasets show the date of vaccination and date of death of individual people, so you can calculate the number of deaths by weeks since vaccination manually so that you know for sure that there is no trick used where vaccinated people would be classified as unvaccinated for 1 to 3 weeks after vaccination. I have pointed it out to Neil and Fenton and I have tried to get them to look at Kirsch's record-level datasets, but I don't think I have been successful.

Craig et al. wrote: "The healthy vaccinee hypothesis, that those close to death will postpone or decline vaccination might hypothetically account for a lower rate of death in the first two weeks. But as an explanation it is only plausible if every possible death that might occur in the first two weeks, after the offer of vaccination, was foreknown whilst those deaths in the third week were not, and hence those dying in the third week did not postpone or decline vaccination." However Craig et al. didn't take into account that the temporal healthy vaccinee effect actually lasts longer than 2 weeks, but if you plot deaths by weeks since the first dose in England, the increasing trend in mortality caused by the waning out of the temporal HVE is counteracted by the decreasing trend in the background mortality rate, because many first doses in England were given in the first three months of 2021 when the mortality rate was falling rapidly because the COVID wave in the winter was passing by.

A similar effect can be seen in the plot below which shows deaths by weeks since the first dose in the new Connecticut Medicare data and in the Czech record-level data, because in both Connecticut and the Czech Republic many people got first doses at a time when there was a sharply decreasing background mortality rate because a COVID wave was passing by. But in New Zealand the period after vaccination when there was reduced mortality seems to last longer, because New Zealand had not yet been hit by COVID in 2021 when first dose was rolled out:

library(data.table);library(ggplot2)

dlf=\(x,y,...){if(missing(y))y=sub(".*/","",x);for(i in 1:length(x))download.file(x[i],y[i],quiet=T,...)}
dlf("http://sars2.net/f/ctmort.csv.gz")
dlf("http://sars2.net/f/kirsch_medicare_connecticut.csv")
dlf("http://sars2.net/f/kirsch_medicare_all_states_subset.csv")
dlf("http://sars2.net/f/ons-table-9-deaths-by-weeks-after-vaccination.csv")
dlf("http://sars2.net/f/kirsch_maldives.csv")
dlf("https://github.com/skirsch/NewZealand/blob/main/data/nz-record-level-data-4M-records.csv.gz")
dlf("https://github.com/skirsch/Czech/raw/refs/heads/main/data/CR_records.csv.xz")

ct=fread("ctmort.csv.gz")
p=ct[!is.na(dead)&dead>=date1,.(y=.N,z="New Medicare Connecticut"),.((x=dead-date1)%/%7)]

ctold=fread("kirsch_medicare_connecticut.csv")
p=rbind(p,ctold[,.(y=.N,z="Old Medicare Connecticut"),.(x=(death_dt-vaxxdate_1)%/%7)])

medi=fread("kirsch_medicare_all_states_subset.csv")
p=rbind(p,medi[,.(y=.N,z="Old Medicare all states subset"),.(x=(date_of_death-date_of_vaccination)%/%7)])

ons=fread("ons-table-9-deaths-by-weeks-after-vaccination.csv",na="<3")
p=rbind(p,ons[week!="12+",.(y=sum(covid+noncovid,na.rm=T),z="ONS deaths by vaccination status"),.(x=as.numeric(week)-1)])

nz=fread("nz-record-level-data-4M-records.csv.gz")
ua=\(x,y,...){u=unique(x);y(u,...)[match(x,u)]}
for(i in grep("date",names(nz)))nz[[i]]=ua(nz[[i]],as.Date,"%m-%d-%Y")
p=rbind(p,nz[dose_number==1,.(y=.N,z="Barry Young's New Zealand data"),.(x=(as.numeric(date_of_death-date_time_of_service))%/%7)])

cz=fread("xz -dc CR_records.csv.xz")
p=rbind(p,cz[,.(y=.N,z="Czech FOI response"),.(x=(DatumUmrti-Datum_1)%/%7)])

mal=fread("kirsch_maldives.csv",na="unknown")
p=rbind(p,mal[,.(y=.N,z="Maldives"),.(x=(date_of_death-dose_1)%/%7)])

p=p[!is.na(x)&x%in%0:50]
p[,y:=y/max(y)*100,z]
p[,z:=factor(z,unique(z))]

xstart=0;xend=50;xbreak=0:10*5;ystart=0;yend=100;ybreak=0:5*20

color=c("black","gray60",hsv(c(4,0,24,30,12)/36,.9,.7))

ggplot(p,aes(x,y))+
geom_vline(xintercept=c(xstart,xend),linewidth=.3,lineend="square")+
geom_hline(yintercept=c(ystart,yend),linewidth=.3,lineend="square")+
geom_line(aes(color=z),linewidth=.4)+
geom_point(aes(color=z),stroke=0,size=1)+
labs(title="Deaths by weeks since first dose, percentage of maximum value",subtitle="Week 0 consists of the day of vaccination and the next 6 days",x=NULL,y=NULL)+
scale_x_continuous(limits=c(xstart,xend),breaks=xbreak)+
scale_y_continuous(limits=c(ystart,yend),breaks=ybreak,labels=\(x)paste0(x,"%"))+
scale_color_manual(values=color)+
coord_cartesian(clip="off",expand=F)+
guides(color=guide_legend(ncol=2))+
theme(axis.text=element_text(size=7,color="black"),
  axis.ticks=element_line(linewidth=.3),
  axis.ticks.length=unit(3,"pt"),
  legend.background=element_blank(),
  legend.box.spacing=unit(0,"pt"),
  legend.direction="horizontal",
  legend.key.height=unit(11,"pt"),
  legend.key.width=unit(18,"pt"),
  legend.key=element_blank(),
  legend.margin=margin(3,,1),
  legend.position="bottom",
  legend.spacing.x=unit(1.5,"pt"),
  legend.text=element_text(size=7),
  legend.title=element_blank(),
  panel.grid=element_blank(),
  panel.background=element_blank(),
  plot.margin=margin(4,10,4,6),
  plot.subtitle=element_text(size=7,margin=margin(0,0,4,0)),
  plot.title=element_text(size=7.4,face="bold",margin=margin(2,0,4,0)))
ggsave("1.png",width=4,height=2.7,dpi=380*4)
system("magick 1.png -resize 25% 1.png")

And if you look at third doses instead of first doses, then the temporal HVE seems to last longer in both Connecticut and the Czech Republic:

However I guess Clare Craig may have later come to the conclusion that the low number of deaths during the first two weeks might be due to the HVE, because in 2024 when someone asked her what she meant by the healthy vaccinee effect, she answered that "Studies show that the first few weeks after vaccination are outliers because people who are feeling ill postpone." [https://x.com/ClareCraigPath/status/1844085783365550508]

ChatGPT's comments about Kirsch's analysis

Kirsch's analysis of the Connecticut data mostly relied on ChatGPT which he called the "world's most objective epidemiologist". So when I pasted Kirsch's Substack post to ChatGPT and asked if his analysis was valid, ChatGPT raised several good points about the analysis:

[...]

[...]

[...]

ASMR by month of vaccination

In the New Zealand released by Barry Young, in the English UKHSA FOI data that was given to Clare Craig in May 2024, and in the Czech record-level data, I have identified a phenomenon I'm calling the "early vaccinee effect", where there was subsequently low mortality in the early vaccinees who got vaccinated during the rollout peak or during the period leading up to the peak, but there was subsequently much higher mortality in the late vaccinees who got vaccinated after the rollout peak had passed.

Now the plot below shows that a similar phenomenon can also be seen in the new Connecticut data, where in the case of both Pfizer and Moderna, the number of first doses administered peaked in Feburary 2021 (even though people who got the first dose in the last 3 months of 2021 subsequently had fairly low ASMR, but most of the doses were actually misclassified third doses):

library(data.table);library(ggplot2)

std=fread("https://www2.census.gov/programs-surveys/popest/datasets/2020-2022/national/asrh/nc-est2022-agesex-res.csv")
std=std[SEX==0&AGE!=999,.(std=sum(POPESTIMATE2021)),.(age=pmin(AGE,95)%/%5*5)][,std:=std/sum(std)]

b=fread("http://sars2.net/f/ctbucketskeep.csv.gz")[dose==1&age>=65&vaxmonth<="2021-12"]
a=b[,.(dead=sum(dead),alive=sum(alive)),.(type,vaxmonth,age=pmin(age,95)%/%5*5)]
p=merge(a,std)[,.(pop=sum(alive),asmr=sum(dead/alive*std*365e5)),.(month=vaxmonth,type)]

ct=fread("http://sars2.net/f/ctmort.csv.gz")
ct=ct[year(date1)<2022,.N,.(month=factor(format(date1,"%Y-%m")),type=brand)]
ct=ct[,.(pct=N/sum(N)*100,month),type]
ct=rbind(ct,cbind(expand.grid(lapply(ct[,-2],unique)),pct=0))|>unique(by=c(1,3))

lev=c("Pfizer","Moderna","Janssen")
p$type=factor(p$type,lev)
ct$type=factor(ct$type,lev)

xlab=format(as.Date(paste0(unique(p$month),"-1")),"%b\n%y")
ystart=0;ystep=500;yend=3000;ybreak=seq(ystart,yend,ystep)
yend2=30;ystep2=5;secmult=yend/yend2

color=hsv(c(240,355,204)/360,c(.94,.75,.67),c(.76,.82,.87))

exp=.7

ggplot(p,aes(x=month,y=asmr))+
geom_vline(xintercept=c(1-exp,length(xlab)+exp),linewidth=.3,lineend="square")+
geom_hline(yintercept=c(ystart,0,yend),linewidth=.3,lineend="square")+
geom_bar(data=ct,aes(y=pct*secmult,fill=type,color=type),alpha=.3,stat="identity",position="dodge",linewidth=0,width=.6,show.legend=F)+
geom_line(aes(color=type,group=type),linewidth=.4)+
geom_point(aes(color=type),stroke=0,size=1,show.legend=F)+
labs(title="CT Medicare data, ages 65+: ASMR by vaccination month and brand of first dose",subtitle=paste0("ASMR was calculated by 5-year age groups so that the 2021 US resident population estimates were used as the standard population.")|>stringr::str_wrap(90),x=NULL,y="ASMR per 100,000 person-years")+
scale_x_discrete(expand=expansion(mult=0,add=exp),labels=xlab)+
scale_y_continuous(limits=c(ystart,yend),breaks=seq(ystart,yend,ystep),expand=expansion(0),sec.axis=sec_axis(trans=~./secmult,breaks=seq(0,yend2,ystep2),name="Percentage of doses administered for type"))+
scale_color_manual(values=color)+
scale_fill_manual(values=color)+
coord_cartesian(clip="off")+
theme(axis.text=element_text(size=7,color="black"),
  axis.title=element_text(size=7),
  axis.ticks=element_line(linewidth=.3),
  axis.ticks.x=element_line(color=alpha("black",c(1,0))),
  axis.ticks.length=unit(3,"pt"),
  axis.title.y.right=element_text(margin=margin(,,,5)),
  legend.direction="vertical",
  legend.background=element_rect(fill="white",color="black",linewidth=.3),
  legend.key.height=unit(11,"pt"),
  legend.key.width=unit(18,"pt"),
  legend.key=element_rect(fill="white"),
  legend.margin=margin(-1,6,4,4),
  legend.justification=c(1,1),
  legend.position=c(1,1),
  legend.spacing.x=unit(1.5,"pt"),
  legend.text=element_text(size=7),
  legend.title=element_blank(),
  panel.grid.major=element_blank(),
  panel.background=element_rect(fill="white"),
  plot.margin=margin(4,6,4,6),
  plot.subtitle=element_text(size=7,margin=margin(0,0,4,0)),
  plot.title=element_text(size=7.4,face="bold",margin=margin(2,0,4,0)))
ggsave("1.png",width=4.8,height=2.7,dpi=400*4)
system("magick 1.png -resize 25% 1.png")

The plot above also shows that in December 2020 Pfizer accounted for almost all vaccine doses, but people who got a Pfizer vaccine in December 2020 subsequently had very high ASMR. So could it be that vulnerable people who were priorized during early rollout are overrepresented among people who got a Pfizer vaccine? It might partially explain why during the first three months in the plot above Pfizer has higher ASMR than Moderna but afterwards it's the other way around. (Even though on the other hand the total number of doses administered in December 2020 is so small that it doesn't have much impact on the total ASMR across all vaccination months, and Pfizer also had higher ASMR than Moderna in January and February 2021 which were the two months that had the highest number of Pfizer doses administered.)